The 2026 Criteria: Designing and Delivering High-Quality Carbon Removal
Key Takeaways
- High-quality carbon dioxide removal (CDR) projects require robust project management and oversight to deliver credits on time and at the promised volume; delivery risk is a distinct concern that quality standards alone don't catch.
- The sixth edition of the Criteria for High-Quality Carbon Dioxide Removal is the first to provide an approach to evaluating both credit quality and delivery risk, adding a new delivery risk appendix built around the TECOP framework: technical, economic, commercial, organizational, and political risk.
- The 2026 Criteria provides a framework for developers, investors, and buyers to evaluate both project quality and delivery risk.
- This year's update draws on 170 new diligence reports from 2025 and the input of more than 60 subject matter experts, building on a foundation of six years of lessons from professional diligence across hundreds of real-world CDR projects.
The Criteria Create a Shared Standard for Credit Quality
Relae (formerly Carbon Direct) first launched the Criteria for High-Quality Carbon Dioxide Removal (the Criteria) in collaboration with Microsoft in 2021 to help rapidly and justly scale the development of high-quality carbon dioxide removal (CDR) credits. The market didn't yet have a shared definition of what "high-quality" meant, so we laid out transparent, science-based benchmarks that gave developers, investors, and buyers a common foundation to work from. Every year since, we have gone back and sharpened those benchmarks so that they keep pace with the quickly evolving industry.
But a shared definition of quality doesn't guarantee the delivery of credits as planned. The 2026 edition is the first to tackle that gap directly, pairing the Criteria's quality benchmarks with a new framework for evaluating delivery risk.
The Six Principles of High-Quality Carbon Removal
The Criteria defines six science-based principles that apply across engineered, hybrid, and nature-based CDR approaches:
- Social harms, benefits, and environmental justice: The extent to which the project prevents new social harms to people and communities, reduces existing harms, and provides meaningful benefits distribution.
- Environmental harms and benefits: The extent to which the project minimizes and mitigates environmental harms, as well as provides environmental benefits.
- Additionality and baselines: The evidence that the project’s carbon removal would not have occurred without carbon finance.
- Measurement, monitoring, reporting, and verification (MMRV): The ability to accurately quantify carbon removal in a repeatable and verifiable way, and to develop a plan for long-term monitoring of the project.
- Durability: The likelihood that removed carbon remains stored over time, with mechanisms in place to mitigate reversal risk.
- Leakage: The extent to which project activities cause increased emissions elsewhere.
These principles provide a consistent foundation for carbon removal procurement, evaluation, and project benchmarking.
[cta]
Supporting the Delivery of High-Quality CDR Credits
"Projects must work better operationally and be more commercial. Quality and delivery risk shape a project's risk profile at every point in its life, and this edition of the Criteria is the first to give buyers a way to judge both at once." Dr. Julio Friedmann, Chief Scientist, Relae
Designing projects to meet high-quality CDR criteria is only part of the challenge. Effective project planning, management, and execution are also essential to ensure that high-quality CDR tonnes successfully reach the market as planned. As discussed in CDR 2.0: Five Pillars of Successful Project Deployment and Delivery, managing delivery risk requires developers, investors, and buyers to understand the risks that can affect project success and align on how these risks are assessed and mitigated.
To support this alignment, the 2026 Criteria introduced a new Delivery Risk Appendix, which establishes a common framework and language for identifying and evaluating key delivery risks for the first time. Drawing on our broader observations of the carbon removal market and established approaches to project risk management, the appendix highlights common delivery risks across two broad CDR project types: open systems and closed systems. It organizes these risks into five categories: technical, economic, commercial, organizational, and political factors, also known as the TECOP framework.
The TECOP Framework for CDR Delivery Risk
- Technical delivery risks are associated with the technical feasibility of the project design, implementation, and long-term operation of the project
- Economic delivery risks are associated with the project’s financing structure, financial modeling assumptions, and expenditure profile
- Commercial delivery risk reflects the extent to which a project's purchase agreements, supply arrangements, and key contractual relationships are secured or well-advanced.
- Organizational delivery risks center on the project developer's capacity and capability to successfully plan, execute, and manage a project of the appropriate size and complexity.
- Political delivery risks are associated with governance, policies, and potential changes in regulatory environments, as well as the local communities’ perception of and willingness to participate in projects.
New Additions to the 2026 Criteria
Since publishing the 2025 Criteria, Relae has conducted an additional 170 diligence reports across established and emerging CDR pathways, ranging from reforestation and enhanced rock weathering (ERW) to direct air capture (DAC). To date, less than 10% of all 900+ projects the team has reviewed have met the bar for high-quality. These diligence efforts, together with insights from market analysis and ongoing synthesis of the latest scientific and technical literature, have deepened our understanding of how CDR project quality has evolved over the past year.
The 2026 Criteria leverage these insights and the expertise of more than 60 subject matter experts to reflect advances across the CDR industry and address key weaknesses that remain in the market across all pathways.
A few of the most significant updates to the Criteria include:
Addition of Direct Counterparty Considerations: Direct counterparties are the organizations that developers partner with, and are structurally dependent on, to generate credits. This can include:
- Primary feedstock providers (e.g., mines, biomass providers, tree nurseries)
- Major implementing partners (e.g., local implementation partners, base facilities, transportation and storage providers, major product offtakers)
- Land owners that make up a significant proportion of project land
To reflect the key role that direct counterparties play in high-quality credit generation, developers must conduct diligence and disclose on their direct counterparties to demonstrate that they are not causing social or environmental harm.
Increased Rigor for Enhanced Rock Weathering Projects: Over the past year, ERW’s presence in the CDR market has grown substantially, and so too has the market’s understanding of the corresponding scientific and technical rigor required to deliver high-quality tonnes. The 2026 Criteria raised the bar for how ERW projects:
- Measure and prove their carbon removal claims
- Mitigate risks related to potentially toxic elements (PTEs)
- Incorporate more sophisticated farmer protections and benefits
Projects now have to back up their numbers with multiple physical field measurements, not just computer models; and they must now track and account for every significant loss pathway, from plants taking up minerals to carbon escaping from rivers and oceans.
Use of Dynamic Baselines for ARR Projects: ARR projects are increasingly using dynamic baselines to provide a more accurate reflection of the counterfactual scenario (e.g., what would have happened in the absence of the project). This is reflected in the 2026 Criteria with a requirement that ARR projects, with the exception of agroforestry projects, use dynamic baselines with statistically matched controls.
What’s Next?
The 2026 Criteria create a clear, science-driven framework for both designing and delivering measurable, just, and durable carbon removal. However, the Criteria cannot ensure high-quality tonnes reach the market on its own; good criteria do not replace robust diligence. To put these criteria into practice, we encourage developers, standard-setting bodies, buyers, investors, and policymakers to consider how the Criteria can be used to inform their role in enabling the carbon market to deliver high-quality tonnes and to engage in deep diligence and ongoing monitoring over the life of a project.
This edition of the Criteria reflects what we have learned over the past year, but our work is not done. We will continue to update it so that it remains a living document that evolves with the science and the market. To do so effectively, it must be a collaborative effort; we welcome input from carbon market actors, academia, and communities.
Frequently Asked Questions
Who publishes the Criteria for High-Quality Carbon Dioxide Removal, and how often is it updated?
Relae (formerly Carbon Direct) first published the Criteria for High-Quality Carbon Dioxide Removal with Microsoft in 2021 and have updated it every year since. The 2026 edition reflects six years of lessons from real-world project diligence and advances in climate science.
What are the six principles of the Criteria for High-Quality Carbon Dioxide Removal?
The Criteria define six science-based principles that apply across all CDR pathways: social harms, benefits, and environmental justice; environmental harms and benefits; additionality and baselines; measurement, monitoring, reporting, and verification (MMRV); durability; and leakage.
What CDR pathways does the Criteria cover?
The Criteria include pathway-specific criteria across nine CDR pathways: afforestation, reforestation, and revegetation (ARR); mangrove forestation; improved forest management (IFM); soil carbon; enhanced rock weathering (ERW) in croplands; biomass carbon removal and storage (BiCRS); abiotic marine CDR; carbon mineralization; and direct air capture (DAC).
What is delivery risk in carbon removal?
Delivery risk is the likelihood that a project generates credits on the timeline and at the quantity committed to buyers. It's a distinct concern from credit quality: even a high-quality project can fail to deliver as planned because of technical, economic, commercial, organizational, or political risk, the five categories the Criteria's TECOP framework evaluates. The 2026 Criteria's new Delivery Risk Appendix gives developers, investors, and buyers a shared benchmark for identifying and managing these risks before they derail a project.
What's the relationship between carbon removal credit quality and delivery risk?
Credit quality and delivery risk are distinct but interrelated. A project that fails to deliver credits as planned reduces the availability of high-quality CDR tonnes in the market, and weaknesses in credit quality can themselves increase delivery risk by creating buyer uncertainty or limiting access to project financing. The 2026 Criteria provides a framework for evaluating both quality and delivery risk.
Carbon Removal
Relae helps carbon removal buyers, investors, suppliers, and project developers navigate a complex market shaped by evolving science, quality standards, delivery risk, and claims expectations. We combine carbon removal strategy, project-level diligence, and market intelligence informed by work with leading buyers and project developers to help you assess quality, build diversified portfolios, and scale high-integrity carbon removal.
Download the Criteria



Hannah Brigham

Hannah Brigham

Hannah has professional and academic experience doing work related to carbon accounting, climate-smart agriculture, and project management. At Relae, Hannah works across the Science Team to both manage reviews of CDR projects and develop tools and processes to further improve Relae’s assessment of high quality CDR.
Prior to joining Relae, Hannah worked as a sustainability consultant at ClimatePartner. There she supported clients from a range of sectors in calculating corporate and product carbon footprints with a focus on companies in the agriculture sector. Hannah also served as a Peace Corps Volunteer in Madagascar, working alongside local community members to implement regenerative agriculture and gardening practices.
What to Read Next
For Low-Carbon Fuels, Sustainability Is the Product—and Quality Is the Value
Key Takeaways
- Buyers have been navigating the low-carbon fuels (LCF) market without a map. The LCF market is expanding rapidly, but standards, definitions, and quality claims vary widely across regions, certification schemes, and regulatory systems, leaving voluntary buyers without a holistic framework for evaluating what they procure.
- Certifications cover some of the picture, not all of it. Existing certification schemes provide valuable assurance but vary in scope and rigor, and few, if any, were designed specifically with voluntary market buyers in mind.
- The 2026 criteria give buyers a legible quality framework. The 2026 Criteria for High-Quality Low Carbon Fuels bring together key sustainability considerations across six principles, including social and environmental integrity, carbon accounting, additionality, feedstock sourcing, and leakage, giving buyers and producers a legible, living framework to navigate procurement decisions with confidence.
Verifying Quality Is Challenging in the Current Low-Carbon Fuels Market
For airlines, logistics companies, and large corporations with hard-to-abate transportation emissions, low-carbon fuels (LCFs) have become an important part of the decarbonization toolkit. Yet it remains difficult for procurement teams to answer a fundamental question: what does high-quality procurement actually look like?
Standards, definitions, and sustainability claims vary widely across regions, certification bodies, and regulatory programs. The result is a market where quality is difficult to verify, certifications are difficult to compare, and the gap between a fuel's claims and its actual sustainability profile can be hard to close. Sustainable production will be especially critical as the market scales, because low-carbon fuel systems are deeply embedded in land, agriculture, forestry, and communities.
The 2026 Criteria for High-Quality Low Carbon Fuels are designed to close this gap, giving voluntary buyers a consistent framework to evaluate the quality of what they procure and identify where additional diligence is still needed.
What Is a Low-Carbon Fuel?
For the purposes of the criteria, a low-carbon fuel, or LCF, is defined as a fuel or energy source whose lifecycle greenhouse gas (GHG) emissions are lower than those of a relevant, use-case-specific fossil fuel alternative. In this case, we are referring to the physical biofuel and its associated environmental attributes.
While LCFs may be produced through biological, synthetic, or other non-fossil pathways, the 2026 edition focuses on biofuels for transportation, which currently represent the majority of LCF production and use.
Understanding the Complex LCF Regulatory and Certification Landscape
The LCF market sits at the intersection of multiple regulatory and voluntary markets. In the US, this includes compliance programs such as the Renewable Fuel Standard (RFS) and state-level Low Carbon Fuel Standards (LCFS). Europe, the United Kingdom, Canada, and many other nations host comparable programs, often with specialized regulatory regimes for various transport sectors, e.g., aviation or maritime.
These regulatory markets coincide with and often intersect voluntary markets, which contain a multitude of standards and certifications. For producers, this creates a complex landscape of market options. For buyers, it creates a signal problem: a fuel may carry one or more certifications, comply with one or more regulatory programs, and still leave meaningful sustainability questions unaddressed.
Several organizations, including the Roundtable on Sustainable Biomaterials (RSB) and the International Sustainability and Carbon Certification (ISCC), have developed widely used standards for LCFs. These certifications assess supply chains from feedstock to end use and provide important baseline assurance.
However, they were developed with different primary audiences in mind and can vary in scope and rigor. Few existing schemes were designed to serve as a comprehensive sustainability reference for voluntary market buyers evaluating what a given fuel's certification covers and where gaps may still exist.
Simplifying High-Quality Procurement for Voluntary Buyers
The 2026 Criteria for High-Quality Low Carbon Fuels are not designed to replace or compete with existing certification schemes. Rather, they consolidate key sustainability considerations from across the landscape of existing frameworks into a single, legible reference built specifically for voluntary market decision-makers.
The criteria apply across the full LCF supply chain, covering not only fuel producers but also fuel blenders, aggregators, and certificate traders. This LCF systems view encompasses the full set of production, certification, and procurement arrangements through which LCFs are generated and claimed. This reflects the reality that sustainability outcomes in this market are shaped by many actors, not just at the point of production.
The criteria distinguish between requirements that must be met (minimum thresholds for quality and integrity) and considerations that should be addressed, reflecting best practices and aspirational standards. This distinction is intentional: the criteria set a floor while leaving room for market participants to demonstrate quality in ways appropriate to their specific context.
The criteria are organized around six core principles that together define what high-quality LCF production and procurement looks like.
Six Principles for Procuring High-Quality Low-Carbon Fuels
- Social harms, benefits, and environmental justice: preventing new harms to communities, reducing existing ones, and ensuring equitable distribution of benefits
- Environmental harms and benefits: minimizing impacts on air, soil, water, and biodiversity
- Carbon accounting: accurately quantifying lifecycle GHG emissions using credible methodologies and tracking environmental attributes to prevent double-counting
- Additionality: demonstrating that voluntary market support enables outcomes that would not otherwise occur
- Feedstock sourcing: ensuring responsible and equitable sourcing practices and requiring end-to-end chain-of-custody documentation traceable to the point of generation
- Leakage: assessing and mitigating activity-shifting and market leakage associated with the LCF system
Where a fuel's existing certification or regulatory program adherence already addresses one or more of these core principles, that coverage should be disclosed to the buyer by the producer. Buyers can then use the criteria to identify where certification coverage aligns with quality expectations, and where supplemental diligence is needed.
A Living Framework for a Market in Motion
The LCF market will continue to evolve as policy frameworks are shifting, certification systems are maturing, and new production pathways are emerging. The 2026 edition reflects the current state of the LCF market and is intended as a living resource, with future updates possible as the market develops and new science emerges. Future editions may expand to cover synthetic LCF pathways, renewable natural gas, and sector-specific considerations such as maritime fuels.
For buyers navigating voluntary LCF procurement, the criteria offer a practical starting point: a framework to evaluate what existing certifications cover, identify where additional diligence is needed, and build procurement decisions on a consistent quality foundation. For producers, they provide clear guidance on what a sustainability demonstration looks like for voluntary market buyers.
Frequently Asked Questions
What is a low-carbon fuel?
A low-carbon fuel is a fuel whose lifecycle greenhouse gas emissions are lower than a comparable fossil fuel alternative for the same use case. The 2026 LCF Criteria focus specifically on biofuels for transportation, which currently make up most LCF production and use.
What do the 2026 Criteria for High-Quality Low Carbon Fuels cover?
The criteria are organized around six principles: social harms, benefits, and environmental justice; environmental harms and benefits; carbon accounting; additionality; feedstock sourcing; and leakage. Together they give buyers and producers a consistent way to evaluate what high-quality LCF production and procurement looks like.
Do the LCF criteria replace existing certifications like RSB or ISCC?
No. The criteria aren't designed to replace or compete with existing certification schemes such as the Roundtable on Sustainable Biomaterials (RSB) or the International Sustainability and Carbon Certification (ISCC). Instead, they consolidate key sustainability considerations from across those frameworks into a single reference so buyers can see what their certification already covers and where supplemental diligence may be needed.
Who do the LCF criteria apply to across the supply chain?
The criteria apply across the full LCF supply chain, not just producers, but also feedstock suppliers, fuel blenders, aggregators, and certificate traders, reflecting that sustainability outcomes are shaped by many actors, not only the producer.
What's the difference between the "must" and "should" requirements in the LCF criteria?
"Must" requirements set minimum thresholds for quality and integrity that need to be met, while "should" considerations reflect best practices and aspirational standards market participants can work toward. This sets a floor while leaving room for participants to demonstrate quality in ways suited to their specific context.
Shifting Playbook for Corporate Power Procurement
Key Takeaways
- The Greenhouse Gas (GHG) Protocol’s proposed scope 2 revisions would shift many large power buyers from annual renewable energy certificate (REC) accounting to 24/7 hourly matching and reveal a larger emissions gap than most inventories currently report.
- Of all the US grid regions modeled, the emissions gap between annual and 24/7 hourly matching is widest in PJM Interconnection (PJM) and the Electric Reliability Council of Texas (ERCOT), the markets where data center load is growing fastest.
- Relae's modeling quantifies the shift from annual to 24/7 hourly matching: serving a 4-gigawatt (GW) data center load at 100% hourly carbon-free energy requires 9.6 GW of additional clean capacity in ERCOT and 10.5 GW in PJM, a roughly 800-megawatt premium in PJM that translates directly into cost and siting strategy.
- Closing that gap requires investments in clean, firm generation technologies, like natural gas with carbon capture and storage (CCS), battery storage, and geothermal. The optimal mix varies by market and load profile, which means modeling current and future emissions positions under 24/7 accounting to understand the best procurement options for a specific portfolio.
Annual REC Accounting No Longer Holds at Data Center Scale
For years, large corporate energy buyers have relied on a straightforward approach: purchase renewable energy certificates (RECs) or sign virtual power purchase agreements (VPPAs) to offset market-based scope 2 emissions. Under the current GHG Protocol guidance, these instruments allow companies to claim low or zero emissions regardless of when or where clean energy is actually generated. When corporate clean energy demand was modest, this fueled new renewable project development while aggregate grid emissions were trending down.
That approach worked, until now. Energy demand from data centers and hyperscalers is surging. The Federal Energy Regulatory Commission (FERC) reported more than 50 GW of data center capacity operating in the US at the end of 2025, much of it concentrated in regions where local clean generation cannot keep pace. When corporate clean energy demand was modest, the gap between contractual claims and physical generation was small enough that few questioned this argument. At hyperscaler levels, with load concentrated in a handful of grids, that gap is becoming too large to ignore.
From a climate perspective, well-designed renewable procurement has created real impact by channeling corporate capital into new clean generation, and reducing CO2 emissions anywhere to benefit the climate everywhere. From a grid perspective, power consumption and generation must balance in real time, and the flow of electricity is constrained by the physics of the transmission system. Some regulators, investors, and standard-setters argue that corporate clean energy claims should be grounded in this second, engineering perspective rather than the first. The GHG Protocol's proposed revisions reflect that view, and would force buyers to defend their claims against it.
Relae’s modeling of this 24/7 framework in PJM and ERCOT helps quantify its costs and emissions implications in the markets where the stakes are highest.
What Does 24/7 Hourly Matching Mean for Scope 2 Accounting?
The biggest proposed change to the GHG Protocol’s current Scope 2 Guidance is the move from annual power reporting and matching to a 24/7 approach. Instead of calculating emissions with an annual emissions factor (EF) based on their independent system operator (ISO) or eGRID region for each megawatt-hour (MWh) consumed, companies would need to use hourly-specific EFs.
Companies would still be able to retire RECs to reduce their market-based emissions. However, companies would need to show that these RECs came from clean energy that was generated on the same grid, in the same hour as their facilities consumed power. This makes annual, location-agnostic REC retirement, currently the dominant practice, insufficient for 24/7 market-based accounting.
Both the time restriction (hourly matching) and the location restriction (generation on the same grid as consumption) will make it more difficult for companies to retire RECs. For example, because today's methodology is location-agnostic, a New York-based company can retire RECs from a Texas wind farm (purchased unbundled or via a VPPA) to reduce its reported market-based scope 2 value. This has allowed renewable development to follow the best resource sites rather than the load. Similarly, the time of day that the wind farm generates energy is irrelevant, as long as it is approximately in the same calendar year.
Under the proposed revisions, retiring these RECs would no longer be acceptable for the New York company, since they would fail both location- and hourly-matching requirements. As a result, companies with large REC portfolios today may no longer be able to retire them in order to reduce their market-based scope 2 emissions, if the proposed revisions take effect. These companies may face significant unmatched consumption under 24/7 accounting, especially during evening peaks or grid stress events when fossil-based generation fills the gap.
Annual Matching vs 24/7 Hourly Matching
The figure below illustrates the gap between what a representative large buyer reports under the current annual location- and market-based methodologies, versus what an hourly 24/7 analysis reveals.
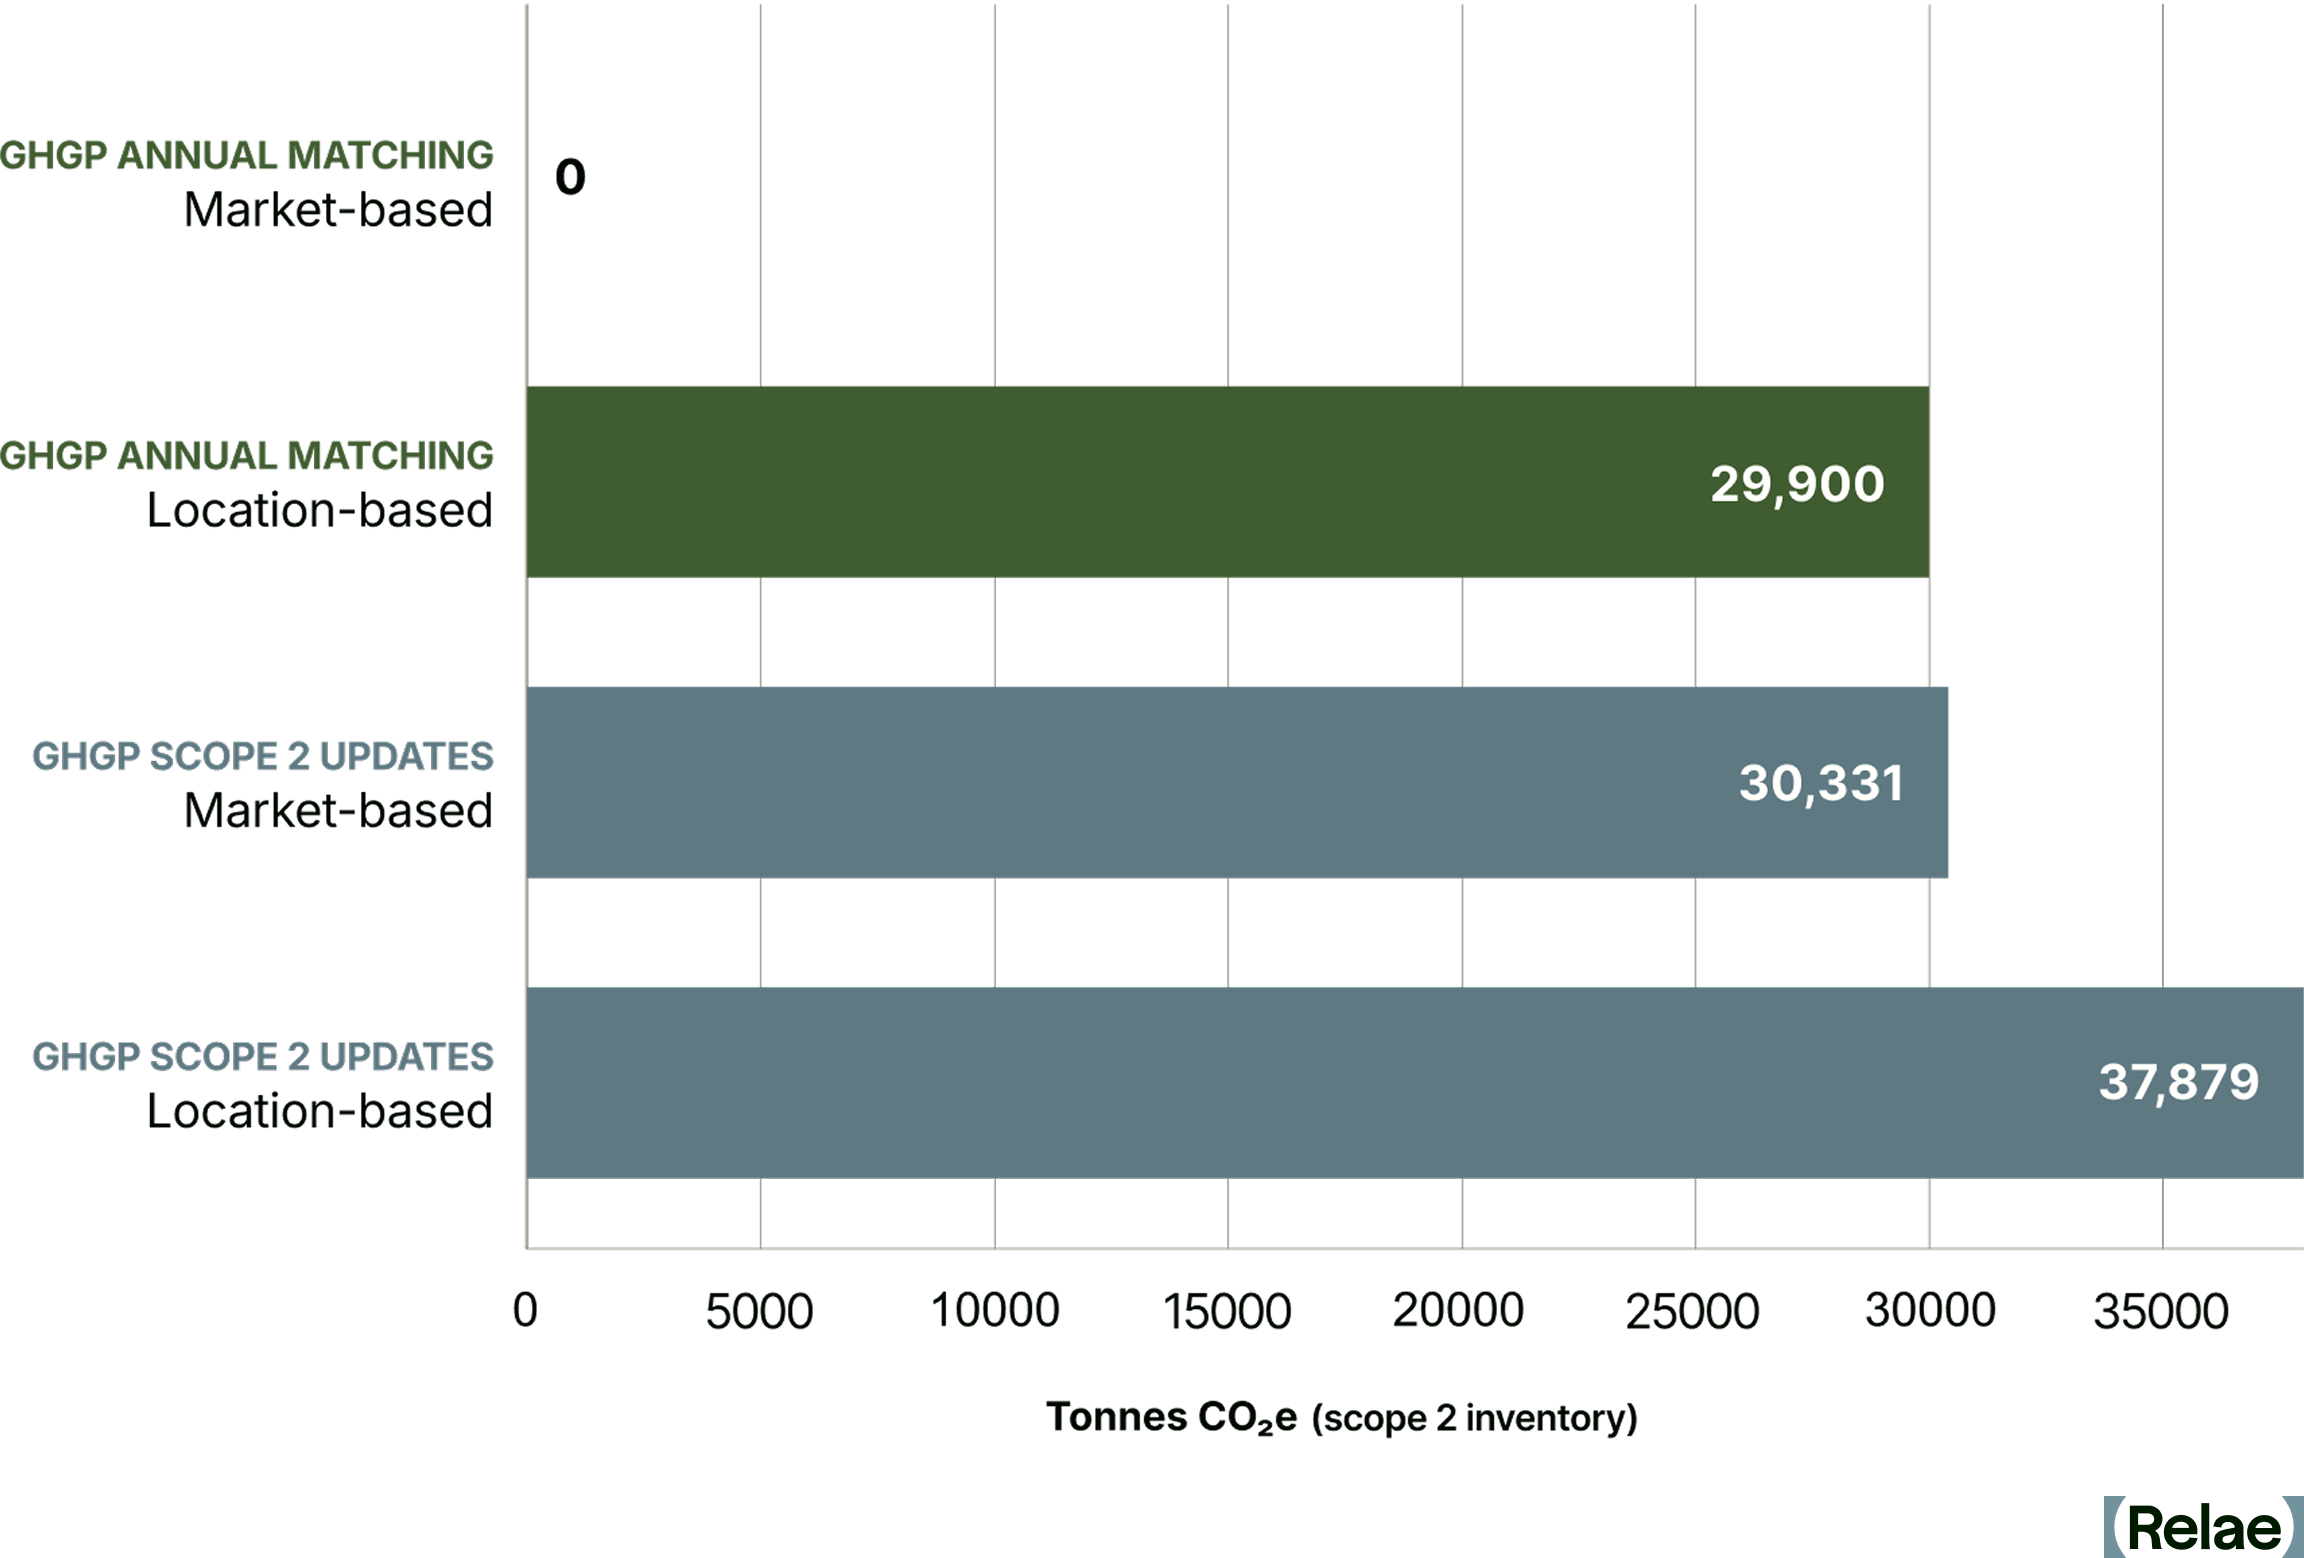
Understanding this emissions gap is the essential first step for buyers to make informed decisions about which instruments to retain, which contracts to renegotiate, and where new investment will matter most. If the proposed scope 2 revisions are enacted, companies procuring clean energy will be disincentivized from buying RECs sourced from variable renewables in distant locations, and instead will find it more favorable to invest in same-grid clean, firm generation, such as geothermal, nuclear, and renewables plus storage. RECs from these projects would qualify to be retired against market-based scope 2 emissions under the proposed revisions, where today's distant-wind or off-peak-solar RECs would not.
Where Pressure Is the Highest: ERCOT and PJM
Two markets stand out for projected hyperscaler load growth: PJM, which covers the extended mid-Atlantic region, and ERCOT in Texas. Both are on track to absorb massive increases in data center demand over the next decade, and both expose the limits of annual REC accounting in ways that will be hard to ignore under the new proposed framework.
PJM: 60% Fossil Generation Means High Marginal Emissions
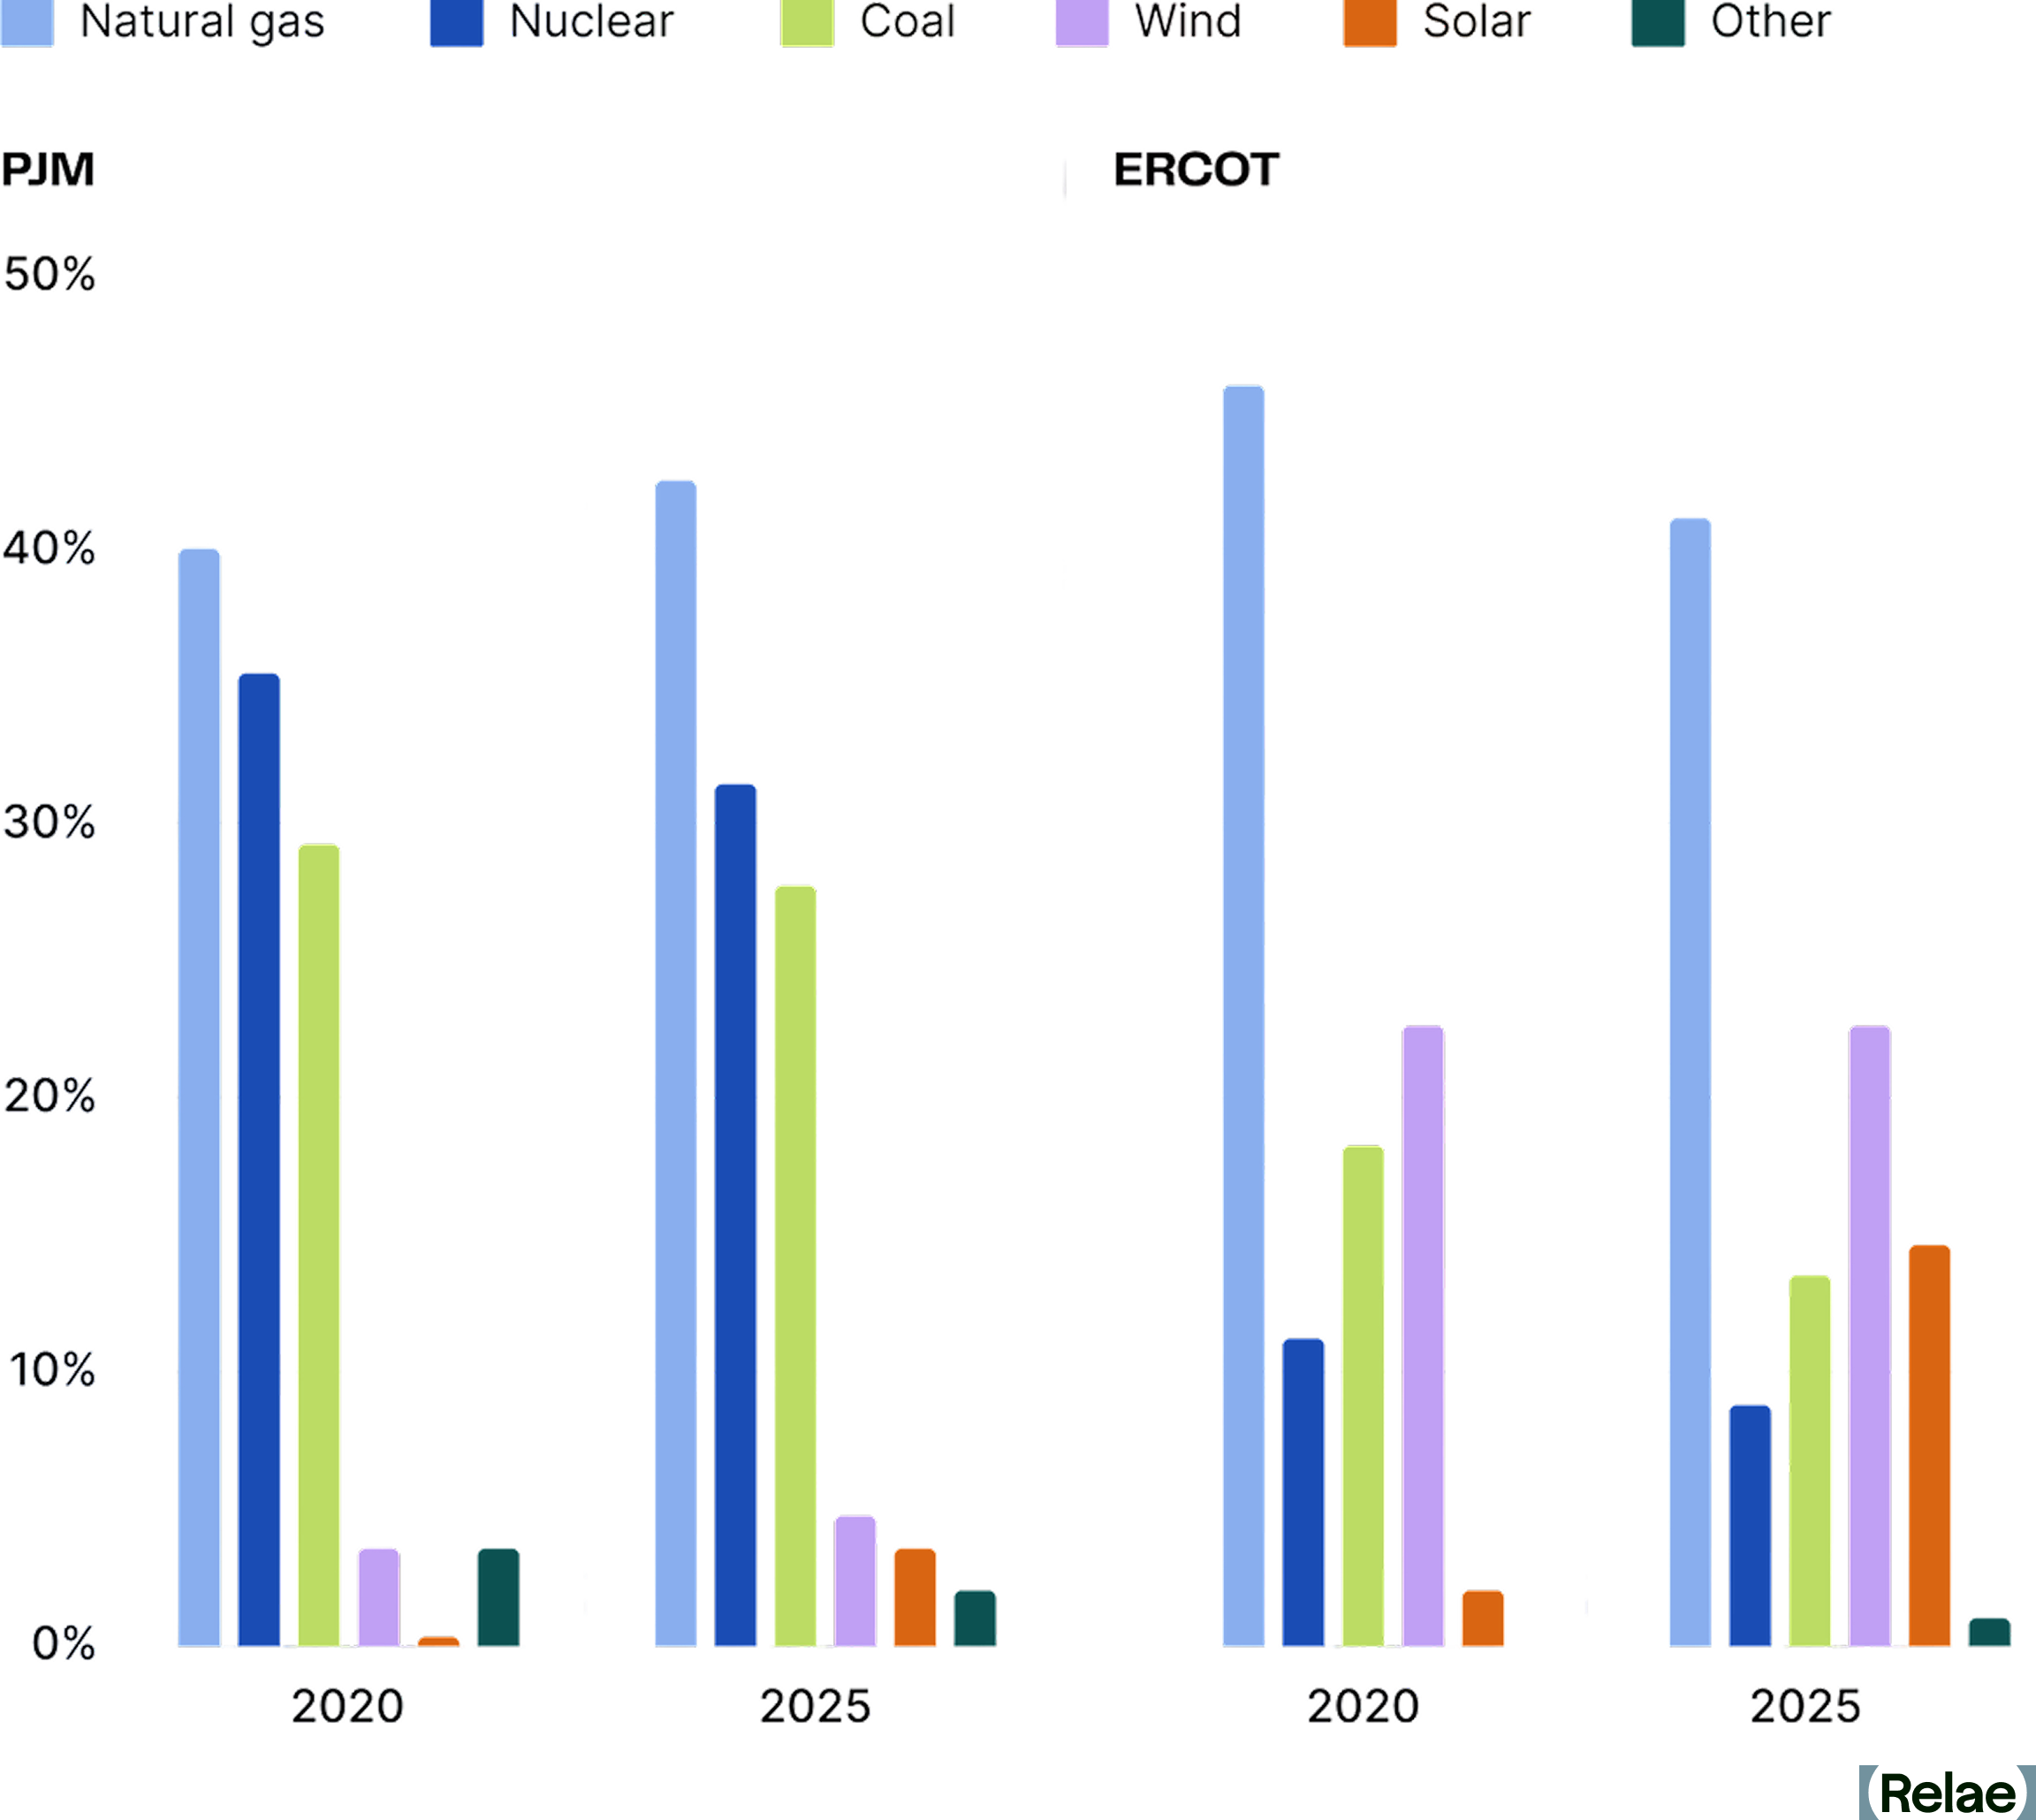
PJM is one of the largest and most complex wholesale electricity markets in the world. Its generation mix still includes 60% coal and natural gas, which means hourly emissions intensity remains high, particularly during evening peaks and grid stress events when fossil generation dominates the dispatch stack.
Buyers relying solely on annual REC retirement may show low market-based scope 2 emissions today, but a 24/7 analysis tells a different story. For PJM-based buyers, this means hourly matching gaps will be largest during evening and overnight hours, when nuclear and storage become disproportionately valuable relative to additional solar.
ERCOT: Solar and Wind Don’t Peak When Demand Does
Texas has abundant wind and solar, with solar generation growing nearly 7x since 2020, but those resources don’t always run when demand peaks. While fossil-based generation has declined since 2020, it still comprises more than half of ERCOT’s generation. Solar dominates midday, wind peaks in the evening, and natural gas fills the gaps, especially during high-demand evenings or extreme weather events.
Buyers with large ERCOT footprints may find that VPPA portfolios, which generate most of their clean energy in off-peak hours, already satisfy the proposed location-based test but fail on hourly matching. Battery storage and demand flexibility could help bridge the gap.
Figure 3 below quantifies that gap in both markets by showcasing the carbon-free energy (CFE) score in ERCOT and PJM, as well as the additional capacity required for a 4 GW load to achieve a 100% CFE target. The CFE score is the share of grid-supplied electricity in a given hour that comes from carbon-free sources, and is the metric the proposed scope 2 revisions would use to evaluate hourly matching. A 100% CFE target means electricity consumption is matched to carbon-free generation in every hour of the year.
In the left panel, a representation1 of each market's 2030 hours are sorted by grid (CFE) score, from the dirtiest hour on the left to the cleanest on the right. Neither grid approaches 100% carbon-free on its own, and the shaded areas represent the unmatched hours a buyer claiming 100% clean energy through annual instruments would actually carry under 24/7 accounting. The gap is the maximum unmatched hours a buyer might be exposed to, as some RECs procured through annual matching may qualify under the new rules, if satisfying the locational and hourly requirements.
The right panel translates that gap into action. The additional co-located clean generation and storage required to serve a representative 4 GW load (roughly 5% of the forecast 2030 C&I load in ERCOT and 4% in PJM) at a 100% hourly CFE target, on top of what the underlying grid already provides.
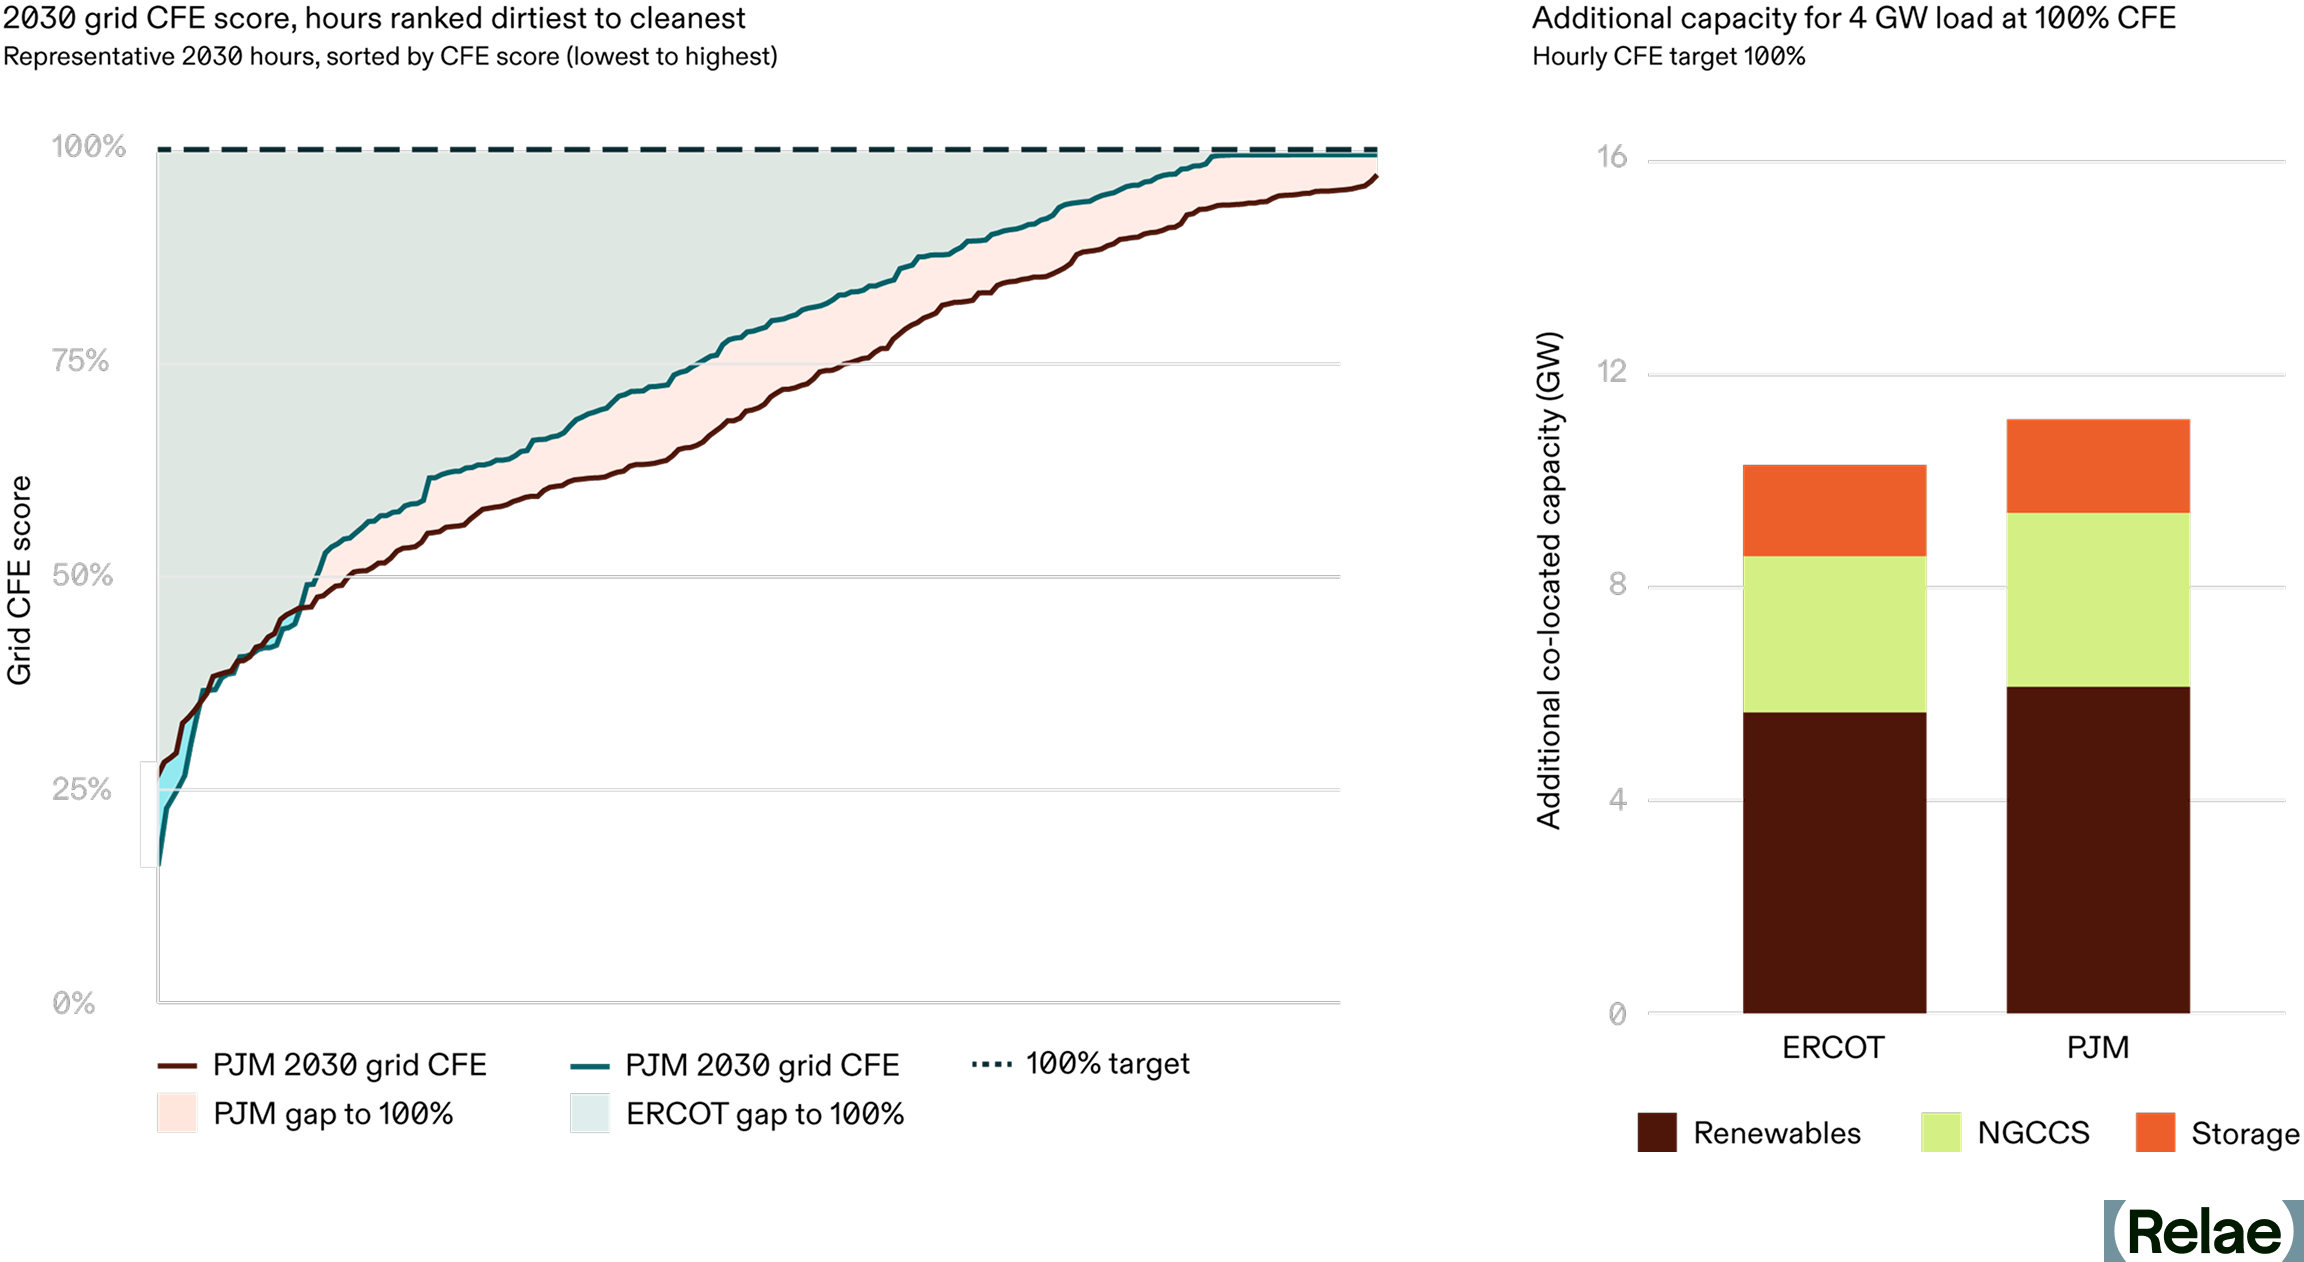
A few patterns are worth highlighting. First, the left panel confirms that PJM’s grid will still spend materially more hours below 100% carbon-free than ERCOT’s in 2030, a direct consequence of the coal- and gas-heavy generation mix described above. Notably, ERCOT's curve reaches 100% in a meaningful share of hours (windows when the grid is running entirely on carbon-free resources), while PJM's never does, meaning some fossil generation is dispatched in every hour.
Second, the ISO a buyer operates in drives a meaningful difference in build-out: hitting 100% hourly CFE for a 4 GW load takes 9.6 GW of additional capacity in ERCOT and closer to 10.5 GW in PJM. This indicates the advantage of achieving hourly and locational matching in already clean grids, which may influence a buyer choosing where to site new workloads.
Renewables have the largest share of the additional capacity in both markets (5-6 GW), paired with significant long-duration energy storage (~2 GW), while natural gas with CCS provides meaningful clean, firm capacity (~3 GW). ERCOT’s storage share of capacity is slightly larger, reflecting the midday-solar/evening-load mismatch, while PJM leans a bit more on natural gas with CCS, where clean, firm generation does more of the heavy lifting due to lower wind speeds and solar irradiance than Texas.
The right panel also illustrates why clean, firm technologies (natural gas with CCS, advanced nuclear, and enhanced geothermal) are likely to be included alongside renewables and batteries in any serious 24/7 portfolio. With only renewables and batteries, hitting the same target requires about double the total generation and storage capacity. In both markets, targets that look achievable today on an annual REC basis will require materially more capital and a different mix of resources, under 24/7 accounting.
Top Questions Large Power Buyers Need to Model Before the Rules Change
The GHG Protocol revisions are not finalized, and the timing of any mandate remains uncertain, which is exactly why modeling cannot wait.
A useful self-test for any large power buyer is: can your team answer the following today with defensible numbers?
- What is your hourly CFE score across your largest load centers, and how far does it sit from your reported market-based emissions?
- Which of your existing VPPAs and REC contracts hold value under 24/7 accounting, and which become effectively stranded?
- What mix of resources delivers the incremental clean, firm capacity that closes your gap in PJM, ERCOT, or wherever your load is concentrated at the lowest cost?
- If your next gigawatt of load were sited in a different ISO, how would your emissions position change?
Clean firm projects do not appear off the shelf. Advanced nuclear, enhanced geothermal, and natural gas with CCS all carry multi-year development timelines, and corporate offtake agreements are often what get these projects financed in the first place. Buyers who engage now help shape the project pipeline that will be available in their target markets in 2030, and can lock in offtake terms before competition for the most valuable sites tightens. Buyers who wait until the methodology is final will be working with shorter lead times, fewer development partners, and less leverage to specify projects that fit their load profiles and hourly matching needs.
Frequently Asked Questions
What is 24/7 hourly matching, and how does it differ from today's REC accounting?
Today's scope 2 accounting lets companies retire renewable energy certificates (RECs) from any grid, at any time of year, to offset their emissions. The GHG Protocol's proposed 24/7 hourly matching would require RECs to come from clean generation on the same grid, in the same hour a facility consumes power, making most of today's location-agnostic RECs ineligible for market-based accounting.
Why are PJM and ERCOT under the most pressure from this shift?
Both markets are absorbing the fastest-growing data center load in the country, and both still lean on fossil generation to meet demand outside peak renewable hours. PJM's generation mix is 60% coal and gas, while ERCOT's solar and wind often don't peak when demand does, so buyers in these markets face the largest gaps between their annual REC claims and their actual hourly carbon-free energy score.
How much additional clean capacity does it take to close the gap?
Relae's modeling finds that serving a 4 GW data center load at 100% hourly carbon-free energy requires 9.6 GW of additional clean capacity in ERCOT and 10.5 GW in PJM. That capacity mix leans on renewables and long-duration storage in both markets, with natural gas with CCS playing a larger role in PJM, where wind and solar resources are weaker.
What should power buyers do before the GHG Protocol revisions are finalized?
Start modeling now. Buyers should know their hourly carbon-free energy score, understand which existing VPPAs and REC contracts hold value under 24/7 accounting, and identify the lowest-cost mix of clean, firm resources that closes their gap. Clean firm projects like advanced nuclear, enhanced geothermal, and natural gas with CCS take years to develop, so buyers who engage early have more influence over the project pipeline and better offtake terms.
Modeling the 24/7 Emissions Gap with Relae
For large power buyers assessing what the proposed GHG Protocol revisions mean for their power procurement portfolio, Relae's Advanced Power Emissions Analysis solution models the gap between current market-based reporting and what 24/7 accounting would reveal—by market, load profile, and technology stack.
Decarbonizing Cement and Concrete: Are Their Emissions Set in Stone?
Key Takeaways
- Cement is the key ingredient in concrete and is responsible for more than 80% of concrete’s emissions. Cement’s GHG emissions are the primary technical challenge in decarbonizing an industry that accounts for over 8% of annual global greenhouse gas emissions.
- The global market for low-carbon concrete is constrained by the slow deployment of breakthrough technologies, yet demand from major buyers such as hyperscalers, developers, and infrastructure investors is accelerating. This mismatch between demand and supply is creating a new market mechanism: environmental attribute certificates (EACs) for building materials.
- EACs represent the climate benefits of low-carbon materials and can be traded separately from the physical product. These certificates, when backed by robust technical diligence, offer a near-term funding mechanism to accelerate decarbonization across the cement and concrete supply chain.
The AI Boom Meets an Industrial Reality
As the market for AI infrastructure expands, data center construction is accelerating—and with it, demand for concrete, one of the most carbon-intensive materials in the built environment. For both builders and material suppliers, the embodied carbon of cement and concrete is under a microscope due to its significant climate impact. Hyperscalers, like Microsoft and Meta, have 2030 targets that far outpace the concrete industry’s readiness to provide near-term low-emissions materials.
This piece explores why cement and concrete decarbonization is so challenging and how credible, high-quality EACs can help bridge the ambition gap.
Cement and Concrete: An Important Distinction
These two terms are often used interchangeably, but they are not the same—and the distinction matters for decarbonization strategy. Cement is the reactive ingredient in concrete, acting like an egg in a cake batter. Concrete itself is a blend of cement, aggregates (like sand and gravel), and water (the batter overall). While concrete is widely used and often seen as the emissions culprit, it is actually cement—just 15% of the mix by volume—that is responsible for more than 80% of concrete’s lifecycle carbon emissions.
Why Is Concrete so Hard to Decarbonize?
Concrete is the second most-used material on Earth after water. Despite emitting only ~0.13 kg of CO₂ per kilogram, its sheer scale gives it an outsized climate impact—contributing around 8% of global CO₂ emissions. Yet decarbonization has been slow, held back by technical, structural, and accounting challenges across a complex supply chain.
The Supply Chain Behind Concrete’s Carbon Footprint
To understand why decarbonizing concrete is so difficult, it’s essential to understand how it’s made and what drives its emissions. Three factors explain much of the difficulty:
- Cement is made in an emissions-intensive process. Cement is produced by heating limestone to extreme temperatures (~1450 °C) to create clinker, a reactive material that binds sand and aggregates into concrete. This energy and carbon-intensive process is where the majority of the emissions occur.
- Concrete is made to order. Concrete is a blend of cement, aggregate, and water. It is made to order at local batch plants and poured on-site or used in precast molds, with mix designs tailored to specific compressive strength and durability requirements.
- The supply chain is decentralized and performance-driven. Because concrete mixtures must meet application-specific performance requirements, low-carbon innovations are limited to those that do not decrease product quality and performance at any point in the value chain.
This layered supply chain, from kiln to batch plant to job site, means decarbonization strategies must be compatible with local infrastructure, material availability, and performance needs. There is no single lever to pull.
Clinker Is the Main Emissions Driver
Clinker production alone accounts for the majority of cement’s emissions, due to the chemical process (calcination) that converts limestone into lime and releases CO2. Not only does calcination directly produce CO2, but the combustion of fossil fuels used to heat the kiln adds to the emissions of the overall process.
Low-Carbon Concrete Technology: Invented, Not Yet Deployed
Six promising technologies are in development to address cement and concrete emissions, including:
- Carbon Capture and Storage (CCS): CCS can be retrofitted to capture the fuel and process emissions from clinker production, delivering nearly complete decarbonization of the cement manufacturing process. CCS can be combined with electrification or fuel switching to deliver deeper decarbonization
- Supplementary cementitous materials (SCMs): SCMs offer two key benefits: they can partially replace conventional cement in concrete mixtures, and certain SCMs react with CO₂ from industrial or atmospheric sources to enable durable carbon storage.
- Electrification: Electrifying kiln heating systems can reduce emissions from fossil fuel combustion during clinker production. When powered by low-carbon electricity, this approach lowers the carbon intensity of cement manufacturing while maintaining the high temperatures required for clinker formation.
- Fuel Switching: Natural gas, biomass, and renewable natural gas are low carbon-intensity fuels that can replace the higher-emitting coal and refuse derived fuel that usually drive the clinker production process. Unlike electrification, some alternative fuels can be used as 'drop-in' replacements in existing equipment.
- Synthetic and recycled aggregates: Alternatives to traditional gravel and crushed stone, made from waste materials or industrial byproducts, which can lower emissions and reduce resource extraction.
- CO2 curing: A process where concrete is cured with captured CO2 instead of air, helping lock carbon into the material and partially offsetting upstream process emissions.
Each solution faces deployment challenges, from raw material availability and geographic constraints to cost, performance certification, and integration with legacy infrastructure.
Few decarbonization strategies have reached industrial scale today, but these strategies are being piloted and demonstrated, and given targeted support, some have the potential to significantly decarbonize the future of the industry.
The Gap Between Targets and Real Market Capacity
Hyperscalers, utilities, real estate developers, and other large organizations with ambitious scope 3 targets are looking to significantly reduce the embodied carbon throughout their supply chain. However, the current supply of deeply decarbonized cement and concrete is insufficient to support these targets through direct procurement alone; the low-carbon material simply does not exist at the required volume or in the right geographies. In some cases, pilot plants produce too little material to meet large-scale demand, while projects capable of larger volumes may not yet be located in regions where interested buyers are concentrated.
In this context, EACs offer a flexible mechanism to fund innovation and bridge the gap. By unbundling climate attributes from physical materials, near-term obstacles, such as geographic availability, can be overcome while channeling capital toward scalable and catalytic solutions.
When backed by rigorous life cycle assessments and high-quality, transparent traceability standards, EACs can provide the financial bridge for truly innovative suppliers to invest in the capital solutions required to decarbonize cement and concrete. EACs can serve a catalytic role to support scalable strategies and help ensure that first-of-a-kind facilities are built, and direct procurement of low-carbon concrete is increasingly feasible in the years to come.
How Environmental Attribute Certificates Work in Cement and Concrete Markets
EACs translate emissions reductions from low-carbon cement and concrete production into climate attributes that can be purchased separately from the physical material. Instead of requiring buyers to procure low-carbon concrete directly from a specific supplier site, EACs allow the climate benefit associated with that production to be transacted independently through a book and claim model.
In practice, a producer implements a verified emissions reduction intervention, such as reducing clinker content through supplementary cementitious materials, installing carbon capture at a kiln, or deploying alternative cement chemistries. The resulting emissions reductions are quantified through life cycle assessment and product-level disclosures such as Environmental Product Declarations. Verified reductions can then be converted into certificates representing the climate benefit of that lower-emissions production.
Buyers can purchase these certificates to support the deployment of low-carbon cement and concrete technologies while making progress toward embodied carbon reduction targets. In this way, EACs provide an early demand signal and a revenue stream that can help producers finance capital-intensive decarbonization investments across the cement and concrete supply chain.
What This Means for Suppliers and Buyers
Whether you are procuring concrete or producing it, EACs are only one part of a broader decarbonization strategy. Navigating this space requires decisions at the intersection of technical feasibility, GHG accounting, and capital strategy. Key considerations include:
- GHG accounting and reportability: Life cycle assessments, Environmental Product Declarations, and other product-level attributes must be tracked and transacted with high integrity. Buyers should report their EAC activities responsibly, especially in the current absence of formal standards and guidance.
- Procurement alignment: EAC buyers must ensure purchased certificates reflect equivalent performance grade materials to what was directly procured for structural applications.
- Monetization pathways: Book-and-claim EAC models offer producers a way to fund capital-intensive decarbonization upgrades while giving buyers a credible way to meet interim scope 3 goals. EAC transactions can take many forms and should be designed thoughtfully to minimize risks such as double counting.
Frequently Asked Questions
What is low-carbon cement, and how does it work?
Low-carbon cement reduces emissions by replacing traditional clinker with supplementary cementitious materials (SCMs), switching to cleaner fuels, electrifying kilns, or capturing CO₂ at the point of production. Because cement is responsible for more than 80% of concrete's lifecycle emissions, interventions targeting clinker production deliver the greatest climate impact. Most approaches are technically proven at smaller scales but have not yet reached the industrial volumes needed to meet mainstream demand.
How do EACs for cement and concrete compare to direct procurement of low-carbon materials?
Direct procurement means physically buying low-carbon concrete from a supplier, which requires that product to exist at conditions that often can not be met today. EACs decouple the climate benefit from the physical material, allowing buyers to fund verified emissions reductions across the supply chain even when direct sourcing isn't feasible. Both approaches can count toward scope 3 targets, but EACs offer more flexibility in the near term while the low-carbon materials market matures.
Is low-carbon concrete proven and available at scale today?
The core technologies for decarbonizing cement and concrete are technically demonstrated, but most have not reached commercial scale. Supply is geographically concentrated and insufficient to meet the volume demands of large buyers like hyperscalers, utilities, and real estate developers. This gap between technical readiness and market availability is precisely what makes EACs a valuable bridging mechanism right now.
What should a company look for when evaluating EACs for cement and concrete?
High-quality EACs should be backed by rigorous life cycle assessments and transparent traceability standards that tie the certificate to a specific, verifiable emissions reduction intervention. Buyers should also confirm that the certificates represent materials with equivalent performance grades to what they are directly procuring for structural applications, and that accounting practices minimize risks like double counting. Working with a technically credible advisor to evaluate EAC quality is essential, since the market currently lacks formal standards and guidance.
How Relae Can Help Decarbonize Cement and Concrete
Decarbonizing cement and concrete is both a technical and a strategic challenge. Relae brings integrated expertise across geochemistry, life cycle assessment, carbon accounting, and industrial decarbonization strategy to help buyers and producers navigate the complex path to decarbonization. Relae works directly with producers developing low-carbon cement and concrete technologies and with global buyers seeking credible pathways to address embodied emissions in construction. Our team combines industrial decarbonization engineering, geochemical expertise, and carbon accounting to evaluate emerging EAC frameworks and ensure they deliver real climate impact.
- EAC advisory for buyers: Relae helps buyers procure high-quality EACs through criteria development and in-depth technical diligence of EAC offerings across a range of low-carbon commodities, supporting purchased certificates that reflect genuine, verifiable climate impact.
- EAC advisory for suppliers: Relae helps producers design high-quality EAC interventions and assess potential EAC claims throughout the supply chain, informed by technical assessment, book-and-claim systems, and market landscaping.
- For both: Relae’s levelized cost of carbon abatement tooling provides custom modeling to assess trade-offs across cement and concrete decarbonization pathways, helping ensure that every dollar of climate spend goes further.
Steel Decarbonization: How EACs Scale Low-Carbon Production by 2030
Key Takeaways
- Decarbonizing steel is key to meeting ambitious climate targets in the face of rapidly expanding AI infrastructure as well as broader infrastructure growth.
- The gap between corporate climate ambitions and near-term commercial reality is widening. Despite strong demand signals from hyperscalers and other major buyers, leading producers have recently canceled or delayed flagship green steel projects, citing high energy costs, slow hydrogen market development, and unfavorable policy environments.
- Bridging this gap requires significant capital investment and supporting mechanisms to scale low-carbon technologies. Environmental attribute certificates offer an effective mechanism to channel capital toward transformative, low-carbon steel projects, supporting technology scale-up, as well as providing a way for buyers to meet their emissions reduction targets.
- To protect the credibility of environmental attribute certificates as a market mechanism for decarbonization, projects should seek to meet rigorous quality criteria such as additionality, verifiability, and catalytic impact.
Forging New Climate Ambitions for Steel Production
Decarbonizing steel production is essential to meet global climate targets. Steel production accounts for approximately 7–9% of global CO2 emissions. This is driven chiefly by coal-based primary steelmaking, which still accounts for the majority of global production. Globally, at least 1.8 billion tonnes of crude steel were produced in 2025 to serve a broad array of industries including real estate, infrastructure, automotive, and data center construction.
As hyperscalers race to build the infrastructure underpinning the AI revolution, steel demand for data center construction, and associated energy infrastructure, is increasing. While the relative share of data center demand for steel versus global steel demand is small, the need for approximately 20,000 tonnes of steel per data center has a material impact on hyperscaler’s public climate commitments. Microsoft, Meta, and other large technology companies have set ambitious 2030 climate targets that include their scope 3 emissions. The embodied carbon of the steel used to build their data centers sits squarely in scope 3.
Hyperscaler’s climate commitments have generated sector-specific demand for decarbonized steel, presenting an opportunity to affect steel decarbonization more broadly. Despite this demand, the supply of low-carbon steel remains limited. The industry faces significant scale-up challenges due to the diffuse nature of demand and the nascent market. Catalyzing growth in decarbonized steel production will require market innovations and new production pathways designed to overcome these challenges. Credible environmental attribute certificates can help bridge the gap between today’s market and tomorrow’s low-carbon steel sector.
What is an Environmental Attribute Certificate?
An environmental attribute certificate (EAC) represents the environmental attributes of a product that can be unbundled and transacted separately from the underlying physical commodity. The most widely used EACs today are renewable energy certificates (RECs), which track the environmental attributes of renewable electricity. The same concept can also be applied to steel and iron, as well as to materials such as cement and concrete.
In a book and claim model, a steel producer can implement a verified emissions reduction intervention, quantify the resulting lowered carbon intensity per tonne of steel produced, and convert that into tradeable certificates. Buyers can then purchase those certificates to support the deployment of low-carbon steelmaking capacity in cases where direct procurement of low-carbon steel is currently impractical due to geographic, contracting, or scheduling incompatibilities.
EACs are distinct from carbon credits. They do not represent emissions reduced or avoided relative to a counterfactual; they represent the intrinsic carbon intensity of the material produced, measured through a life cycle assessment.
Decarbonizing Steel Requires Significant Capital and Infrastructure Deployment
Steel Production Today
Steel is currently made via three main production routes. About 71% of the world’s steel is produced through the blast furnace–basic oxygen furnace (BF-BOF) route, which emits an average of 2.33 tonnes of carbon dioxide (tCO2) per tonne of crude steel. A further 24% is produced using scrap-based electric arc furnaces (EAFs), which emit 0.68 tCO2 per tonne on average—far lower, but still dependent on the carbon intensity of grid electricity. The remaining roughly 5% uses direct reduced iron combined with an EAF (DRI-EAF), typically using natural gas, emitting 1.37 tCO₂ per tonne on average.
While increasing scrap-based production is a critical decarbonization lever, scrap availability is limited. Primary steel production, which uses iron ore as the main feedstock rather than recycled scrap, will remain necessary at large volumes through 2050. This makes it essential to decarbonize ore-based pathways, especially ironmaking: the step where iron ore is reduced to iron and where most emissions occur.
Decarbonizing ore-based steel production requires one of three fundamental interventions: (1) replacing coal and natural gas with low-carbon fuels such as hydrogen or bio-coke, (2) electrifying ironmaking directly, or (3) capturing and storing the CO2 generated from fossil-fuel-based processes. All three involve significant capital expenditure and dependencies on infrastructure that is not yet in place at the necessary scale. As a result, the energy and cost challenge is substantial.
Low-Carbon Steel: Emerging Pathways
A range of transformative technological pathways are currently in development to overcome these barriers, offering the potential to deliver deep decarbonization to the steel industry exceeding 90% by 2050:
- Hydrogen-based DRI-EAF: Using green hydrogen instead of natural gas within the DRI process provides a pathway to significantly lower the carbon intensity of ironmaking. Producers such as Stegra are deploying commercial-scale facilities designed to utilize 100% green hydrogen to reduce iron ore.
- Electrifying ironmaking:
- Molten oxide electrolysis: Boston Metal is commercializing a process that uses electricity to directly convert iron ore to molten metal through electrolysis at high temperature, eliminating the need for hydrogen or carbon reductants entirely.
- Low-temperature electrowinning: Colorado-based startup Electra uses renewable electricity to extract iron from ore via an aqueous electrochemical process that operates at near-ambient temperature.
- Carbon capture and storage (CCS): For blast furnaces and DRI plants with long remaining lifetimes, retrofitting with CCS technology can significantly reduce emissions. With new high-emitting capacity still being built, and assets expected to operate for decades, integrating CCS will be essential to avoid long-term carbon lock-in and to decarbonize these facilities over time. To date, commercial-scale deployment remains limited. The Al Reyadah facility at Emirates Steel is the only project currently capturing CO2 from a DRI process at scale, though a handful of other large-scale projects have entered the development pipeline.
Progress and Setbacks: A Mixed Picture
The past year sent contradictory signals about the pace of steel decarbonization. On the demand side, technology companies with ambitious climate targets are actively signaling their intent to procure near-zero steel and support its development.
In September 2025, Microsoft and Stegra announced a landmark agreement that combines a physical supply deal for low-carbon steel with a separate EAC purchase agreement. Around the same time, Meta announced an agreement with Electra to purchase EACs tied to the startup’s clean iron production, becoming one of the first buyers to use the EAC model for an entirely novel, pre-commercial ironmaking technology. Nucor, the largest US steelmaker, also entered into a physical iron purchase agreement with Electra.
Despite these demand signals, the industry has experienced significant setbacks. A series of low-carbon steel project cancellations and delays has raised questions about the pace and viability of the steel transition, especially due to the high costs associated with green hydrogen production.
At present, the green premium for most low-carbon steel remains too high for buyers. A combination of sustained policy support, long-term demand signals from buyers willing to pay more, and scaling of supporting industries, such as green hydrogen production, is necessary for the low-carbon steel industry to be successful in the long run.
How EACs Can Bridge the Funding Gap in Steel
EACs unbundle low-carbon steel attributes from the physical material, reducing the friction between buyers who are willing to pay a green premium and geographic or logistical constraints that may inhibit physical offtake. Buyers, such as hyperscalers procuring conventional steel for data center construction in locations where low-carbon steel is not yet available, can purchase these certificates to support the development of low-carbon capacity, attribute lower-carbon production to their steel use via a market-based mechanism, and advance toward their scope 3 targets.
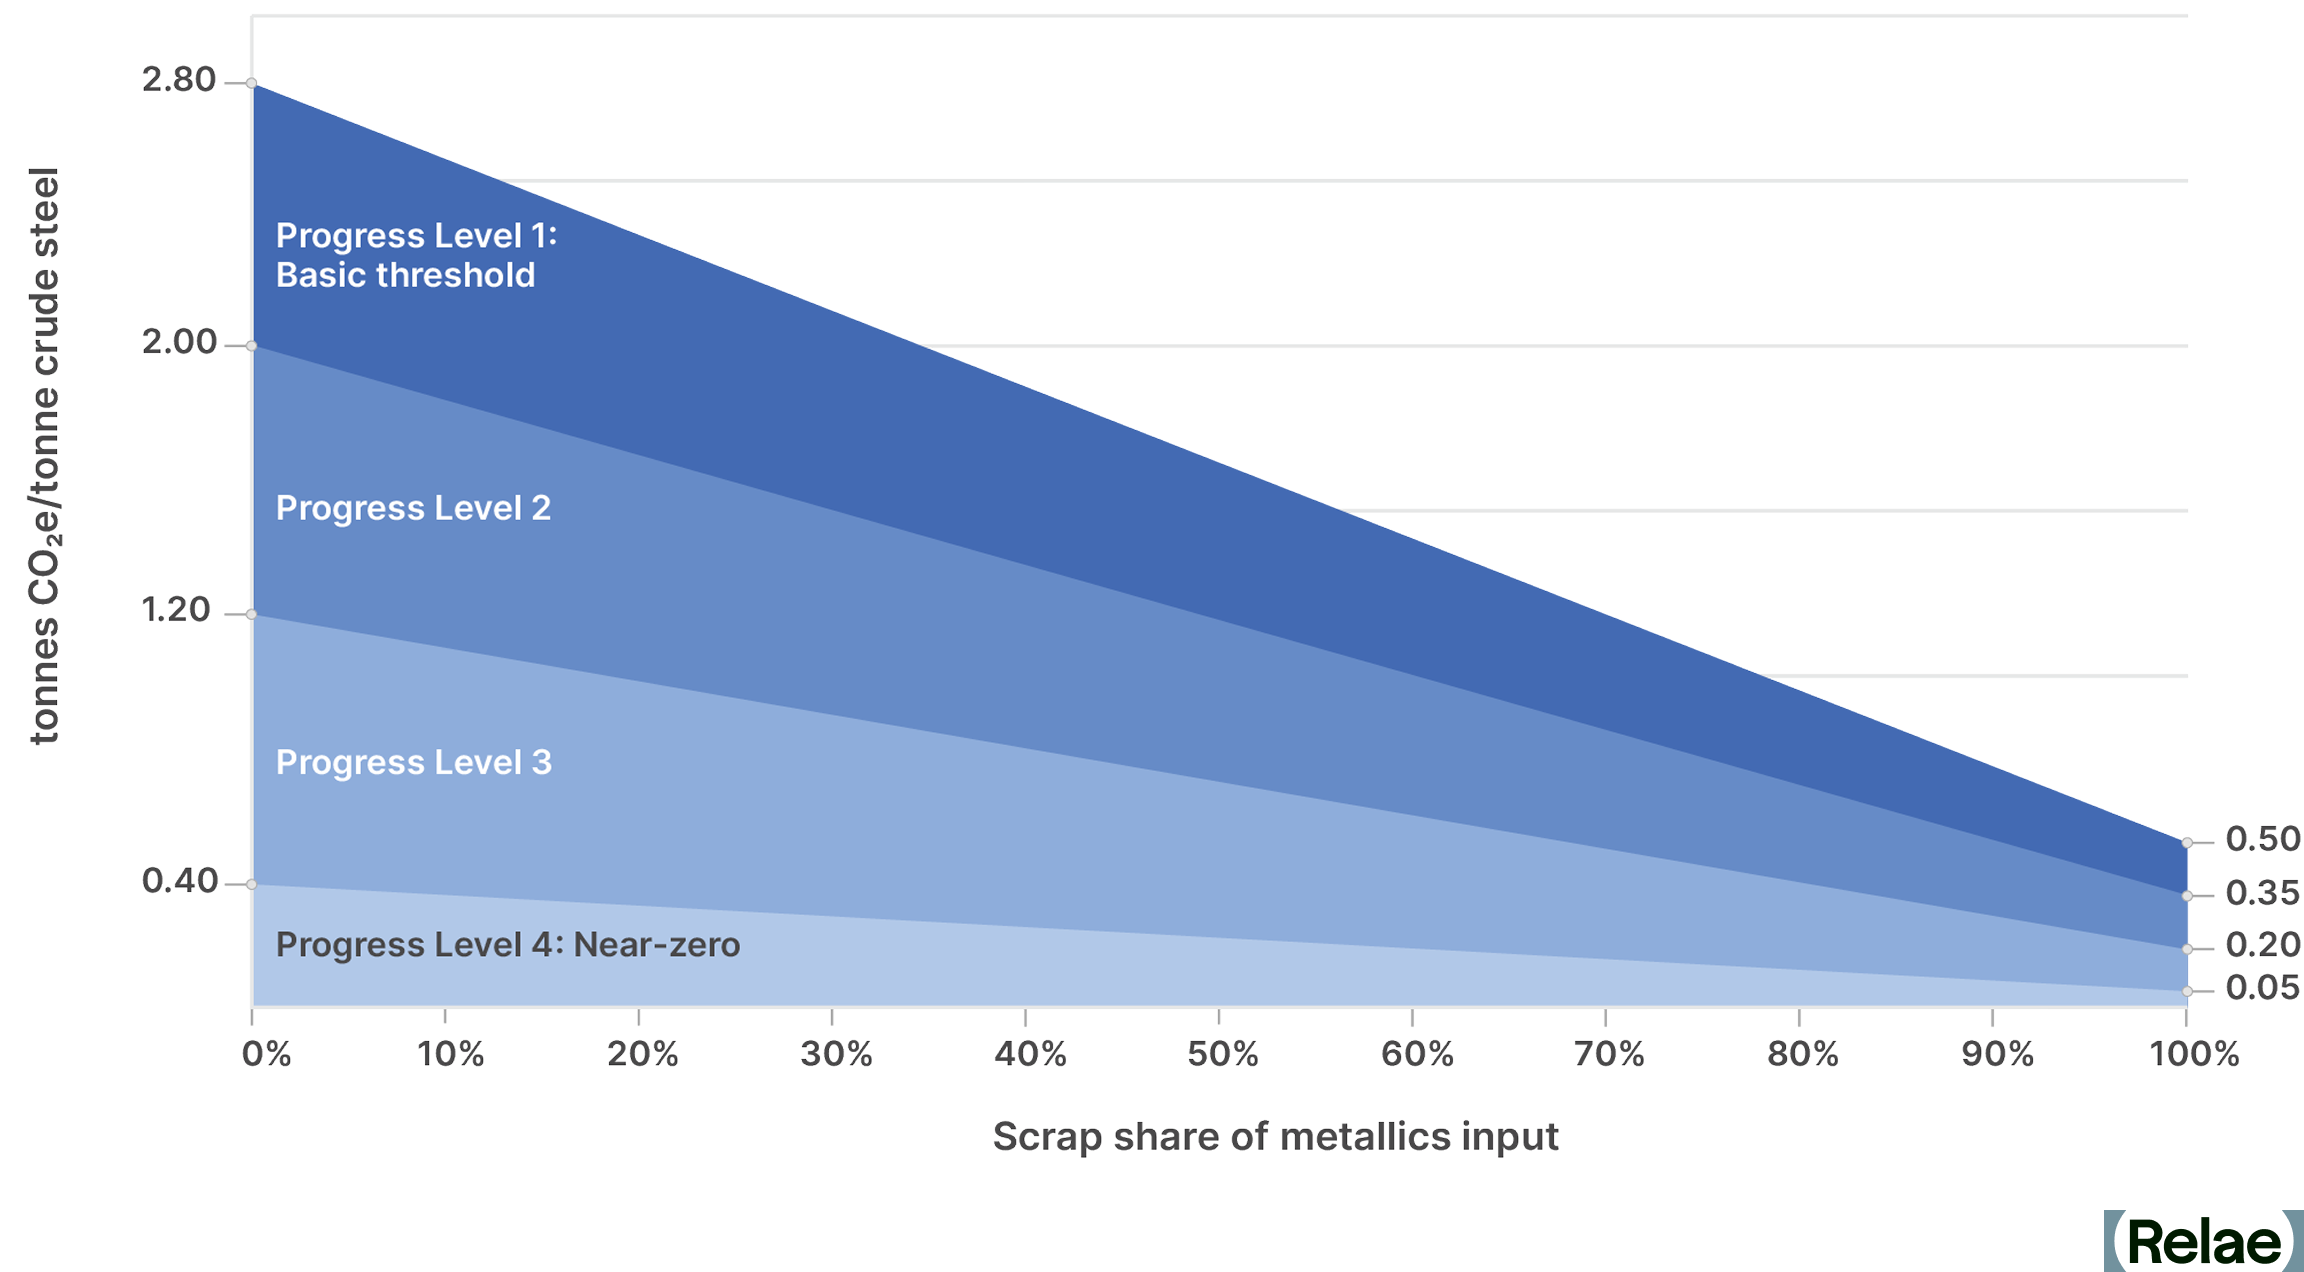
A primary objective of the Criteria for High-Quality Environmental Attribute Certificates in the Concrete and Steel Sectors, jointly developed by Relae (formerly Carbon Direct) and Microsoft, is to establish high-integrity standards for the EAC market in these sectors. For steel EACs, that means demonstrating significant emissions reduction performance by reaching at least Progress Level 2 in the ResponsibleSteel Decarbonization Progress Levels framework, and aiming to achieve Progress Level 3 by 2030. ResponsibleSteel’s scrap-variable benchmark provides a technology-neutral mechanism to evaluate emissions reduction performance by accounting for the specific proportion of scrap used.
EACs for steel are designed to be catalytic. Rather than supporting incremental improvements that are already becoming cost-competitive, they should target transformative capital changes, such as replacing BF-BOF routes with DRI-EAF, adopting low-carbon hydrogen in DRI processes, or deploying novel ironmaking technologies. Multi-year purchase agreements are particularly powerful because they provide the investment certainty that first-of-a-kind projects need to access capital at a lower cost.
What this Means for Buyers and Suppliers of Low-Carbon Steel
Whether you are producing or procuring steel, EACs are only one part of a broader decarbonization strategy. For buyers with significant emissions from steel, and other building materials such as cement and concrete, EACs can be a powerful tool to help advance scope 3 reduction goals where supply for physical low-carbon materials is limited. Suppliers can complement commercialization strategies for low-carbon materials by using EACs to monetize emissions reductions, generate additional revenue to support decarbonization investments, and help scale markets for low-carbon materials. Navigating the steel market requires decisions at the intersection of technical feasibility, greenhouse gas accounting, and capital strategy. Key considerations include:
- Greenhouse gas accounting and reportability: Cradle-to-gate emissions for steel production must be tracked using life cycle assessments and should strive for interoperability with environmental product declarations (EPDs). EAC transactions must be reported transparently, especially given the absence of formal market standards at this stage.
- Additionality and catalytic impact: EAC purchases must demonstrably support projects that would not proceed without financial support from the EAC market mechanism, and projects should have a credible pathway toward the near-zero (Progress Level 4) threshold on the ResponsibleSteel framework.
- Avoiding double counting: EAC buyers must verify that the environmental attributes they purchase are not also being claimed by the physical product buyer via an EPD.
FAQs
What is an environmental attribute certificate (EAC) for steel?
An EAC represents the environmental attributes of low-carbon steel, unbundled from the physical material itself, so a producer can quantify a verified reduction in carbon intensity per tonne and sell that value as a separate, tradeable certificate. Buyers can purchase EACs to support low-carbon steel production while still working toward their own emissions targets.
How is an EAC different from a carbon credit?
An EAC reflects the intrinsic carbon intensity of the material itself, measured through a life cycle assessment. That's different from a carbon credit, which represents carbon dioxide actively avoided, reduced or removed from the atmosphere relative to a baseline.
How are AI data centers impacting the demand for low-carbon steel?
Data centers use roughly 20,000 tonnes of steel each, and as hyperscalers build out AI infrastructure, that steel use counts toward their scope 3 emissions and public climate targets. That's turned data center construction into a meaningful driver of demand for low-carbon steel, even though supply remains limited.
What makes an EAC credible enough to count toward a company's emissions goals?
A credible steel EAC needs to meet criteria like additionality (the project wouldn't happen without the EAC revenue), verifiability through life cycle assessment, and catalytic impact toward transformative technology rather than incremental gains. Relae (formerly Carbon Direct) and Microsoft jointly developed criteria for high-quality EACs in the steel and concrete sectors, which set a threshold of at least Progress Level 2 on the ResponsibleSteel Decarbonization framework today, rising to Progress Level 3 by 2030.
Can a producer sell an EAC and also get credit for the physical steel elsewhere?
No. EAC producers need to confirm the environmental attributes they're selling aren't also being claimed by whoever buys the physical steel through an environmental product declaration; otherwise the same emissions reduction gets counted twice.
How SAF Mandates in the EU and UK Are Reshaping Aviation Fuel Markets
Key Takeaways
- SAF and e-SAF mandates are reshaping the aviation fuel market. The EU and UK impose steep non-compliance penalties, turning regulatory requirements into a strategic lever for those who act early.
- Non-compliance is costly. Penalties run roughly 3 times the cost of compliance in the EU and from about 2 to 13 times in the UK, making long-term planning essential to mitigate risk.
- e-SAF producers have a unique opportunity. Mandates and penalties are shifting the economics of aviation fuel, making e-SAF more attractive despite historically high production costs.
How SAF Compliance Stacks Up
Airlines and fuel suppliers operating in Europe and the UK face growing economic uncertainty due to stringent mandates requiring the adoption of sustainable aviation fuels (SAF) with carve-outs for SAF produced from renewable hydrogen, also known as Power-to-Liquids (PtL) or e-SAF.1 These mandates, aimed at reducing aviation emissions, carry steep penalties (up to 13 times the cost of compliance) for fuel suppliers who fail to meet required quotas. While this creates cost uncertainty for airlines and passengers, it opens a strategic opportunity for e-SAF producers. These producers are challenged by high production costs relative to other SAF on the market and a limited set of buyers that can afford the premium on a voluntary basis.
This piece explores the cost implications for aviation being shaped by these EU and UK SAF mandates and outlines how airlines and suppliers can respond strategically to minimize risk and maximize opportunities. By understanding these dynamics, industry stakeholders can turn regulatory compliance into a source of competitive advantage.
Understanding SAF Mandates in the EU and UK
The EU Commission’s ReFuelEU Aviation regulation, part of the European Green Deal, sets binding targets for aviation sustainability. Beginning in 2025, ReFuelEU mandated that aviation fuel suppliers offer a minimum percentage of SAF and e-SAF at EU airports. By 2030, suppliers must blend at least 6% SAF, including 1.2% e-SAF. To discourage tankering practices (carrying excess fuel for return trips, increasing emissions), ReFuelEU Aviation requires airline operators to refuel at least 90% of their annual aviation fuel needs at a given EU airport before departure.
In parallel, the UK Department for Transport (DfT) mandates a higher SAF blend of 10% by 2030 and places greater emphasis on reducing reliance on hydrogenated esters and fatty acids (HEFA) SAF fuels, which face eventual limitations on feedstock supply. HEFA’s allowable share will decline annually from 100% in 2025 to 42% in 2040. The UK also includes a sub-mandate specifically for PtL SAF.
The Real Cost of Falling Behind on SAF Mandates
The financial impact of these mandates is significant. Each year, the European Union Aviation Safety Agency (EASA) publishes regulatory reference prices for SAF, e-SAF, and conventional jet fuel (CJF) that anchor non-compliance penalties in the EU, most recently the 2025 Aviation Fuels Reference Prices for ReFuelEU Aviation. Using these reference prices for current-year costs and projected production costs or prices for SAF, e-SAF, and CJF from 2030–2050, the following analysis compares EU and UK compliance versus non-compliance penalties, converting all figures to US$/gallon.2
The price gap between SAF and fossil jet fuels remains wide. In 2025, SAF is approximately three times the price of CJF, while e-SAF is nearly twelve times more expensive. Projections indicate this price gap narrows by 2030, but far more for SAF than for e-SAF. The projected price of SAF in 2030 is US$5.46/gallon, more than double the estimated US$2.41/gallon for CJF. The price difference is even greater for e-SAF: with no traded e-SAF market yet, projected 2030 prices span US$5.70/gallon to US$33.00/gallon, with a central estimate around US$18/gallon, or roughly seven times the price of CJF.
Estimated Jet Fuel Prices 2025-2050 (US$/Gallon)
Source: European Union Aviation Safety Agency. 2025 Aviation Fuels Reference Prices for ReFuelEU Aviation. (link); UK Department for Transport. SAF Mandate: Final-stage Cost Benefit Analysis. (link); EUROCONTROL. Aviation Outlook 2050: Main Report. (link)
The mandates carry strict penalties for non-compliance. Penalties for non-compliance in the EU are set at a minimum of two times the price difference between SAF and CJF per gallon of unmet obligation. Additionally, fuel suppliers must supply any unmet fuel obligations in subsequent reporting periods, which pushes the cost of non-compliance in the EU to three times the cost of compliance.
In the UK, penalties work differently: fuel suppliers must pay a fixed buy-out price per megajoule (MJ) of unmet obligation, which translates to US$24.64/gallon of unmet SAF obligation and US$26.08/gallon of unmet e-SAF obligation.3 Because the buy-out is fixed while compliance costs vary, UK penalties range from about 2 times the cost of compliance for e-SAF to 13 times for SAF in later years. The intent is clear: regulators are serious about pushing aviation towards sustainable fuels.
Cost-Comparison of Compliance vs Non-Compliance (US$/Gallon)
Note: The cost of compliance under both mandates is calculated as the price premium of SAF/e-SAF over CJF per ton, using region-specific SAF prices: the EU SAF price reflects HEFA-based supply (ReFuelEU imposes no HEFA cap), while the UK SAF price is a weighted average of HEFA and higher-cost advanced pathways based on the UK's declining HEFA cap. The e-SAF (PtL) price is the same in both regions.
Cost-Comparison of Complicance vs Non-Compliance (US$/Gallon)
e-SAF Has a Policy-Driven Market Opportunity
These price differentials present risk and opportunity. Airlines and fuel suppliers that fall short of compliance will face steep penalties. Those who comply strategically, can mitigate those risks and benefit from financial incentives that help offset higher fuel costs.
Incentive structures support SAF and e-SAF production. For example, the EU’s Emissions Trading System (ETS) has allocated allowances to offset SAF costs, especially for renewable fuels of non-biological origin (or e-SAF). Similarly, the UK offers tradable certificates and has now legislated a Revenue Certainty Mechanism (Sustainable Aviation Fuel Act 2026) that will guarantee SAF producers a set strike price through contracts-for-difference-style agreements, funded by a levy on fuel suppliers, with the first allocation round expected in 2027. The UK’s ETS also provides an indirect incentive as SAF use by airlines lowers compliance costs through reducing required allowances.
Strategic Recommendations for Airlines and Suppliers
To navigate this shifting landscape, airlines and fuel suppliers must think strategically about procurement and compliance, potentially including:
- Proactive procurement: Airlines and fuel suppliers should prioritize securing long-term contracts with SAF and e-SAF producers. Early engagement can help ensure access to limited supply and stable pricing.
- Leverage incentive programs: Actively participate in available incentive schemes, such as the EU ETS and UK tradable certificates, to minimize compliance costs.
- Invest in e-SAF production: Consider strategic investments or partnerships in e-SAF production to align sustainability goals with regulatory requirements and financial incentives.
- Plan for volatility: Develop robust risk mitigation plans, using flexible procurement strategies and financial instruments to buffer against supply chain disruptions and price swings.
Turning Mandates into Market Momentum
As 2030 approaches, the pressure on airlines and fuel suppliers to comply with SAF mandates will intensify. Those who proactively respond to and embrace the mandates can transform regulatory requirements into strategic opportunities. Rather than viewing mandates as burdens, forward-looking stakeholders can use them to drive sustainable innovation and long-term resilience.
The EU and UK mandates for SAF and e-SAF represent an emerging shift in aviation fuel markets. Stakeholders that act now, by engaging with incentives and investing in sustainable fuel solutions, will emerge as industry leaders. Now is the time for airlines, fuel suppliers, and e-SAF producers to act decisively, transforming regulatory compliance from a costly obligation into a clear competitive advantage.
Frequently Asked Questions
What happens if an airline or fuel supplier misses its SAF mandate quota?
Fuel suppliers—the obligated parties—pay a penalty on every unmet tonne: in the EU, twice the price gap between SAF and jet fuel, plus supplying the shortfall in a later period; in the UK, a fixed buy-out price (£0.137/MJ for SAF, £0.145/MJ for e-SAF). Combined, non-compliance runs roughly 3 times the cost of complying in the EU and from about 2 to 13 times in the UK.
What is e-SAF, and how is it different from other SAF?
e-SAF, also called Power-to-Liquid (PtL) fuel, is made from renewable or low-carbon electricity, hydrogen, and captured CO₂ rather than biomass feedstocks. It costs more to produce than conventional SAF today, but both the EU (from 2030) and UK (from 2028) mandates carve out a specific, growing sub-quota for it.
What is the UK's Revenue Certainty Mechanism?
It is a UK government scheme, modeled on the Contracts for Difference structure used in the power sector, that guarantees SAF producers a set strike price for up to 10 years, funded by a levy on aviation fuel suppliers. It became law through the Sustainable Aviation Fuel Act 2026, and the first contract allocation round is expected in 2027.
Is the EU considering changes to its SAF mandate timeline?
The EU has scheduled a formal review of ReFuelEU Aviation for 2027, following calls from airline groups to delay the 2030 e-SAF sub-target. No delay has been adopted, and the European Commission has said it remains "fully committed" to both the SAF and e-SAF mandates and that the 2027 review will evaluate the regulation rather than revise it.
Can corporate buyers still claim SAF benefits from fuel used to meet these mandates?
No, mandated volumes are claimed in the compliance market, so to avoid additionality concerns, voluntary corporate scope 3 claims (typically made through SAF certificates and book-and-claim) must come from supply beyond what the mandates require. As mandate demand grows, the pool available to voluntary buyers tightens, which is why early procurement locks in both supply and price.
Key Trends in the 2026 Voluntary Carbon Market
Key Takeaways
- What's happening: The voluntary carbon market (VCM) stalled in 2025, with carbon credit retirements falling 7% despite a 227% surge in corporate climate commitments.
- Why it matters: Over 80% of high-durability carbon removal capacity is at risk of not being realized without additional offtake.
- The implication: For corporate buyers with 2030 climate targets, early movers will define market standards and secure the supply they need, while those who wait risk volatility and constrained access to high-quality credits.
Why the Voluntary Carbon Market Needs Action Now
The voluntary carbon market stands at a crossroads. Credit retirements in 2025 fell far below the billion-tonne-scale projections from earlier in the decade. There is a widening gulf between climate ambition and market action.
The VCM transacts credits that avoid, reduce, or remove emissions. Carbon dioxide removal (CDR), the process of removing and durably storing atmospheric CO₂, remains a small but critical segment, accounting for 5% of credits retired. Limiting overshoot of 1.5°C requires a rapid scale-up of CDR.
However, most organizations with 2030 climate goals have yet to engage in CDR procurement. Without clear market signals today, CDR supply will falter. What's missing isn't capability or knowledge, but the commitment to act. Early movers will define the market in its early stages, while latecomers may face volatility and uncertain supply.
Our latest analysis reveals both troubling trends and clear pathways forward for CDR buyers ready to move from commitment to execution.
[cta]
Five Years of Stagnation: The VCM Falls Short of Projections
For five consecutive years, muted growth and persistent oversupply of poor-quality credits have defined the market. In 2025, credit retirements—a proxy for spot-market demand—reached 157 million metric tonnes (Mt), down 7% from 2024.
This incremental growth is far below what market analysts anticipated earlier in the decade, when several projections expected demand to exceed 1 billion tonnes by 2030.
VCM Credit Trends: Concentrated in Avoidance and Reduction
The VCM has historically been concentrated in avoidance and reduction carbon projects, largely dominated by REDD+, renewable energy, and cookstove credits. 2025 marks the first year a new credit type has dominated, though: projects that reduce emissions of superpollutants now make up roughly 20% of all credits issued in the VCM. Superpollutant issuances increased by about 180% between 2020 and 2025, while retirements grew by roughly 150%.
CDR Remains a Small but Critical VCM Segment
In 2025, CDR credits accounted for only 5% of 2025 retirements, but have a more active forward offtake market—where buyers commit today to purchase credits that will be delivered in the future, providing crucial early-stage financing for projects.
Within the CDR category, high-quality credits are still hard to find. Applying our Criteria for High-Quality Carbon Dioxide Removal, we find that less than 10% of the CDR projects we review meet our high-quality threshold with minimal reservations.
Nature-Based CDR Dominates the Spot Market
Of the all CDR credits issued in the VCM in 2025, 95% originated from nature-based CDR pathways, while 5% represented high-durability CDR pathways such as biochar or bioenergy with carbon capture and storage (BECCS). This distribution reflects the mature role that nature-based CDR projects continue to play in the market, alongside the early stage of durable CDR deployment.
Within nature-based credits, supply and demand dynamics differed significantly between afforestation, reforestation, and revegetation (ARR) and improved forest management (IFM).
- For ARR credits, issuances and retirements have tracked closely at a roughly 1:1 ratio, with issuances remaining flat at around 7–8 Mt annually over the past four years, leaving little inventory available for spot purchasing.
- IFM credits, by contrast, have grown 2.5-fold since 2023, making them one of the largest sources of growth within nature-based credits, though high-quality CDR credits from IFM are in much lower supply.
For buyers, this means ARR credits are increasingly difficult to source on the spot market, while IFM credits are more readily available—though careful diligence is needed to identify high-quality projects.
Nature-based offtakes and commitments have expanded in recent years, with more than 90 Mt of future delivery now contracted or committed. The vast majority of these commitments are concentrated in ARR projects, highlighting both the supply constraints facing ARR today and buyers' foresight in securing the supply they will need in the near future.
High-Durability CDR Is Almost Entirely Forward-Looking
The spot market for high-durability CDR credits represents only 0.3% of activity in the VCM, but important dynamics are beginning to emerge as more high-durability CDR technologies reach the market.
From 2021 to 2025, roughly 80% of high-durability issuances and retirements came from biochar and geologic storage. However, the emergence of large-scale geologic CDR projects is beginning to shift the balance, with individual projects capable of delivering hundreds of thousands of tonnes annually. Early-stage methodologies such as enhanced rock weathering (ERW) and ocean alkalinity enhancement (OAE) issued their first credits in 2025, totaling roughly 12,000 tonnes.
While the spot market for high-durability CDR is growing and diversifying, forward offtake agreements continue to define the landscape. The ratio of high-durability spot retirements to volumes committed through forward offtake is 1:70—meaning for every tonne retired today, 70 tonnes have been committed for future delivery.
Forward Offtake Commitments Are Rising Across CDR Pathways
To date, forward offtake agreements, advanced market commitments (AMC), and large contracted deals with intermediaries cover more than 40 Mt of high-durability CDR, in addition to over 90 Mt of nature-based CDR. These cumulative volumes highlight the increasingly central role of forward purchasing in shaping future supply, particularly for capital-intensive, high-durability pathways.
However, the success of forward offtake strategies depends critically on careful due diligence. Without a rigorous assessment of technological readiness, project viability, and delivery risks, forward commitments risk financing projects that fail to deliver, undermining both individual investments and broader market confidence.
Market Concentration of Forward Offtake Remains High
A small group of companies continues to drive the majority of forward offtake activity. In 2025, Microsoft remained the clear market leader, accounting for roughly 60% of contracted nature-based CDR offtakes and more than 80% of high-durability offtakes with a named buyer announced to date. Other active buyers—including Google, JPMorgan Chase, Equinor, and Amazon—have expanded their commitments, but overall market concentration remains high.
This concentration reveals both opportunity and risk: while anchor buyers are proving the market model works, broader participation is needed to unlock the full scale of CDR deployment required.
Growing Gap Between Climate Ambition and Market Action
Corporate climate targets anchor most current VCM activity: All of the top-10 buyers in the market today participate based on either self-declared commitments or net-zero commitments aligned with the Science Based Targets initiative (SBTi).
Demand forecasts based on these future commitments project that total CDR demand could reach 46-110 Mt by 2030, a ~6-14x growth from today. Yet, how companies decide to implement their targets will ultimately affect the composition of CDR demand within the VCM.
Rather than relying solely on public commitments, we analyzed the behavior of companies that are actively purchasing CDR today. Should today's top buyers follow through on their stated CDR commitments, CDR demand could reach a minimum of 28 Mt by 2030, with 6.5 Mt of demand for high-durability CDR.
However, the discrepancy between observed demand and target-led scenarios shows a persistent gap between what companies say and what they do. SBTi reported a 227% surge in companies setting both near-term and net-zero targets in the 18 months leading up to mid-2025, while carbon credit retirements in the VCM fell 7% in 2025.
Shifting from intention to execution will ultimately determine whether the VCM evolves into a durable, functioning marketplace or stalls short of the scale required for credible, net-zero pathways.
Rising Trends of Greenhushing and Anonymity Obscure CDR Demand
In the broader VCM, 55% of tonnes retired on the spot market over the past three years have been anonymous, and that fraction has been increasing. A similar trend is true of high-durability CDR: nearly 40% of all offtake transactions made in 2025 did not disclose the participating buyer. This buyer behaviour could reflect the often-discussed greenhushing phenomenon.
When anonymous actors dominate, it becomes harder to track demand signals, verify corporate progress, and establish clear integrity benchmarks. This opacity creates systemic risk for the entire market.
Market Growth Tipping Points on the Horizon
Several pivotal events on the horizon could mitigate risk and unlock project development, tipping buyers into action after half a decade of limited market growth:
- Voluntary demand: SBTi's Corporate Net Zero Standard V2.0, published in June 2026, confirms credits still can’t count toward scope 1-3 targets, but introduces a voluntary recognition program starting in 2027 and mandatory removal purchasing for large companies from 2035, starting at 1% of footprint.
- Compliance demand: The UK's Emissions Trading Scheme (ETS) Authority has already committed to integrating carbon removals into the UK ETS by 2028 via an auction model. This is the first confirmed large-scale compliance pathway for CDR credits, though credit-type eligibility is still being worked out.
- Regulatory support: Publication of Article 6.4 methodologies under the Paris Agreement and loosening of CORSIA credit supply bottlenecks could expand eligible supply and boost buyer confidence.
These tipping points in policies, standards, and market structures are advancing with clear timelines, creating conditions to move CDR procurement from hesitation to activation.
CDR Supply Faces Critical Challenges
While buyer inaction poses one threat to market growth, the supply side faces its own critical challenges.
30%–220% More Investment Is Needed in Nature-Based CDR Supply
Nature-based CDR would require a 30%–220% increase in finance to support current corporate targets. Relae (formerly Carbon Direct) has identified US$18 billion in publicly committed funds for nature-based CDR announced from 2018 to 2025. If deployed immediately to generate high-quality CDR, this level of funding could translate into up to 32 Mt per year by 2030 and 290 Mt cumulatively through 2040.
This is sufficient to meet the conservative 28 Mt demand floor from today's active buyers—but falls well short of what would be needed if even a fraction of companies with 2030 targets begin executing on their stated commitments.
80% of High-Durability CDR Projects Are at Risk
The situation is more acute for high-durability CDR. We estimate that over 80% of the total 2030 credit supply pipeline is at risk, due to insufficient project offtake and financing agreements.
Without increased offtake and financing support, we expect that the landscape for capital-intensive, high-durability CDR may consolidate
CDR Buyers Will Determine Which Projects Get Built
The supply-side ecosystem features a sufficient number of high-quality CDR suppliers with the potential to scale. These suppliers face purchasing behavior insufficient to meet buyers' own stated climate goals. In this environment, every CDR procurement decision matters. Companies that delay procurement risk missing their own climate targets while also ceding competitive advantage to early movers who secure the limited supply of high-quality credits.
Five Actions to Strengthen the CDR Market
Buyers and investors can play a critical role in reducing project risk and strengthening the CDR market. Our full report details five essential actions:
- Use purchasing power wisely
- Prioritize project diligence
- Construct bankable contracts
- Support market data transparency and CDR goals
- Undertake project assurance
Each action addresses specific market failures and, when implemented strategically, can significantly improve the likelihood that high-quality CDR projects reach operation and deliver credits as contracted.
With 2030 only four years away, the window for action is rapidly closing. Early movers will secure supply and define market standards, while those who wait risk entering a crowded market with limited access to high-quality credits and escalating prices.
[cta]
Frequently Asked Questions
Why did the voluntary carbon market stall in 2025 despite rising corporate climate commitments?
Retirements fell 7% even as SBTi reported a 227% surge in companies setting near-term and net-zero targets. The gap reflects that most companies with 2030 goals haven't yet moved from setting targets to actually procuring credits.
Is carbon dioxide removal a proven market today, or still emerging?
CDR remains a small segment—about 5% of 2025 retirements—but it has an unusually active forward market, with buyers committing today to volumes delivered years from now. High-durability pathways like biochar and geologic storage are still early-stage relative to nature-based credits.
How does the new SBTi Net-Zero Standard affect corporate carbon credit strategy?
Under the new SBTi Net-Zero Standard, credits still can't be counted toward scope 1, 2, or 3 targets. But it introduces a voluntary recognition program starting in 2027, and requires large companies to begin purchasing carbon removals from 2035, starting at 1% of their footprint.
What should CDR buyers prioritize given current market conditions?
Given how concentrated forward offtake activity is today, buyers should prioritize rigorous project diligence and bankable contract structures over simply committing volume—the 2026 State of the Voluntary Carbon Market report details five recommended actions in more depth.