Beyond Backup Generators: Hydrogen as Baseload Power for AI Infrastructure
Key Takeaways
- Speed to operation is the value proposition. While grid interconnection can take 3-5 years in constrained regions, hydrogen fuel cell systems can be deployed in a fraction of that time—a large advantage for operators racing to meet data center capacity demands.
- Hydrogen is moving beyond backup. Fuel cells could supply 6-15% of incremental data center power, functioning as primary or near-primary power rather than emergency standby.
- Higher fuel costs can be rational. When the alternative is a multi-year wait for grid power and the development loss that comes with it, paying a premium for hydrogen is better than falling behind.
The Grid Can’t Keep Up With Data Centers
The data center infrastructure buildout is moving at a pace the US power grid was never designed to accommodate. Cleanview tracks about 63 GW of operating US data center capacity and another 392 GW in planning, roughly six times what exists today. Developers in high-demand corridors—Northern Virginia, Central Texas, Phoenix—are finding that the grid can't deliver new capacity fast enough.
Interconnection queues now stretch 3-5 years in many regions, and that’s before accounting for permitting, transmission upgrades, and substation buildouts. For operators that need power online faster than the grid can deliver it, this timeline gap is a fundamental constraint on the business.
This mismatch between AI deployment, generator bottlenecks, and grid timelines is why hydrogen is entering the conversation as a viable power option for a growing subset of data center deployments, alongside natural gas with carbon capture, geothermal, and long-duration energy storage.
Hydrogen Fuel Cells: From Standby to Primary Power
For most of its history in data centers, hydrogen has been discussed as a cleaner replacement for diesel backup generators. That framing undersells the opportunity.
The shift happening now is more fundamental: hydrogen fuel cells are being evaluated as primary or near-primary power sources for behind-the-meter and facilities that can’t wait for grid connection. Notably, many modern fuel cell systems—including solid oxide fuel cells—can run on natural gas today and transition to hydrogen as clean supply becomes available. Bloom Energy's 2024 deal with American Electric Power to provide up to 1 GW of fuel cells for data center power illustrates this approach: the systems will initially run on natural gas, with the capability to switch to 100% hydrogen in the future.
Furthermore, fuel cell systems are modular, can be deployed incrementally as load grows, and provide continuous power output. This is a promising path, and one that will scale only as fast as the fuel cell supply chain can keep up. Unlike solar or wind, fuel cells aren’t weather-dependent. Running on hydrogen, they produce zero direct emissions at the point of use. Running on natural gas, they still emit CO2, but their higher efficiency gives them a lower carbon intensity than a comparable gas turbine.
Goldman Sachs estimates that fuel cells could supply 6-15% of incremental data center power (the estimate doesn't specify fuel mix, though most near-term deployments would run primarily on natural gas). This is a meaningful share of new capacity, driven largely by operators who face years-long waits for both grid connections and new gas turbines. Bloom Energy, whose fuel cell products serve data center applications, has been a notable outlier in an otherwise struggling hydrogen sector, with its stock rising sharply on strong revenue performance and growing investor enthusiasm around data center power demand.
Speed to power depends on the fuel. Solid oxide fuel cells run on pipeline natural gas today, so operators do not wait for a hydrogen supply chain. Bloom states it can deliver onsite power for an entire data center in as little as 90 days, with the ability to add modules as load grows under certain circumstances. In all but a few select locations, hydrogen comes later when the same systems switch fuels as clean supply scales. Projects that need hydrogen from day one face additional challenges. Limited hydrogen availability and supporting infrastructure across much of the US can undermine the potential speed advantage of hydrogen-dependent projects. Nevertheless, locations with suitable hydrogen supply and supporting infrastructure may offer viable near-term opportunities.
The Hydrogen Premium: When Paying More Makes Sense
Hydrogen-generated power is more expensive than other forms of electricity generation in most markets. The logistics penalty (including compression, transport, and storage) can push hydrogen from $4/kg at the production site to $8-16/kg delivered, making the economics look unfavorable on a simple $/MWh comparison. In practical terms, hydrogen at $4-6/kg translates to roughly $120-180/MWh on an energy-content basis (LHV). At a fuel cell electrical efficiency of around 50%—typical for solid oxide systems—the effective cost of electricity rises to approximately $240-360/MWh for co-located production, compared to $40-60/MWh for natural gas fuel cells, $51-129/MWh for gas combined cycle, and $144-276/MWh for gas peakers. Operators can improve hydrogen economics by co-locating with production, avoiding the logistics penalty that can double or quadruple delivered costs.
While expensive, this cost comparison misses the central point. The relevant question is not whether hydrogen is cheaper than grid power, but whether it is better than having no access to power at all.
For an operator with signed contracts and a 100 MW facility sitting idle during a multi-year interconnection queue, the opportunity cost is substantial. At average US wholesale colocation rates (~$196/kW/month - a record high), a facility of that size represents roughly $235 million per year in potential revenue—meaning even a single year of delay can outweigh years of hydrogen fuel premiums.
The Inflation Reduction Act’s 45V Production Tax Credit further compresses the gap, offering up to $3/kg for clean hydrogen production—but projects must begin construction by December 31, 2027, to qualify. That deadline adds urgency to what’s already a time-sensitive calculus.
Reframing the Cost Debate for Speed-to-Power
The debate about whether hydrogen is cost-competitive with grid power misses the strategic challenge facing data center operators today: the fastest path to reliable, clean power. Hydrogen can play a consequential role in that timeline in some markets.
Assessing that requires modeling the full picture: grid interconnection timelines, hydrogen supply chain costs at a specific location, the 45V credit’s impact on project economics, and how hydrogen compares to batteries and other bridging technologies for a data center’s particular load profile.
Relae’s advisory team helps data center operators and technology companies evaluate these tradeoffs with rigorous, independent analysis. If speed to operation is a factor in your energy planning, let’s talk.
Frequently Asked Questions
How much faster is hydrogen fuel cell deployment than waiting for grid interconnection?
Grid interconnection in constrained regions can take 3-5 years once permitting, transmission upgrades, and substation buildouts are factored in. Fuel cell systems, especially those that start on natural gas and then transition to hydrogen, can be deployed in a fraction of that time. They are modular and can be installed and scaled incrementally as a facility’s load grows, though the pace depends on equipment and fuel supply.
If hydrogen costs more than grid power, why would an operator choose it?
For an operator with a 100 MW facility sitting idle during a multi-year interconnection queue, the lost revenue—roughly $235 million a year at average US wholesale colocation rates—can outweigh years of hydrogen’s fuel premium. That makes the higher cost a rational tradeoff against a multi-year wait for grid power, not just an expensive alternative to it.
Do hydrogen fuel cell systems have to run on pure hydrogen from day one?
No. Many modern fuel cell systems, including solid oxide fuel cells, can run on natural gas today and transition to hydrogen as clean supply becomes available. Bloom Energy’s up to 1 GW agreement with American Electric Power follows this model: the systems start on natural gas, with the capability to switch to 100% hydrogen as the hydrogen supply chain matures.
Power & Energy
Relae provides independent advisory for large corporate buyers, power providers, and infrastructure investors making high-stakes decisions about clean firm power, grid constraints, data center energy optimization, and long-term investment strategy. Our insights help you evaluate solutions that can be deployed reliably, responsibly, and affordably, so you can navigate an evolving energy landscape with confidence.
AI Meets the Grid: Interconnection Queue Analysis in PJM and ERCOT



Jordan Alford

Jordan Alford
,

Jordan Alford is a chemical engineer that offers a unique blend of technical expertise, project management skills, and strategic vision to drive impactful decarbonization outcomes.
In her role at Relae, Jordan conducts thorough due diligence to assist clients in implementing carbon management projects, offering clear recommendations and detailed analysis.
Jordan’s background is in facility operations and carbon reduction planning. Prior to joining Relae, Jordan worked as an Offshore Support Engineer supporting operations in the Gulf of Mexico of a large energy company. She also has worked as an Environmental Engineer supporting Scope 1 and Scope 2 emission reduction strategy for both traditional oil & gas as well as low carbon fuels.

Alex McCann

Alex McCann
,
Alex’s professional journey began by developing local and national policy on the built environment and renewable energy, which then shifted towards supporting businesses and built environment projects decarbonise at a strategic level.
More recently, Alex has led research on carbon markets and digitalization of energy systems, whilst keeping a keen eye on the challenges and opportunities of hydrogen. Alex’s career highlights include speaking at the House of Lords at UK Parliament, to ministers and politicians, to promote the case for net zero policy in the built environment to support the energy transition.
Prior to working professionally, throughout his MSc degree in Climate Change & Environmental Policy, Alex had an academic focus on climate modeling working alongside IPCC scientists, assessing temperature projections relating to tipping points and how this impacts the feasibility of achieving Paris Agreement targets.
Alex has retained an impact-led ethos throughout his career to date, consistently prioritizing deep decarbonization efforts whilst ensuring core business functions remain relevant.

Nicki Stuckert, PhD

Nicki Stuckert, PhD
,
Nicki's passion for climate change and actionability has led her to focus her career on this and how she and others can make an immediate direct impact. She received her PhD at the University of Michigan with a focus on hydrogen storage and direct air capture. From there she spent nine years in industrial gas research and development commercializing many technologies from initial concept to full deployment. Her past years have been spent as a technology expert focusing on hydrogen storage/transportation and decarbonized production methods including carbon capture and storage, electrolysis and pyrolysis. At Relae Inc. she helps our clients identify decarbonization options using hydrogen or carbon capture and future technologies for them to integrate hydrogen cost effectively into their carbon management plans.
American-Made Energy Storage Innovations Prize
What to Read Next
Who Pays for AI? The Hidden Cost of Rising Data Center Demand
Key Takeaways
- AI data centers are driving the fastest electricity demand growth in decades: US data centers consume an estimated 4 to 5% of US electricity today, projected to reach as much as 9 to 17% by 2030 (EPRI).
- Without deliberate cost allocation, residential and small-business ratepayers subsidize private AI infrastructure.
- Peer-reviewed modeling projects data center growth could raise US power costs 6 to 29% nationally by 2030, and up to 57% in the hardest-hit regions.
- Utility commissioners, state regulators, and policymakers now have working models to draw from, including large-load tariffs, dedicated rate classes, and direct assignment of transmission costs.
AI Data Center Energy Demand Is Testing the Limits of the Grid
AI is driving electricity demand at a pace the US grid has not seen in decades. US data centers already consume an estimated 4 to 5% of the nation's electricity, and EPRI projects that share could reach 9 to 17% by 2030. Behind nearly every AI model and digital product is the invisible infrastructure that powers it: data centers. These facilities are resource-intensive, requiring massive amounts of electricity to power servers, substantial water for cooling, and extensive new grid infrastructure.
In the race to decarbonize the grid, data centers are emerging as a critical pressure point. This infrastructure sits at the intersection of digital growth and climate action, forcing a difficult question: who pays to power AI?
Legacy Utility Models Weren’t Built for this Growth
Utilities must upgrade aging grid infrastructure to meet this new surge in electricity demand, while maintaining reliability. Under legacy utility frameworks, it's often ratepayers who foot the bill for those upgrades. And the costs are not distributed equitably.
Traditional utility planning assumes that increased demand justifies expanded investment in generation and transmission infrastructure. When a new type of large customer, like a tech company, moves into a utility’s service territory, utilities plan new infrastructure to meet that projected demand.
Utilities typically recover the cost of new infrastructure through a process called rate base cost recovery. This allows utilities to charge all customers in the “rate base” for the expenses incurred, including thousands of individuals, families, and small businesses, even when those costs stem from the demands of just a few large users.
This legacy model struggles to keep pace in the AI boom era, where massive new electricity demand can double within a few years, a scale of growth that used to take decades. Additionally, while data centers create short-term construction jobs, there are almost no lasting employment benefits for local communities.
It's clearly inequitable for all ratepayers to bear the costs of upgrading the grid to benefit just a small number of massive data centers. But that's not the only problem. If utilities decide to meet new power demand from large data centers with new fossil fuel generation, such as gas peaker plants, they risk creating stranded assets: infrastructure that becomes obsolete or uneconomical as climate targets, clean energy mandates, or the cost-effectiveness of renewables accelerates. Once built, ratepayers will have to continue paying for these long-lived investments for years, even if they are underutilized or retired early due to policy shifts. This risk is no longer hypothetical: to serve projected data center load, Georgia regulators approved a plan to extend the lives of two massive coal plants to as late as 2038, and Virginia regulators stripped roughly $350 million tied to speculative early-stage data center projects out of Dominion Energy's revenue forecast.
If utilities are locking in decades of new fossil fuel generation to meet short-term data center growth, ratepayers may be left holding the bag for infrastructure that contradicts their climate goals and state mandates, with little ratepayer or community input into the decision. Effectively, local communities may be subsidizing a technology that they did not directly ask for in the first place and has little to no direct community benefits. The result is a long-term misalignment between utility investment strategy and the public interest.
Ratepayers Bear the Cost of Private AI Expansion
The economic burden of data center expansion can fall disproportionately on households and small businesses. But data centers, as the largest and fastest-growing users, often negotiate bespoke contracts, subsidized rates, or fixed-price electricity agreements that shield them from long-term cost volatility.
This can result in other customers, especially residential and low-income ratepayers, bearing a disproportionate share of the infrastructure and maintenance costs. In many states, residential and low-income customers already experience energy cost burdens that exceed affordability thresholds. Adding the weight of infrastructure investments to serve energy-intensive data centers, without sharing those costs equitably, exacerbates an already regressive utility cost allocation system.
Georgia shows how these costs reach ratepayers even when regulators act. Georgia Power customers absorbed six rate increases totaling roughly $43 per month between 2023 and 2025, and while regulators approved a base-rate freeze through 2028, the freeze excluded fuel and storm costs. In 2026 fuel-cost proceedings, testimony showed that large industrial and data center customers raise other customers' monthly fuel costs by 5 to 11%, prompting the Georgia Public Service Commission to open an investigation into how fuel costs are allocated between large loads and residential customers. Ratepayers noticed: in November 2025, both Georgia PSC seats flipped in elections run explicitly on utility bills and data center cost-shifting. In Virginia, regulators approved a rate increase of roughly $16 per month for typical Dominion Energy residential customers amid surging data center demand.
These examples are not anomalies. A peer-reviewed study in Environmental Research Letters projects that data center growth could raise US power costs 6 to 29% nationally by 2030, and up to 57% in the hardest-hit regions, with Virginia among the steepest. This is a systemic shift in energy demand, one that places a growing burden on communities and lacks clear public benefits.
Environmental and Community Impacts Are Mounting
Beyond economic impacts, the geography of data center development reveals another layer of inequity: environmental justice. Data center siting often prioritizes affordable land, low resource costs (e.g., electricity, water), and climate considerations like heat variability. They also rely on proximity to pre-existing fossil fuel generation and transmission infrastructure. Research now confirms the pattern this creates: an analysis of 550 EPA-regulated data centers found that air pollution burdens near data centers rise with the share of people of color living nearby, and a 2026 Washington state study found more than half the state's data centers sit in census tracts with the highest concentrations of people of color.
These communities often absorb the negative externalities beyond their electricity bills, including increased air pollution from peaker plants and on-site diesel or gas backup generators, traffic and construction noise, water stress, and land use changes. Simultaneously, they do not receive direct net positive benefits. Frontline communities are paying attention to this trend, and opposition has become a defining force in where AI infrastructure gets built. Gallup finds 71% of Americans now oppose a data center in their own area, and Data Center Watch counted roughly $130 billion in projects blocked or delayed in the first quarter of 2026 alone. The stakes of community opposition are increasing and intensifying.
The consequences of ignoring communities are now playing out in federal court. At xAI's Colossus facility in Memphis, developers operated dozens of on-site gas turbines without air permits in a majority-Black area already burdened by industrial pollution. After the Shelby County Health Department granted permits for a subset of turbines in July 2025, the fight moved to xAI's second campus across the state line: in April 2026, the NAACP filed a Clean Air Act lawsuit over roughly 27 unpermitted gas turbines at the Colossus 2 site in Southaven, Mississippi, seeking penalties of more than $100,000 per day. On-site power can help reduce demand on the grid, which can be a benefit. But when that generation runs without permits or oversight, nearby communities bear unmeasured health and environmental impacts from hazardous emissions, and the litigation now underway shows how quickly unpermitted power becomes a legal and reputational liability.
To date, data center developers do not appear to have maximized potential community benefits or engagement. Data centers have not typically employed many local residents beyond construction phases, resulting in limited economic benefits, particularly when facility ownership is distant from the local community or has few local ties. When these same communities already experience high pollution burden or economic precarity, the cumulative impact of a new data center can deepen existing vulnerabilities.
Water use is also a mounting environmental justice concern. Many data centers rely on evaporative cooling systems that draw millions of gallons of water per day, and peer-reviewed research finds significant gaps in how the industry discloses its water footprint. In drought-prone regions, this can stress already-depleted aquifers and heighten tensions over water access.
The result is a high-stakes tradeoff between digital infrastructure and local resource resilience, one that communities should be a part of deciding.
States and Regulators Are Writing the New Rules
Virginia, the "Data Center Capital of the World," is home to 674 data centers that consume an estimated 25% of the state's electricity, a share EPRI projects could reach 39 to 57% by 2030, the highest of any state. After legislators considered but did not pass data center bills in the 2025 session, the 2026 General Assembly passed roughly 15 data center bills, including legislation, signed in May 2026, directing regulators to ensure data center costs are not subsidized by other customers, along with new requirements for site impact assessments and water-use reporting. Virginia's State Corporation Commission had already created a dedicated rate class for high energy use customers, with 14-year contract terms and minimum charges that apply whether or not the projected load materializes, and in August 2026 it went further, ordering Dominion to develop a tariff that directly assigns transmission costs to the data centers that trigger them.
Virginia is not alone. Ohio regulators approved a landmark tariff requiring large data centers to pay for 85% of the capacity they request, whether or not they use it. Oregon's POWER Act created the nation's first legislated rate class for data centers. Texas gave its grid operator authority to curtail large loads during emergencies. Minnesota, California, Alabama, Tennessee, South Dakota, Nebraska, and Florida have all enacted their own ratepayer-protection measures, and at the federal level, FERC ordered the nation's largest grid operator to write new rules for data centers that co-locate with power plants, citing the need for consumer protection and clear cost allocation. State energy officials are also proactively planning for data center expansion.
The direction is clear. The unresolved question is whether these reforms move faster than the costs already flowing to ratepayers.
What Is the Public Good of Data Centers?
AI infrastructure powers innovation, job creation, research, and the technologies we rely on every day. But it may also bring inequitable social and direct financial costs. Like highways, factories, and pipelines before them, the question remains: What is the public good of AI data centers? How should we hold data center developers accountable to the public interest, which values a clean energy future? We need clear-eyed assessments of how data centers impact energy affordability, climate progress, and environmental equity.
Yesterday's utility policy frameworks were not designed for hyperscale AI data centers. The reforms now underway are a start, but without sustained attention they may still force the public to subsidize private expansion, through economic and environmental costs, often without equitable community engagement, climate accountability, or local benefit.
AI Data Center Growth Needs Accountability, Equity, and Reform
To align data center growth with the public interest, the stakeholders involved now have proven models to build on:
- Utilities and regulators can require large customers to pay an equitable share of new infrastructure costs, as Ohio's minimum-take tariff and Virginia's dedicated rate class now do.
- Public Utility Commissions can mandate equity and community impact assessments during siting and permitting, following Virginia's new site assessment requirements.
- States can condition tax incentives and zoning approvals on local hiring, emissions reductions, and community benefits agreements.
- Data center developers can prioritize clean power and commit to transparent, equitable community engagement and benefits plans before opposition, litigation, and cancellations decide the outcome for them.
As we build the digital backbone of the next century, we must avoid repeating injustices of the past. A just energy transition requires more than megawatts: it demands equity, policy interventions, and real climate progress.
[cta]
Frequently Asked Questions
How do utilities typically recover the cost of infrastructure built to serve large data center customers, and why does this burden fall on other ratepayers?
Utilities recover infrastructure investments through rate base cost recovery: regulators approve new generation, transmission, and distribution spending, and the costs are spread across all customers in the rate base through their monthly bills. That model worked when demand growth was gradual and diffuse, but when a single data center campus drives hundreds of megawatts of new investment, standard cost allocation spreads those costs across households and small businesses unless regulators adopt a special tariff or rate class that assigns them to the customer who caused them.
What are stranded assets in the context of data center power demand, and how do they create long-term risk for utilities and ratepayers?
Stranded assets are long-lived infrastructure investments, like new gas plants built for projected data center load, that become underused or uneconomical before they are paid off, whether because demand never materializes or because policy and market shifts overtake them. Because utilities recover those costs through rates over decades, ratepayers keep paying even if the asset sits idle. The risk is acute today because data center demand forecasts are highly uncertain: Virginia regulators removed roughly $350 million tied to speculative data center projects from one utility's revenue forecast in 2025.
Why do data centers often locate in rural or low-income communities, and what are the environmental justice implications?
Data center siting favors cheap land, fast permitting, low-cost power and water, and proximity to existing generation and transmission, conditions most common in rural, low-income, and historically marginalized communities. Research confirms the consequences: analysis of 550 EPA-regulated data centers found air pollution burdens rise with the share of people of color living nearby. These communities absorb the air pollution, water stress, noise, and land use impacts while receiving few lasting jobs or direct benefits.
What regulatory or policy tools can states and Public Utility Commissions use to ensure data center growth doesn't unfairly shift costs to residential and small-business ratepayers?
The toolkit has expanded rapidly since 2025. Commissions can create dedicated large-load rate classes and tariffs with minimum take-or-pay provisions, long contract terms, collateral requirements, and exit fees, as Ohio and Virginia have done; directly assign infrastructure enhancement costs to the customers that trigger them; and require site impact assessments during permitting. Legislatures can codify ratepayer protections, require water and load-forecast transparency, and condition tax incentives on community benefits, models now in place in at least eight states.
This commentary reflects public policy analysis and opinion, not legal advice or regulatory determinations.
Why AI Data Centers Are Being Blocked: A Project-Level Examination
Key Takeaways
- Community opposition has blocked, withdrawn, or stalled more than $170 billion in announced AI data center investment across 20 US states since January 2024. The pace is accelerating: 6 cancellations in 2024, 25 in 2025, and more than 20 additional cancellations by May 15, 2026.
- Data center opposition is bipartisan. It spans red and blue counties, every region, and multiple grid operators, with nearly two-thirds of the blocked investment sitting in counties that voted for Donald Trump in 2024.
- Process and transparency, more than resource concerns alone, drive the fastest and most durable opposition. How a developer runs the engagement process shapes both community sentiment and the project’s ultimate success.
How Many AI Data Center Projects Have Been Cancelled?
Between January 1, 2024, and May 15, 2026, community opposition blocked, withdrew, or stalled 46 announced AI data center projects across 20 US states, representing more than $170 billion in announced investment. These values are disclosed or derived for 35 of the 46 projects; the remaining 11 carry no public figure.
[stat]
The pace of successful opposition has accelerated sharply. Cancellations rose from 6 in 2024 to 25 in 2025. The first five months of 2026 added more than 20 additional cancellations, the fastest stretch on record.
Virginia leads the state count with 11 blocked projects, followed by Indiana with 7 and Texas with 5. Together, those three states account for roughly half of all cancellations in the dataset. The PJM grid region carries the largest single share of blocked investment at $70 billion across 13 projects, followed by MISO at $37 billion.
Is Opposition to Data Centers Bipartisan?
Yes. The opposition wave crosses party lines on every measure we examined. Republican-leaning counties hosted 28 of the 46 projects (61%), Democratic-leaning counties hosted 16 (35%), and 2 fell within five points.
Weighted by announced investment, about two-thirds of blocked dollars sat in Republican-voting counties. Strong Republican counties (those Trump won by more than 15 points) account for $99 billion across 23 projects. Strong Democratic counties account for $29 billion across 9 projects. The remaining $44 billion spans Lean Republican, Tossup, and Lean Democratic counties.
Why Are Communities Opposing Data Centers?
Communities raise a consistent set of concerns across the country: water demand, electricity rates, air quality where developers propose gas co-generation, rural character, and a lack of transparency in the development process.
Across the seven cases that we studied in depth, process, and transparency concerns were the most consistently cited factors associated with opposition. Non-disclosure agreements between developers and local officials, ownership structures in which the ultimate end-user was not publicly identified, and closed-door pre-application negotiations produce opposition faster and more durably than any other concern.
The pattern holds across very different communities: a diffuse civic mobilization in rural Georgia, an NGO water coalition in a Texas college town, a conservation coalition anchored by the Southern Environmental Law Center in Southside, Virginia, and an institutional civic organization with legal-expert and celebrity support in northern Virginia. Each produced the same outcome, and each flagged process and transparency as a dominant or top-three concern in the public record.
By the time a project reaches its first public hearing against organized community opposition, the political path of the project is largely set. Late-stage benefits packages consistently fail to reverse that trajectory. Communities read them as concessions, not commitments.
Assess Community Opposition Risk Before You Site
Community opposition is now a structural feature of the AI data center siting environment. The patterns are clear enough to act on now. Relae's Community Impacts team helps developers and capital partners implement responsible development standards through pre-siting community intelligence, calibration of benefits design to specific community contexts, and building the verification scaffolding that turns commitments into outcomes.
[cta]
Frequently Asked Questions
Which states are banning data centers in the US?
The first statewide moratoriums on data centers have arrived. In July 2026, Governor Hochul signed the country's first statewide moratorium, an executive order pausing state environmental permits for up to one year for new data centers of 50 MW or more. Texas followed weeks later, halting approvals of new data center grid connections until state regulators audit their power, water, tax, and ownership details. This is a snapshot from August 2026, and we will likely see additional changes in the months ahead.
The local picture is more developed. Individual municipalities and counties have adopted moratoria and zoning ordinance amendments that block or restrict data centers within their jurisdictions. The City of Peculiar, Missouri, removed data centers from its light-industrial zoning entirely. Monroe County, Georgia, and Jones County, Georgia, both adopted moratoria after project denials in 2025. Cassville Township, Wisconsin, and San Marcos, Texas adopted zoning and code amendments in 2026. State legislatures in Virginia, Indiana, Texas, and Missouri have taken up data center siting, ratepayer, and permitting legislation, though most bills remain in progress rather than enacted.
How much data center investment has been blocked in the US?
More than $170 billion in announced AI data center investment has been blocked, withdrawn, or stalled by community opposition across 46 projects and 20 US states between January 1, 2024 and May 15, 2026.
Relae arrived at this figure from data on 35 of the 46 projects; 11 have no publicly disclosed investment value. The pace has accelerated sharply: 6 cancellations in 2024, 25 in 2025, and more than 20 additional cancellations in the first five months of 2026 alone. Virginia leads the state count with 11 projects. The PJM grid region carries the largest single share of blocked capacity at $70 billion across 13 projects.
What causes a data center project to be cancelled by community opposition?
As of August 2026, communities cite a consistent set of concerns across cancelled projects: water demand, grid strain and residential rate impacts, air quality where developers propose gas-fired co-generation, rural character and farmland conversion, and lack of transparency in the development process.
In the seven cases we studied in depth, process and transparency were together the most consistent driver of opposition. Non-disclosure agreements between developers and local officials, shell LLC ownership structures that conceal the end-user, and closed-door pre-application negotiations produce faster and more durable opposition than any single resource concern. Late-stage benefits packages consistently fail once that transparency-driven frame has formed.
Navigating Scope 2 Accounting Changes
Key Takeaways
- Voice your opinion: The Greenhouse Gas (GHG) Protocol is updating its scope 2 guidance with final standards expected in 2027, which may require hourly and regional matching of renewable energy certificates (RECs), potentially changing how companies claim their electricity-related emission reductions.
- Act now to secure renewable energy contracts: Companies should move forward with their scope 2 climate commitments today. The GHG Protocol is expected to grandfather in contracts entered into under existing rules.
- Beyond the megawatt hour (MWh): High-impact forward REC contracts measure impact beyond the current annual MWh match requirement, maximizing near-term carbon abatement and social impact for every dollar invested.
Why 2027 Rule Changes Matter for 2030 Targets
Companies racing to meet 2030 climate targets face converging pressures: surging electricity demand, constrained renewable energy supply, and scope 2 accounting rules that could undergo significant changes by 2027.
In a recent webinar, power market experts from Relae (formerly Carbon Direct) and Ever.green explored these changes. Patti Smith, former Electricity Decarbonization Lead at Relae; Julia Millot, Senior Power Decarbonization Manager at Relae; and Liz Pearce, Chief Revenue Officer at Ever.green, unpacked what's changing and how companies can respond.
The stakes are high. Based on GHG Protocol Scope 2 Public Consultation materials, companies may need to match RECs to electricity consumption on an hourly and locational basis as early as 2028. However, we expect the GHG Protocol to grandfather forward REC contracts signed before new rules take effect, enabling companies to continue advancing toward 2030 targets amid rule uncertainty.
Big Changes to the Power Grid
The US power grid is entering sustained demand growth for the first time in decades. "Over the next five years, data centers alone are going to put [the equivalent] of four New York Cities onto the grid," Smith explains, citing forecasts that project around 200 terawatt hours of new data center load through 2030 (i.e. cumulative energy consumption). That demand growth also shows up in near-term grid planning. NERC's January 2026 Long-Term Reliability Assessment forecasts North American summer peak demand rising by 224 gigawatts—a 24% increase—over the next decade, with new data centers cited as the primary driver. These figures highlight that peak capacity and total energy consumption are directly impacted by the data center boom.
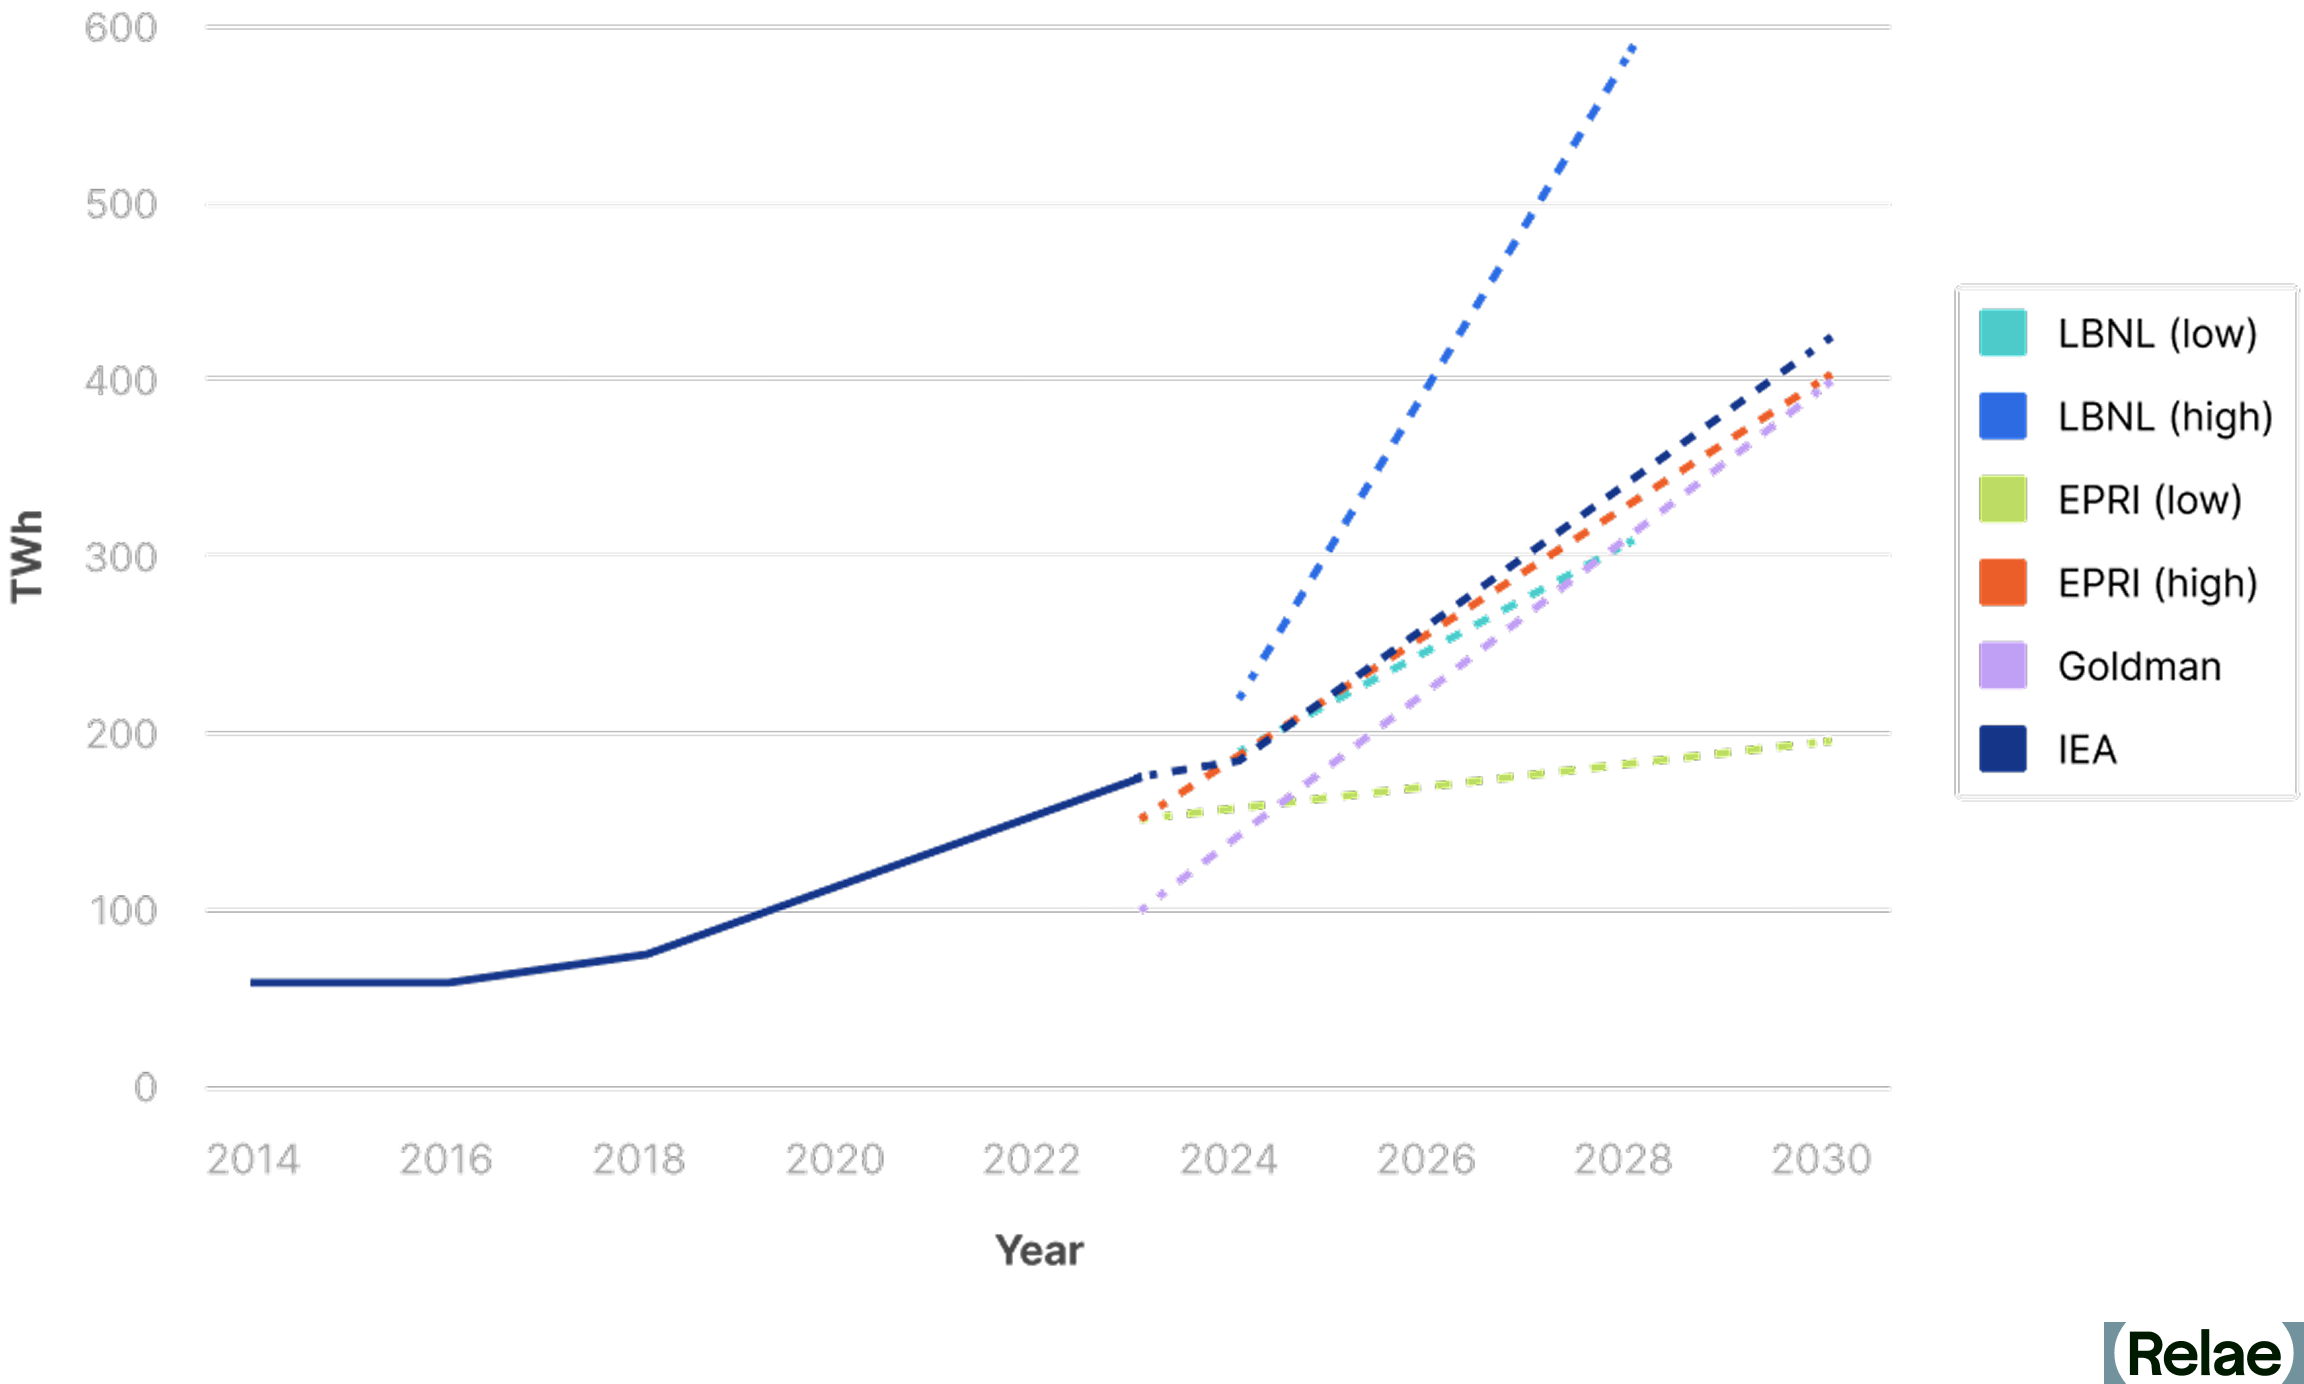
Meanwhile, new renewable projects face headwinds. Smith points to interconnection queue delays: "Solar and battery projects are taking three to five years from initial request to operation." At the same time, clean energy tax credits, which were driving wind and solar expansion, have been curtailed. New restrictions on foreign supply chain materials, which are critical to renewable project development, are further hampering the development of new clean electricity projects.
The result: Power demand is rising while new renewable electricity supply is getting throttled.
The Messy Reality of Electricity Emissions Accounting
Quantifying the emissions from an individual power plant is straightforward. Allocating those emissions to the companies that consume power is far more complicated.
Grid-supplied electricity comes from many generators that shift constantly, sometimes even second to second. Companies can’t directly measure emissions from a grid-connected load because the generators serving it continuously change.
Without direct measurement, companies need rules to estimate the emissions they are responsible for. The GHG Protocol’s Scope 2 Guidance provides that framework, establishing how companies estimate electricity-related emissions and how to reduce them through renewable energy purchases.
How Companies Currently Claim Renewable Energy
For the past decade, companies have used renewable energy purchases to achieve their scope 2 emission reduction goals. The most widely used mechanism is the REC, each representing clean energy attributes for one MWh of renewable electricity generated and added to the grid. Currently, when a company buys RECs equal to its annual electricity consumption, it can claim 100% renewable electricity. Under current rules, companies can use purchased renewable energy from anywhere in North America and apply it to any load in North America at any time during the year.
Importantly, emissions from different power grids vary widely across North America depending on time of day, time of year, and the power grid makeup.
This flexibility allows companies to match a REC from a clean grid against electricity consumption from a dirtier one, creating a potential mismatch between emissions claimed and actual emissions avoided. This gap has drawn scrutiny, contributing to the motivations for the scope 2 rules rewrite.
What's Changing in GHG Protocol Scope 2 Accounting?
On October 19, 2025, after years of consultation, the GHG Protocol released two separate proposals for public consultation:
1. Scope 2 changes: Moving away from annual REC matching to an ‘hourly and regional’ REC matching requirement.
2. New consequential methodology: A new approach to estimating emissions caused by a company’s consumption and avoided by its renewable energy contracts.
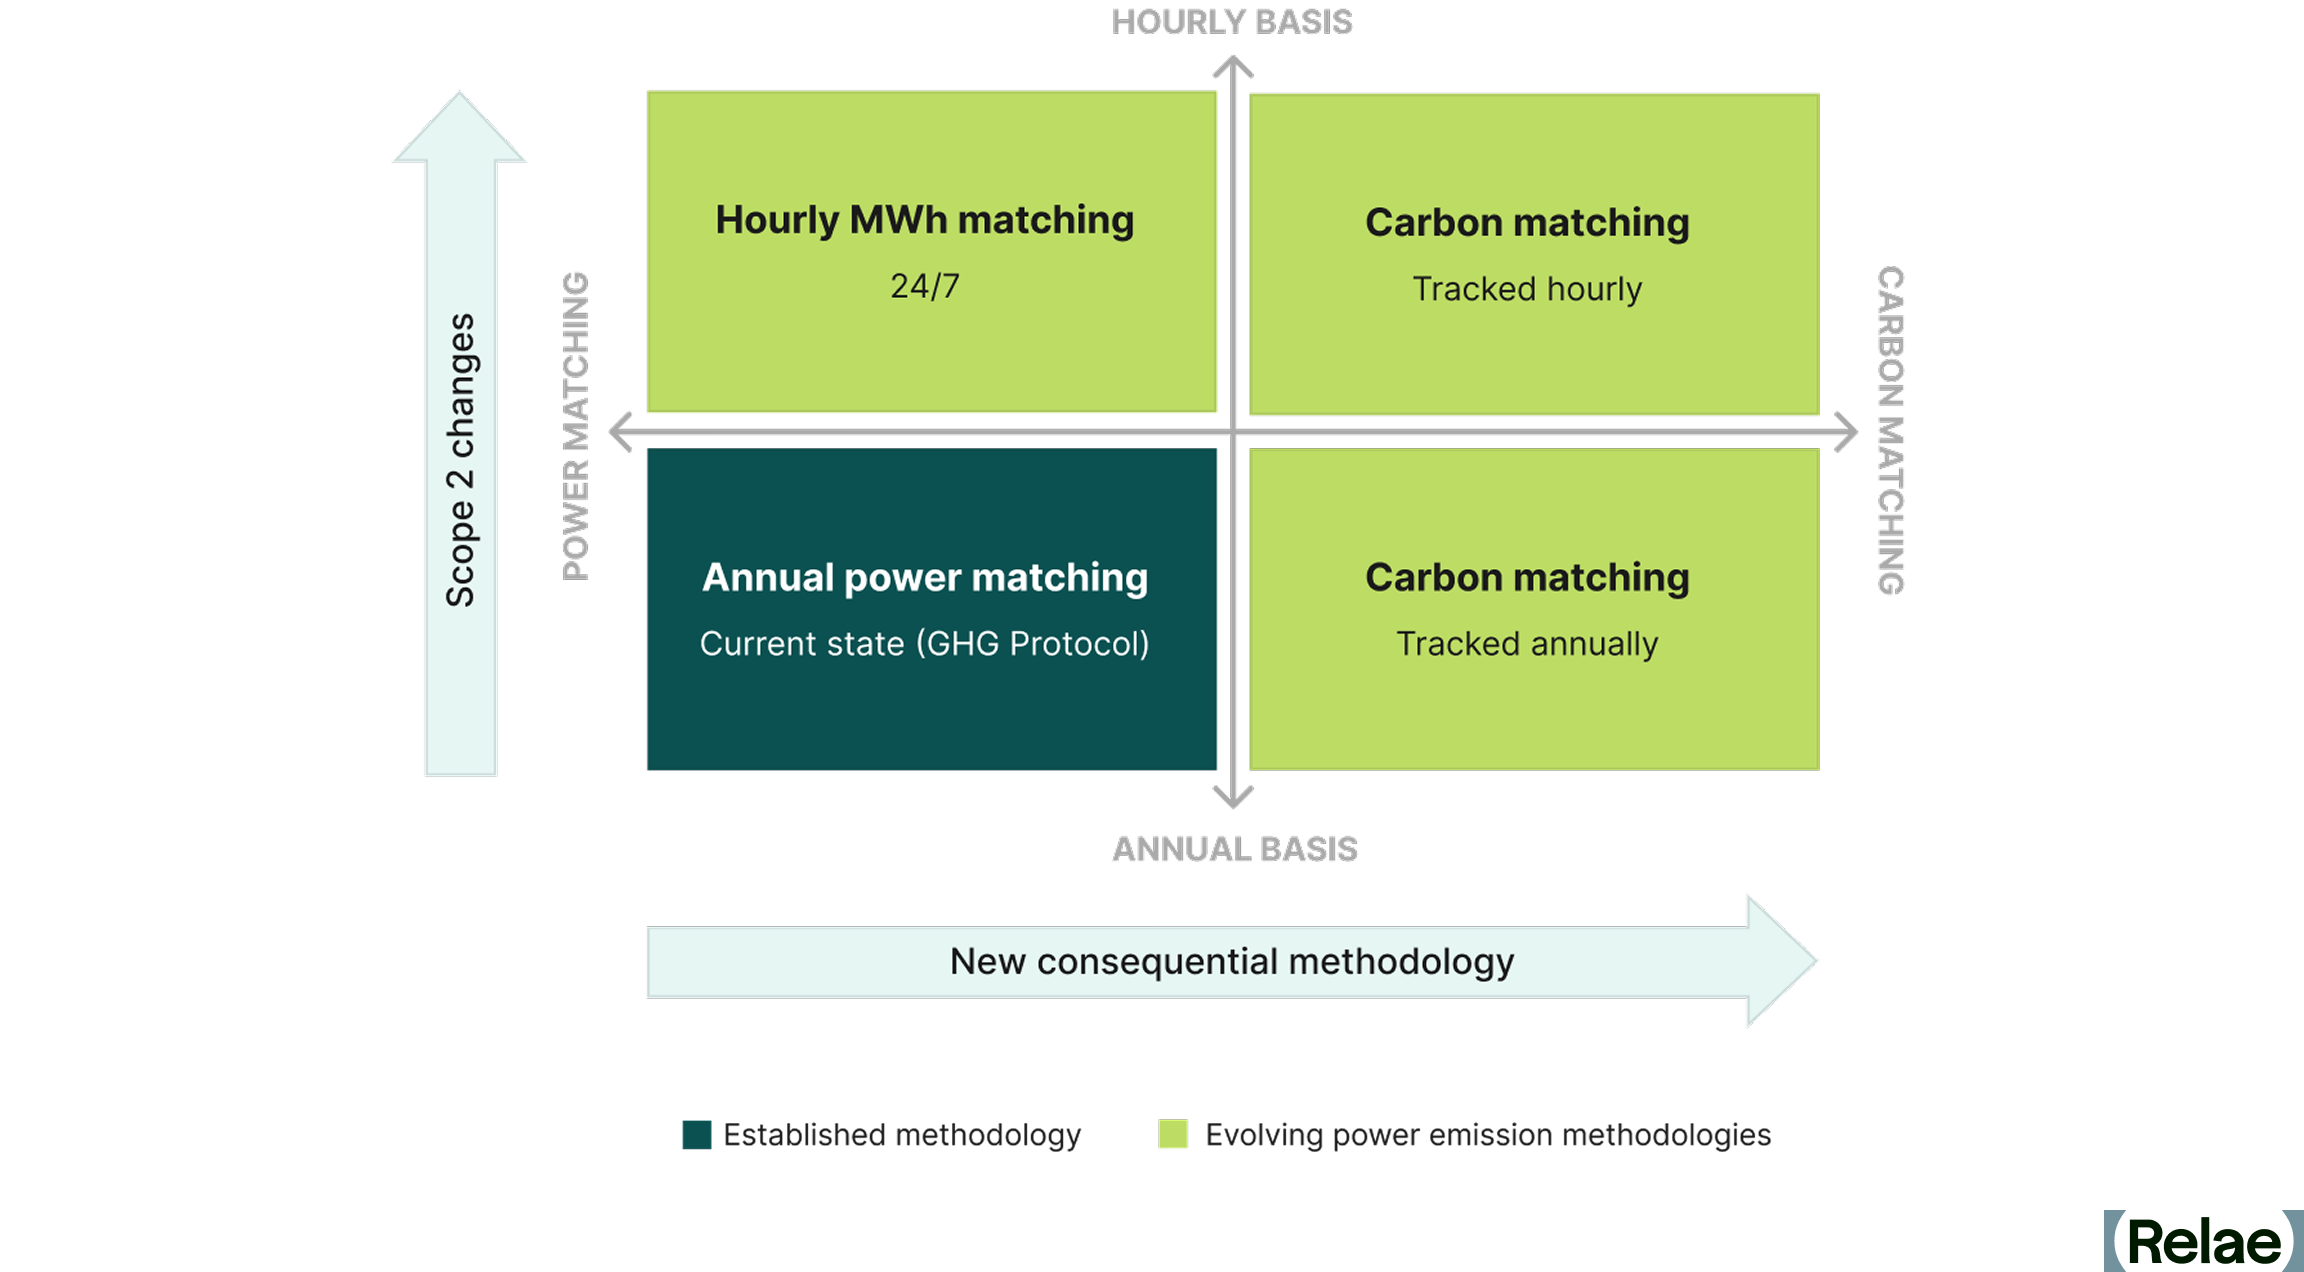
The hourly matching proposal (24/7): Companies would match RECs to consumption hour by hour within the same grid region, rather than annually across any North American grid.
"A REC generated on a Texas wind farm would not be able to be used for electricity consumed in New York," Millot explains.
The consequential approach: This proposes a carbon matching methodology, which estimates emissions caused by a load and estimates the emissions a renewable project displaces.
"Projects in the Carolinas are avoiding 0.6 or 0.7 tons of CO2 per megawatt hour, whereas a California project is probably closer to 0.2 or 0.3," Smith explains.
Projects in the Carolinas deliver more than double the climate impact per REC under the consequential rules. In this methodology, the load and generator do not need to be located in the same region.
While the proposed rules and new methodologies work through the public consultation process, it will be important for companies to start to anticipate the potential impacts on their climate goals and strategies.
Timeline for Scope 2 Accounting Changes
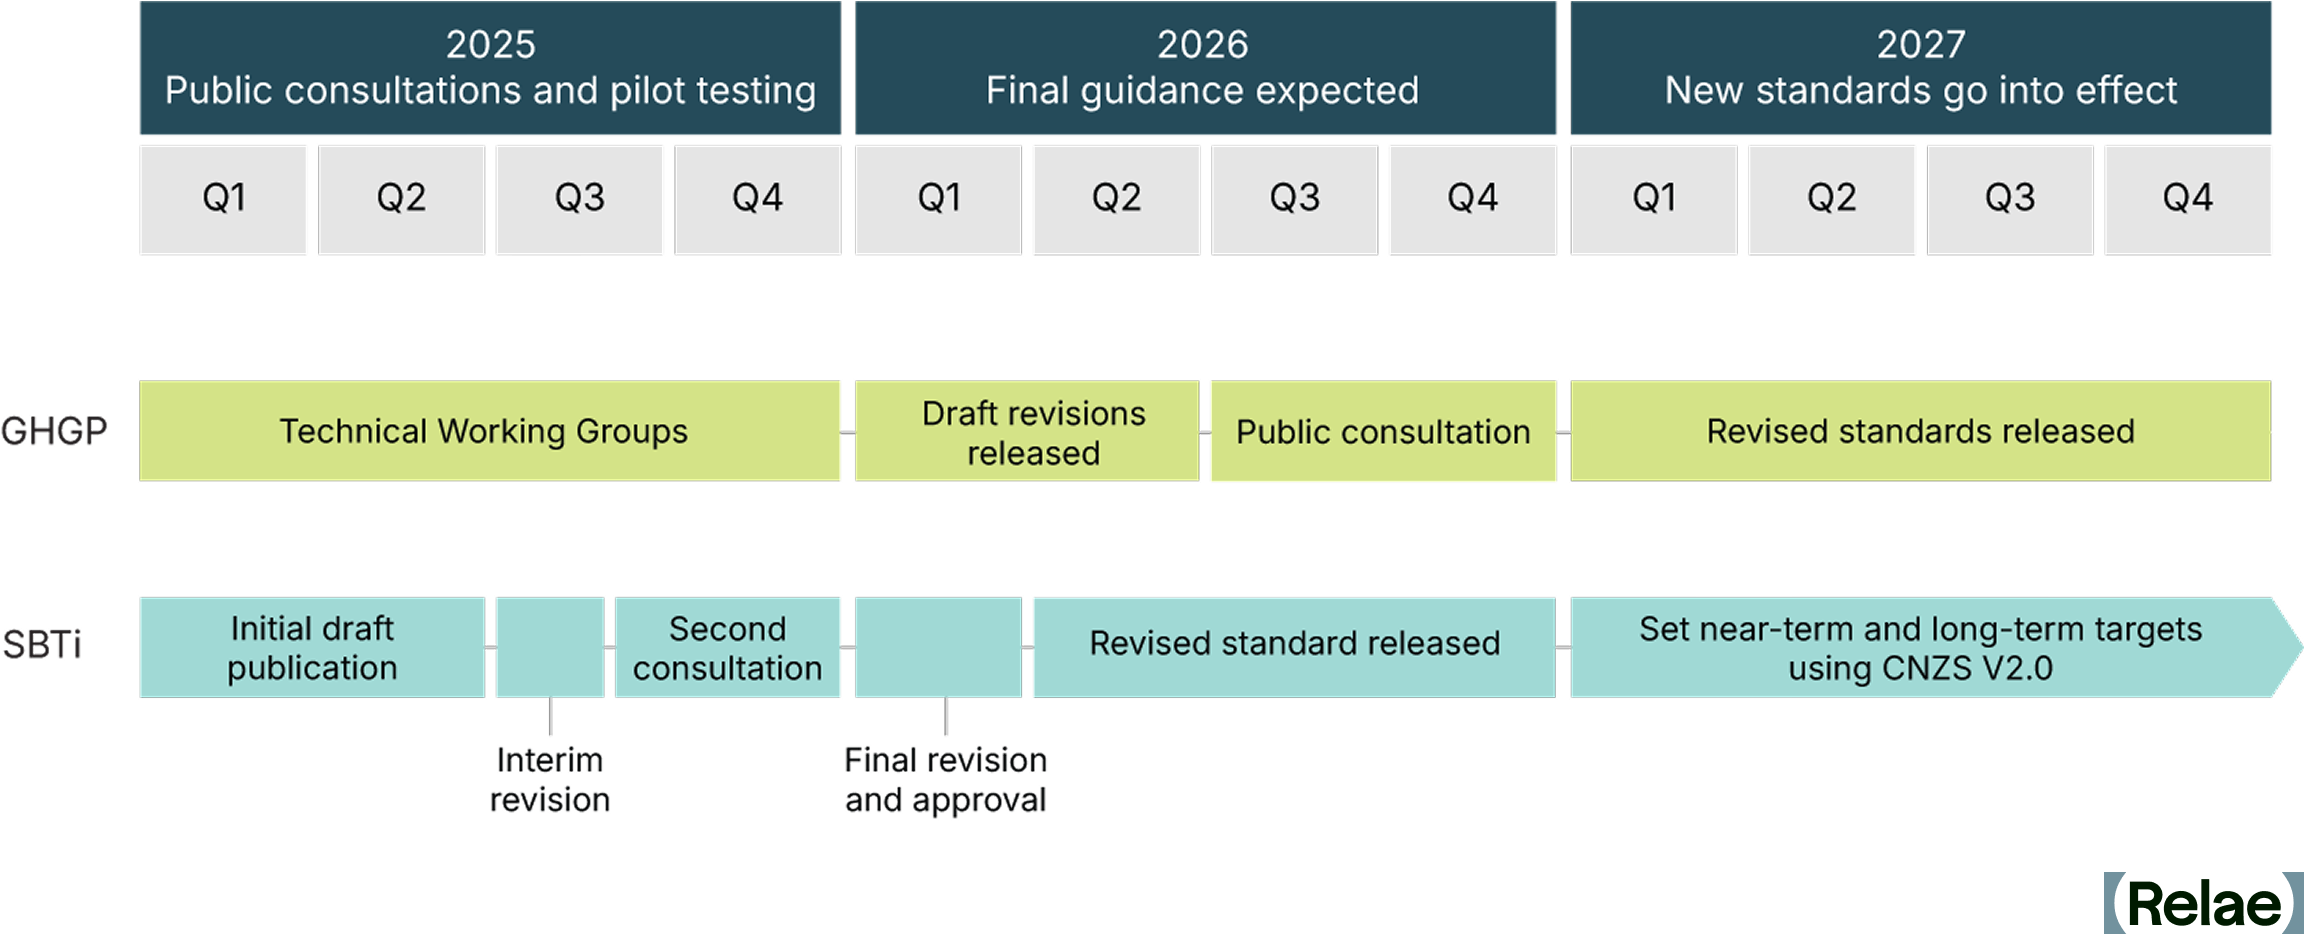
Both the Scope 2 and Consequential Electricity-Sector Emissions consultations closed January 31, 2026, after GHG Protocol extended the original deadline. The GHG Protocol is analyzing feedback with a second consultation and final standards expected by 2027, though the exact timeline is still being finalized.
Companies are encouraged to participate in the public consultation. The GHG Protocol is asking for comments on critical questions, such as:
- Should proposed rules apply to energy consumers of all sizes?
- Which geographical boundaries should be used for locational matching?
- Should existing contracts be grandfathered in?
The public consultation period is an opportunity to shape the standards that will govern electricity-related emission accounting for years to come.
Why Act Now Instead of Waiting
With final rules still in development, companies with scope 2 emission reduction goals or science-based targets face a decision: Wait for clarity or act now.
Several factors favor early action:
- Inclusion of legacy contracts. "There are a lot of indications from the committees that existing long-term contracts will be grandfathered in," Pearce notes. The draft considers a legacy clause that would allow organizations to apply pre-existing contractual agreements, even if they don’t comply with new rules.
- Throttled renewable project development. Interconnection delays for new renewable energy projects, elimination of clean energy tax credits by 2028, and limitations on foreign materials needed to develop renewable energy project components mean that new REC supply may be harder to access in future years.
- Renewable project development timelines. "There's generally a lag, sometimes six to 18 months" between contract signing and project operation, Pearce explains. That means even if you sign today, the RECs won’t be generated for up to 18 months from the signing date.
- High-impact opportunity. Through careful project selection, renewable energy investment can go beyond the annual energy match requirement and incorporate additional impactful metrics, such as higher avoided emissions and positive social impacts.
Renewable Energy Buying Options for Companies
Previously, companies have been able to buy renewable energy through the following three paths; however, they all come with their own tradeoffs.
Traditional REC Buying Options
- REC spot markets make up most corporate renewable procurement. However, they mainly come from existing projects rather than financing new development, which is critical to expanding renewable energy supply to meet rising decarbonization needs.
- Virtual power purchase agreements (VPPAs) are highly impactful but require large power loads and the ability to manage long-term financial risks. Unavailable to most companies.
- Utility green tariffs have limited availability throughout the US (depending on the utility(s) that serve your load) and vary in quality.
Alternative REC Procurement Approach
For companies that want to go beyond the REC spot market and are not large enough to pursue a VPPA, there’s an alternative procurement option available: a high-impact forward REC contract. These multi-year contracts commit to purchasing RECs from specific new projects before they're built, providing the upfront revenue certainty developers need to secure financing at a fraction of the scale and complexity of a VPPA.
Comparing Renewable Energy Procurement Options
The Path Forward
Despite rapidly increasing grid demand, renewable project headwinds, and changing accounting rules, companies can still meet 2030 scope 2 goals.
What companies should do now:
- Watch for the next round of GHG Protocol consultation on Scope 2 revisions
- Evaluate forward REC contracts to lock in terms before rule changes
- Prioritize high-impact RECs that deliver measurable climate and social benefits
Data Centers and Their Energy Use: Trends in State Capitals
This article was originally published in collaboration with the Center on Global Energy Policy at Columbia University as part of its Energy Explained series.
Key Takeaways
- Attention to data centers is skyrocketing in state capitals across the United States.
- In data center bills passed by state legislatures in 2025, two topics dominated: locational incentives (such as reduced sales taxes) and ratepayer protection. Many bills addressing data centers' water use and environmental risks were proposed, but few were enacted.
- Almost all the enacted bills encouraging data centers to locate in a state were passed by Republican legislatures, and more bills addressing data centers' environmental risks were proposed in Democratic legislatures than Republican legislatures. Concern about the impacts of data centers on power prices was bipartisan.
Introduction
From east to west and north to south, in red states and blue states, attention to data centers is skyrocketing in state capitals across the United States. Our research identified more than 190 bills on data centers introduced in state legislatures in the first 11 months of 2025—roughly nine times the number of such bills introduced in 2024. The bills address a wide range of topics, including economic development, ratepayer protection, grid reliability, and disclosure of data centers' energy use and environmental impacts. More than two dozen of these bills were enacted into law.
This newfound interest in data centers in state capitals is unlikely to abate anytime soon. The data center industry is growing at a staggering pace. A recent McKinsey report projected roughly $2.8 trillion in spending on data center infrastructure in the US by 2030. In 2024, data centers used roughly 4–5% of the electricity produced in the United States—a percentage projected to grow sharply in the years ahead. A rapid buildout of data centers and electricity infrastructure to support them offers economic and strategic benefits but also creates risks for ratepayers, water resources and the environment.
State policymakers are on the front lines of these issues. State governments promote economic development, regulate electricity rates and have jurisdiction over many local resource and environmental issues. Different stakeholders have strongly conflicting views on data centers, setting up high-profile debates in state capitals as well as in Washington, DC.
This blog post—the first entry in a project that will explore state data center policies, power prices and related topics—presents these findings.
Methodology: Tracking Data Center Legislation
We (the authors of this article) queried StateNet's database of state legislation to identify bills proposed between January 1 and November 30, 2025 that used several terms including "data center" and "large load." After removing bills that used those terms but addressed different issues, we categorized the remaining bills into topic areas (including tax incentives, ratepayer protection, zoning and siting, disclosure requirements, environmental protections, labor, water resources, clean energy, and research studies) as well as status (enacted, pending, rejected, and passed but vetoed). We supplemented this research with queries to ChatGPT and Gemini to help identify possible gaps in the StateNet review, double-checking links provided by those large language models to ensure the information provided was accurate.
Almost all state legislatures have now adjourned for the year. (Only six state legislatures remain in session in December.) Trends with respect to state legislative activity on data centers in the first 11 months of 2025 included the following.
Eight Key Data Center Trends From State Legislative Activity in 2025
1. One of the most common objectives of state bills related to data centers was to encourage those facilities to locate in a state.
- Roughly 50 bills were introduced in state legislatures offering data centers tax incentives or other benefits.
- Of the more than two dozen bills on data centers enacted by state legislatures, at least nine provided tax incentives or other inducements for siting decisions. Arkansas, Kansas, Kentucky and Minnesota, among other states, all extended or increased sales or use tax exemptions for data centers. Indiana and West Virginia, among others, established favorable zoning and fast-track permitting procedures to facilitate data center construction.
2. State legislatures are paying growing attention to the impact of data centers on power prices. Ratepayer protection and tariff rate issues were among the most popular topics for state legislation on data centers. More than 40 such bills were proposed and at least six such bills passed. Those included:
- Minnesota HF 16, which requires new large grid customers (including data centers), as a group, to cover all their grid costs;
- Texas SB 6, which requires the Texas Public Utility Commission "to support business development in this state while minimizing the potential for stranded infrastructure costs;" and
- New Jersey A5466 and California SB 57, both of which require the state PUC to study within one year the effect of data centers on electricity costs.
3. Many bills related to the environmental impacts of data centers were introduced in state legislatures, including approximately 30 bills related to water consumption. Only a few of these bills were enacted. Minnesota HF 16, for example, requires close attention to water use in permitting new data centers. Kansas SB 98 makes tax credits for data centers contingent on practices that will "conserve, reuse and replace water."
4. Approximately 40 bills were introduced requiring data centers to disclose their energy use and/or environmental impacts to state authorities, with roughly a dozen bills requiring disclosure to the public. Details regarding metrics and anonymization of reports varied widely. At least three of these disclosure-related bills were enacted, including the following.
- Texas SB 6 requires interconnection applicants to disclose whether they are pursuing other interconnection applications in the state as well as information on onsite back-up generating facilities.
- Minnesota HF 16 requires data centers to disclose information on water consumption volumes.
- Iowa HB 976 requires data centers to submit an annual report to the Department of Revenue detailing the amount of backup power generation fuel and electricity purchased.
5. Several states passed bills limiting tax benefits for data centers.
Iowa limited sales tax exemptions for new data centers to 10 or 15 years (depending on their size), and Florida raised the minimum size for data centers receiving sales tax exemptions from 15 megawatts (MW) to 100 MW.
6. Texas became the first state in the nation to pass a bill requiring data center operators to enable remote disconnections for use during grid emergencies (referred to as a "kill switch provision").
7. There is little consistency in the legislative text of state bills on data centers.
- Definitions of data centers, thresholds for incentives, and regulations related to disclosure, zoning, siting, environmental impact mitigation and ratepayer protection vary significantly.
- This may be the expected product of variance among state-level policy regimes, and suggests the absence of close coordination among state legislatures or stakeholder groups.
8. The pattern of proposed and enacted bills displayed some partisan patterns.
Almost all the enacted bills encouraging data centers to locate in a state were passed by Republican legislatures. More bills addressing environmental risks from data centers were proposed in Democratic legislatures than Republican legislatures. However bills concerning the impacts of data centers on other ratepayers were enacted in states with Democratic legislatures and governors (including California, New Jersey and Oregon), Republican legislatures and governors (including Texas and Utah) and in which the legislature is controlled by one party and the governor another (including Kansas).
Data centers will be a hot topic as many state legislatures reconvene in January. The Executive Order on state AI laws released by the White House December 11 2025 does not seek to preempt state laws related to data centers (see in particular Section 8b), however questions related to the optimal role of state governments and the federal government on AI and data centers will likely be prominent as well.
Dynamic Line Rating: The Fastest Gigawatt Is the One You Already Have
Key Takeaways
- Power demand is outrunning buildout. Meeting large load growth requires more than new generation; it requires faster interconnection and congestion relief on existing transmission lines.
- Dynamic line rating (DLR) is available today, deploys in months, and enables faster speed-to-power. On the right thermally congested lines, DLR can unlock more capacity at a fraction of new infrastructure cost. In one utility demonstration, 5% to 10% of additional capacity was enough to clear most of the congestion on the lines studied.
- DLR has been held back by weak incentives, but that is changing. Utilities earn a regulated return on capital they invest in new assets, which favors building new infrastructure over lower-cost solutions like DLR. Load growth and new Federal Energy Regulatory Commission (FERC) mandates are starting to shift the calculus.
The Grid Cannot Expand Fast Enough for AI Demand, But It Can Carry More
Power demand is booming as data centers scale across the US grid, and current grid infrastructure cannot supply it. This constraint is physical, not financial. Meeting this demand requires a significant amount of power generation and infrastructure upgrades. More than 2 terawatts of generation and storage sit in interconnection queues, roughly 1.5x the total installed generation capacity in the US.
Regional markets are working to accelerate generation buildouts, but connecting that generation to the transmission network remains expensive and slow to match speed-to-power needs. New high-voltage lines take years to permit, cost between $2 million and $6 million per mile to build, and major projects routinely take five to ten years from identification to energization. For example, PJM Interconnection LLC (PJM) identified the Doubs–Goose Creek 500 kilovolt (kV) corridor as a bottleneck feeding Data Center Alley in 2023 and set June 2027 as the date a fix was needed. Dominion Energy's published schedule for its portion of that rebuild anticipates a completion date of 2031.
A number of studies1,2 show there is headroom in the bulk transmission system. Grid-enhancing technologies, such as dynamic line rating (DLR), can convert part of that headroom into capacity today while new generation and transmission are being built. DLR lets suitable transmission lines increase their carrying capacity in real time, unlocking that headroom at a fraction of the cost of a buildout. Realizing that value is a targeting exercise with a key question: On which thermally limited lines can DLR actually relieve congestion?
What Is Dynamic Line Rating?
Dynamic line rating is a method for calculating a transmission line's real-time carrying capacity using live weather and conductor-temperature data. It lets grid operators safely carry more power whenever weather conditions allow.
Most transmission lines operate under a static rating: a fixed, conservative limit on current, set for worst-case weather and held all year. The limit is based on temperature, because pushing too much current can overheat the conductor wire. Metal conductors expand as they heat, which can make them sag and touch trees or other obstacles, causing short circuits or fires. Real conditions almost always cool a conductor better than the worst-case assumption a static rating is built on. That means the line can carry more current while staying at the same maximum conductor temperature, and therefore within the same sag and clearance envelope. That headroom is exactly what DLR captures: instead of leaving it on the table, DLR recalculates the line's rating in real time so operators can use the extra capacity safely.
Beyond a static rating is the ambient-adjusted rating (AAR), which many utilities have begun adopting. An AAR recalculates the rating from forecast ambient air temperature, typically hourly and out to several days. DLR goes further, adding wind speed and direction, solar heating, and in some deployments the conductor's measured temperature.
DLR technologies rest on a heat-balance algorithm: how fast a line heats up (from electric current and sunshine) versus how fast it cools off (from wind and cold air). The calculations are standardized in IEEE 738 in North America and CIGRE 601 internationally. The data feeding those calculations can come from line-mounted sensors, weather models, or both, depending on a tradeoff between per-span accuracy and the cost of installing sensors along every span.
Even so, DLR remains limited in the US, and AAR has been slow to arrive. FERC's Order 881 required the transmission providers it regulates to adopt AAR by July 2025, but FERC has granted numerous extensions. PJM became the first to fully implement AAR in March 2026, while Midcontinent Independent System Operator (MISO) and New York Independent System Operator (NYISO) are not expected until 2028.
The Near-Term Value of DLR: Reducing Grid Congestion
DLR's value is immediate. It can be installed in months, not years, so a currently congested line can start carrying more power the moment conditions allow, reducing congestion right away. When cheaper generation is available upstream of that line, DLR cuts costs directly, because grid operators no longer need to dispatch pricier generation downstream of the congestion to supply load. That means DLR can reduce congestion costs in the current delivery year, compared to a transmission line rebuild that sits in a decade-long queue.
Over a longer horizon, utility planners can build that headroom into long-term capacity models. This is important, because current capacity-expansion and integrated resource plan (IRP) models still run on static or seasonal ratings, and typically leave out the potential gains from grid-enhancing technologies like DLR.
NERC's large loads white paper and FERC's RM26-4 rulemaking both raise the issue of how utilities can absorb multi-hundred-megawatt data center requests without a decade-long transmission build. Solutions like DLR are one of the few tools that can compress that timeline.
The hardware itself is cheap: sensors and data management cost a small fraction of any physical upgrade. That means the economics comes down to identifying the lines that benefit most from DLR. This is particularly important because on most US grids, congestion concentrates on a small number of lines that repeatedly reach their limits. On those lines, DLR can cut congestion costs directly and defer costlier upgrades, while its potential on other lines may be far lower. As a result, identifying those high-potential, thermally congested lines is essential.
Proven DLR Examples in the Industry
Real deployments show DLR can reduce a meaningful share of transmission congestion costs, with extra carrying capacity above the static rating running roughly 5% to 30%, depending on how often that capacity is available. In Oncor's ERCOT demonstration, 5% of additional capacity would have relieved up to 60% of congestion on the target lines, and 10% would have practically eliminated it. PPL Electric in Pennsylvania/PJM reports annual customer savings of $23 million after deploying DLR across its initial three lines. The DLR installation cost about $250,000, against a rebuild alternative that would have cost about $50 million and taken far longer.
The contrast abroad is instructive. Austria's grid operator, APG, recorded about $13 million a year in congestion savings across roughly 15% of its network. While these savings are real, it's important to recognize that these results come from single, well-chosen, badly congested lines.
The UK's National Grid began with a two-year DLR trial on a single 275 kV circuit in 2022, expanded to more than 275 kilometers of its network by 2025, with estimated consumer savings of about $26 million a year. In April 2026, National Grid signed a five-year contract covering 585 kilometers more, with most installations due by 2028 and potential savings of up to $66 million. Each expansion followed measured results from the stage before it.
Where the Headroom Is: Screening PJM's Data Center Alley
To illustrate the congestion savings from DLR, Relae screened PJM's five-minute real-time market record for every binding transmission constraint in 2025. For each one, we captured the shadow price, the marginal value of relaxing that constraint.3
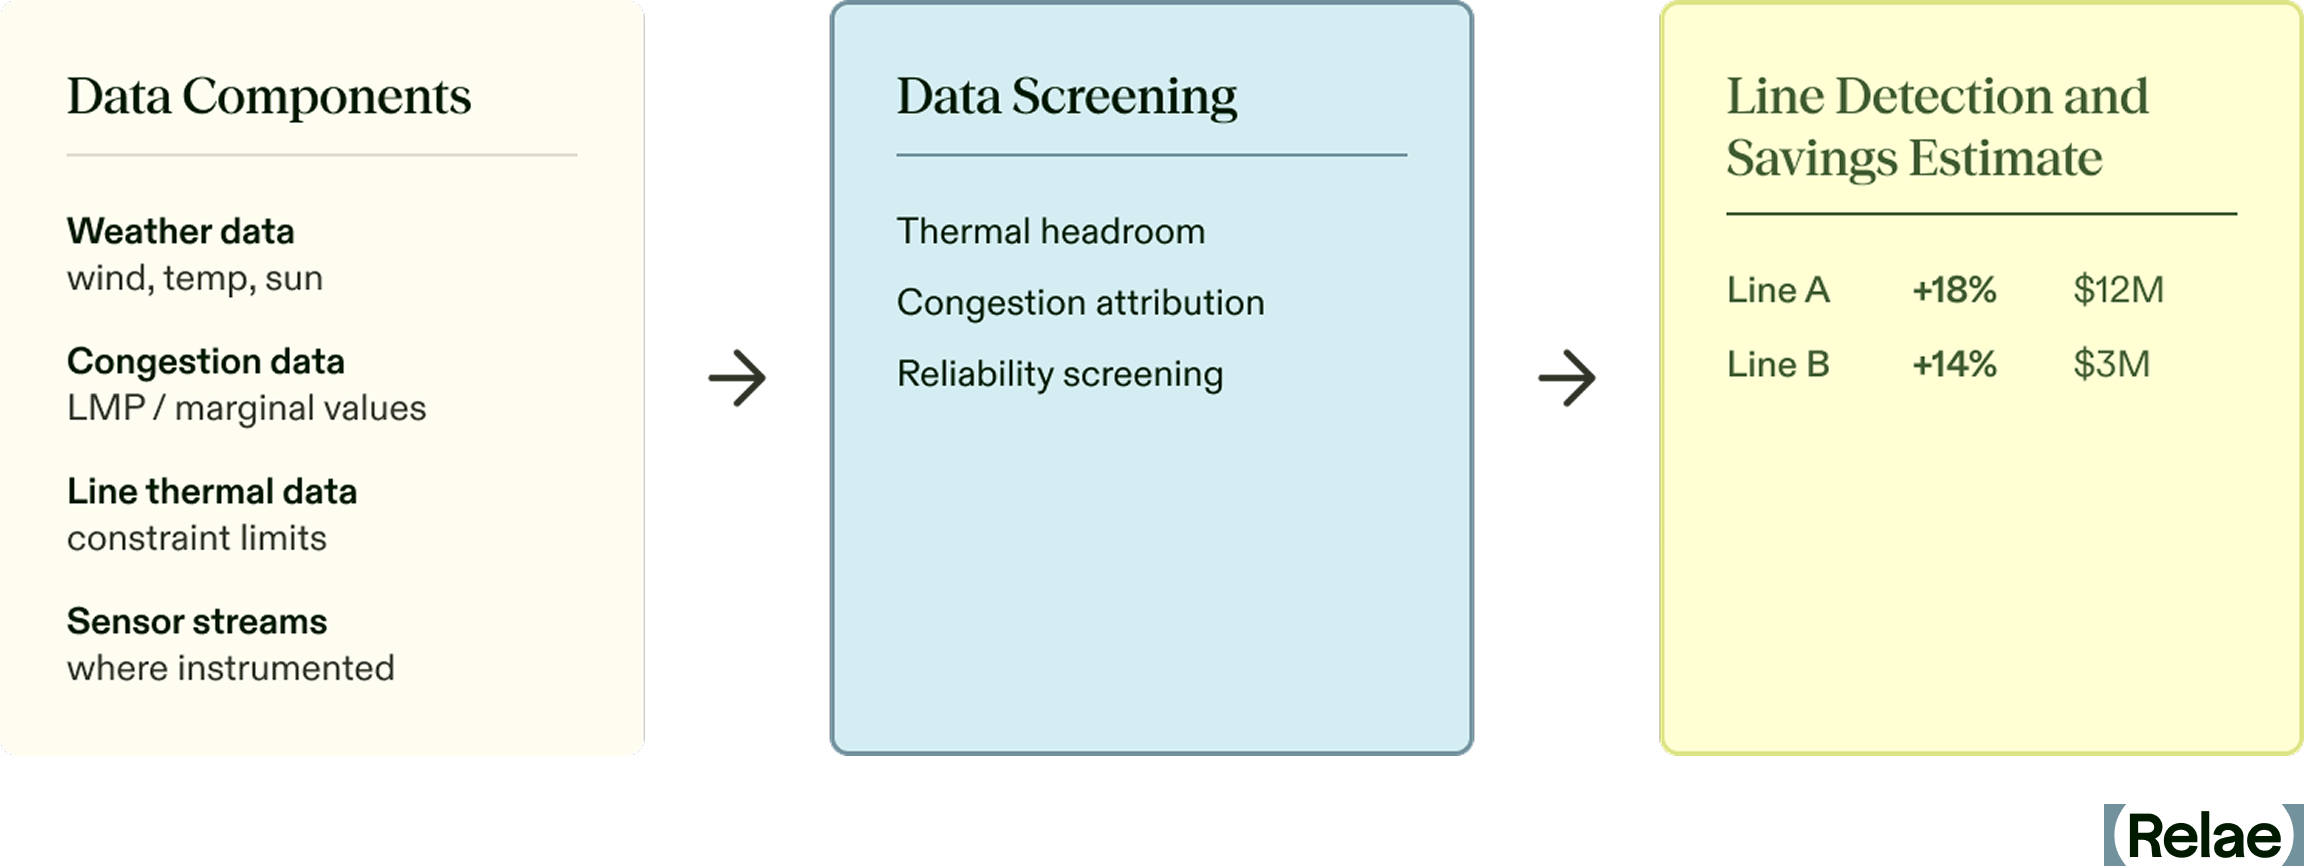
Our analysis focused on thermal constraints, and then identified lines that bind frequently, in conditions milder than the worst case their static rating was set for, which is when a conductor's true rating sits above its static assumption. For the lines that we identified, congestion costs were added over the binding hours to set a bound on the savings that could result from DLR. That full amount would not necessarily be realized in practice, because the shadow price values only the next megawatt freed, and relieving one line can shift the constraint to the next. However, it serves as a useful estimate for the scale of savings that could be achieved.
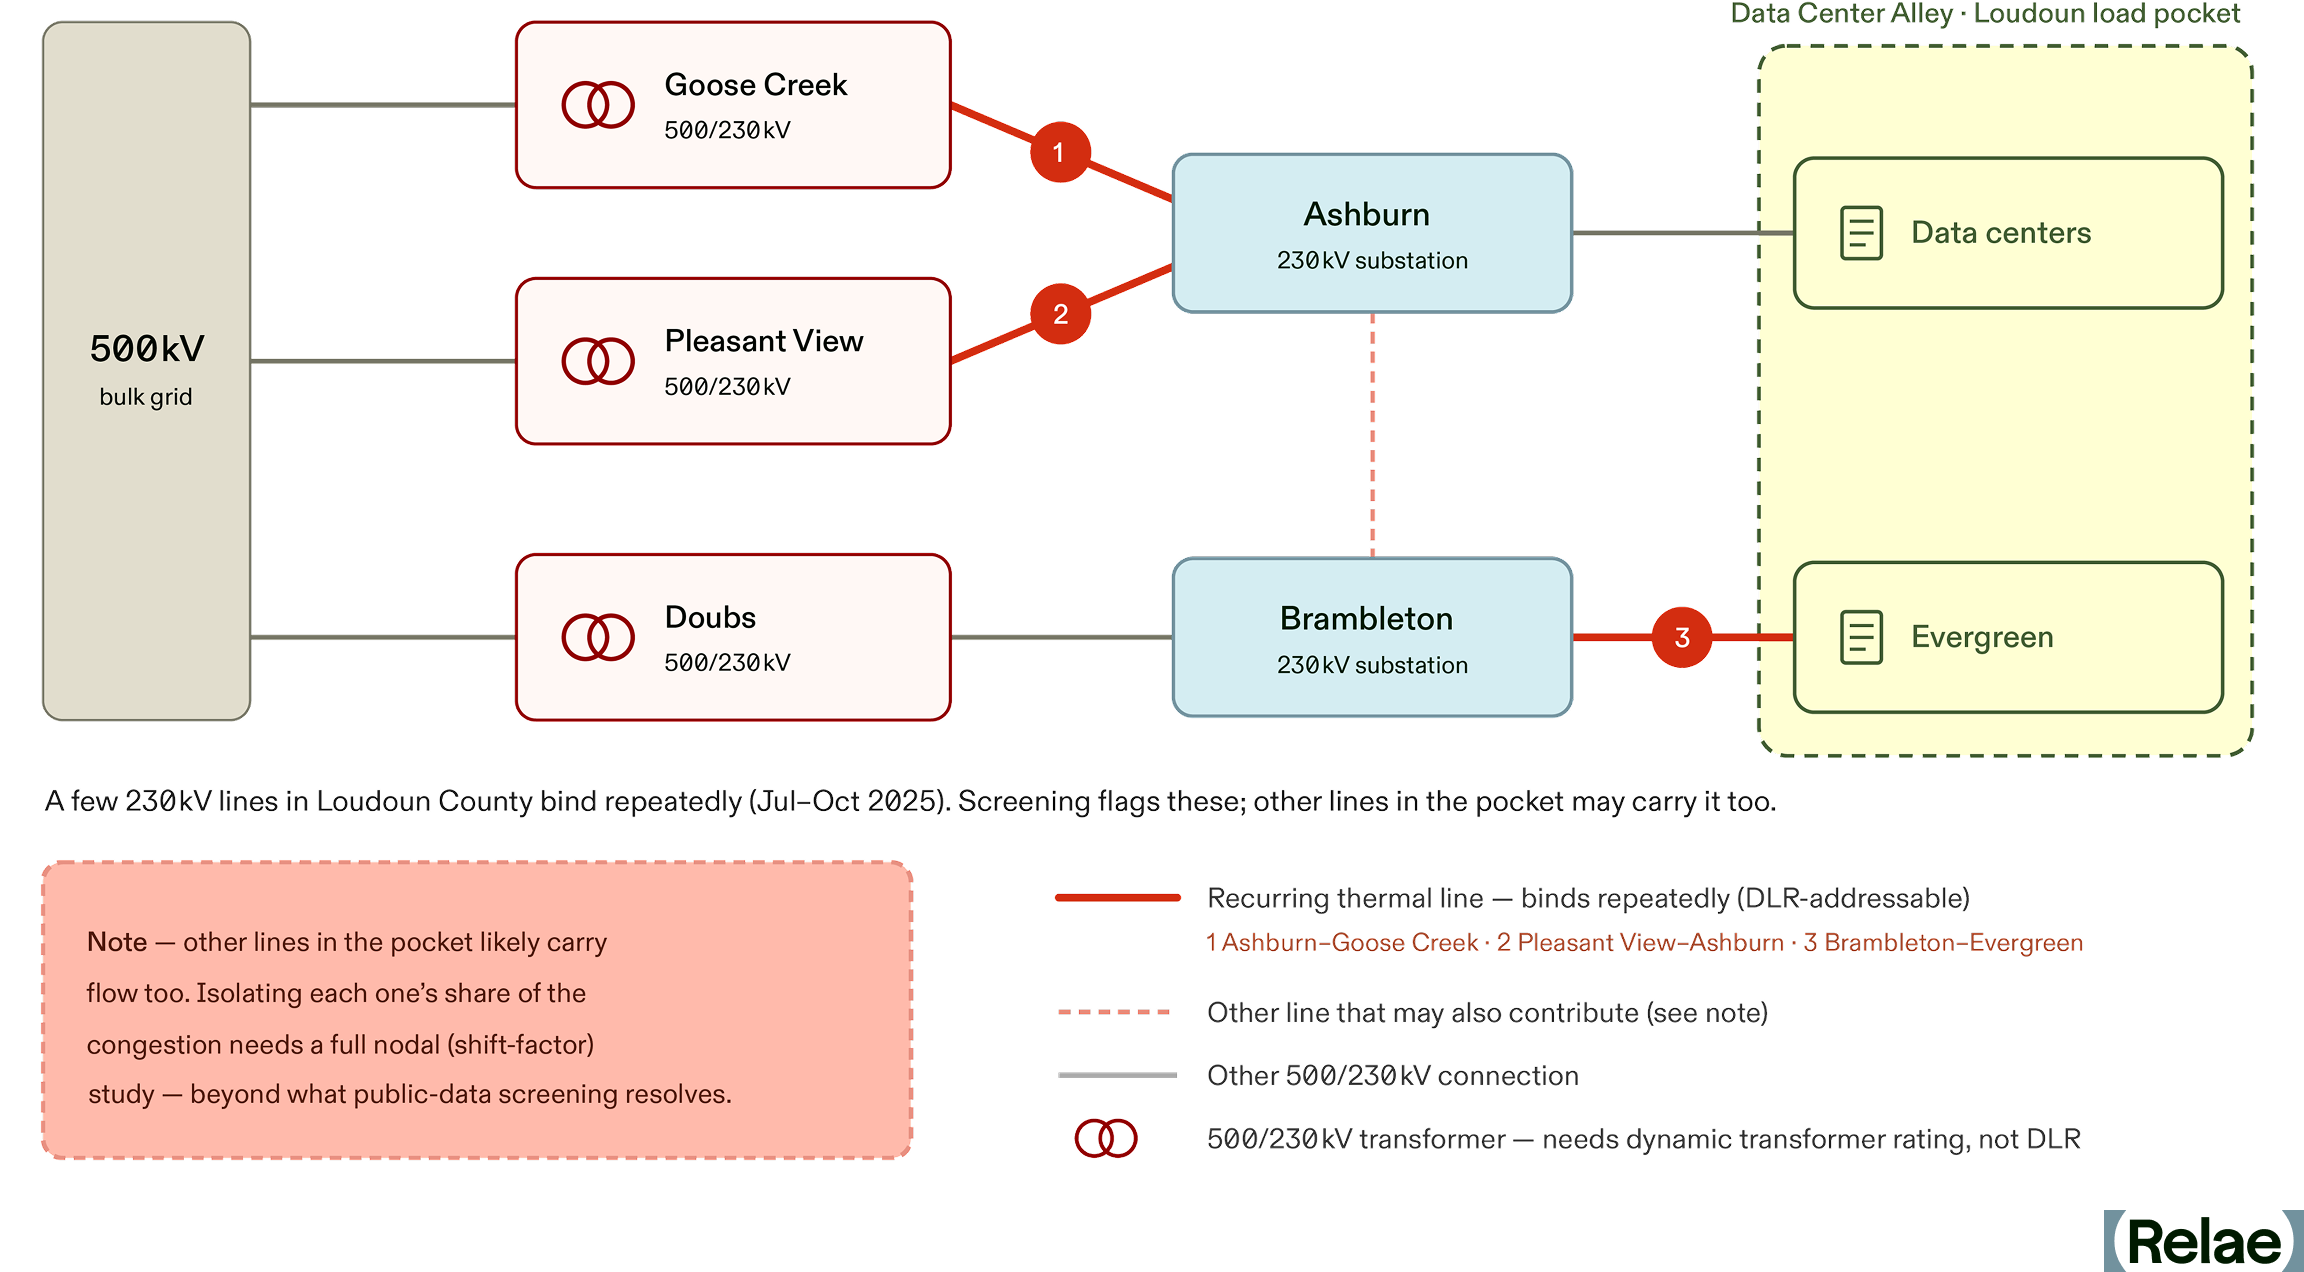
We ran the analysis on the Dominion (DOM) zone in PJM, home to Data Center Alley in Loudoun County, Virginia. Figure 2 shows a high-level section of the grid. The 500 kV bulk grid steps down through transformers to the 230 kV substations feeding the data centers, with the lines that experience recurring congestion highlighted. A handful of those 230 kV lines showed up as binding thermal constraints again and again.
The congestion in DOM isn't constant, and it concentrates in particular months and within the day in particular hours. Figure 3 shows three transmission lines within the DOM zone and the number of hours each was thermally congested in each hour-of-day slot over 2025. Binding concentrates in the warm months and, within the day, from late morning through early evening.
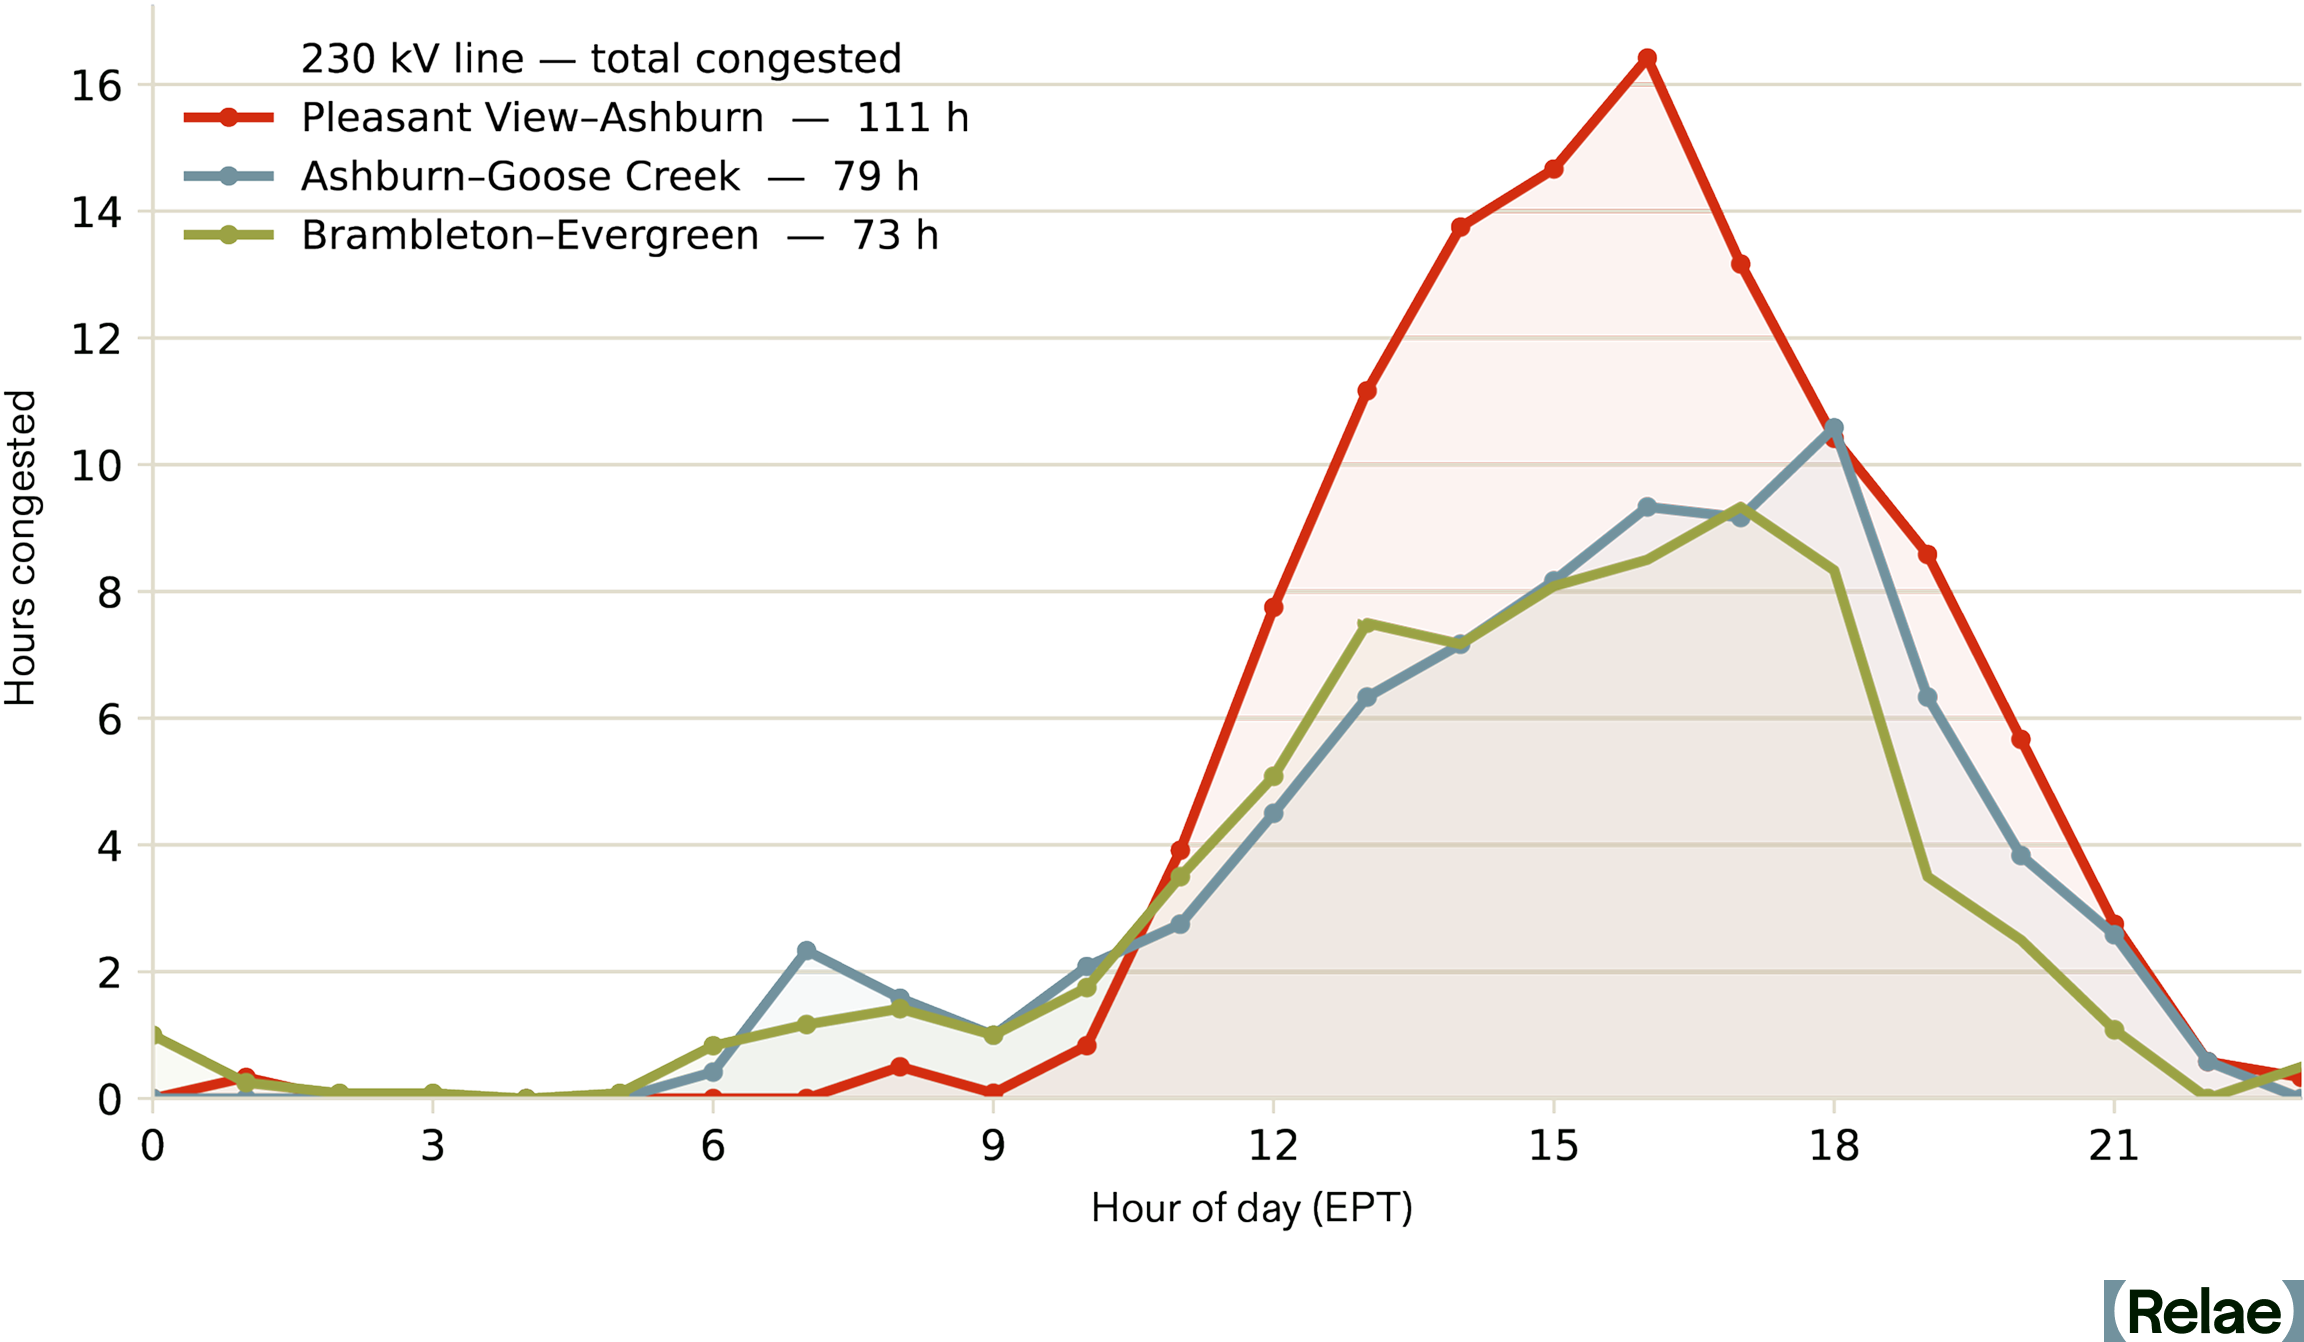
At first glance, this period looks like the wrong window for DLR. The local weather record says otherwise. These periods turn out to be some of the windiest hours of the day, not the stillest. Median wind speed at Dulles ran about 3.5 m/s, above the 0.6 m/s crossflow a static rating conventionally assumes, with fewer than 5% of observations falling below that threshold. Median ambient temperature in those hours was about 26°C, against the 35–40°C a static summer rating is typically built for. Across all three lines, the large majority of congested hours coincided with weather that would have supported a materially higher rating.
Valuing just one megawatt of DLR relief at each five-minute shadow price, the estimated savings are worth roughly $300,000 in this three-line example across about 263 line-hours.4
Because the value concentrates on a handful of thermally limited, heavily congested lines, and because the operational case has to be made line by line, capturing the opportunity is fundamentally an analytics problem: find the right lines, and prove the savings.

What Does It Take to Scale DLR?
DLR is cheap and effective, but two things stand between it and broader adoption: incentives and advanced grid analytics.
The utility cost-of-service model recovers investment in generation and transmission assets and earns its profit as a regulated return on the capital deployed. Because rates recover capital rather than power delivered, utilities have a stronger incentive to build or upgrade lines than to move more power across the ones they already own. That bias toward capital investment over optimization is why a mature technology has stayed niche in the US for years. Regulators have started to look more closely at this, but the main federal rule still mandates the milder AAR, not DLR, and leaves the return model untouched.
Contingency analysis compounds the problem. Current models are built around fixed line limits. A rating that changes hour to hour adds real modeling work, and more importantly, the system still has to hold under worst-case contingencies. So while operators already forecast weather daily for wind and solar, the harder step is trusting a forecast enough to commit a transmission limit against it. That takes significant predictive analytics built into system planning, not bolted on after.5
How Policy Is Starting to Shift the Calculus
Policy is starting to move the incentive problem. FERC's Order 881 made AAR the minimum for the transmission providers it regulates (effective July 2025, with several operators on extended timelines) and required markets to be capable of accepting dynamic ratings. PJM has started to implement this: PPL Electric has run sensor-based DLR on nine congested lines since 2022, feeding PJM's day-ahead markets.
Order 1920, FERC's first long-term transmission-planning overhaul in more than a decade, now requires planners to formally evaluate grid-enhancing technologies like DLR against conventional builds. It stops short of mandating deployment, but it forces a comparison utilities used to skip. That comparison is now written into filed tariff processes (PJM filed its plan in December 2025). Those first cycles only began in 2026, and the order allows up to three years to reach a selection, so the results are still pending.
A shared-savings incentive, letting a utility keep a slice of the congestion savings it creates, has been proposed to FERC and championed in the Advancing GETs Act, but it isn't yet a rule, so the core misalignment stands. DOE's GRIP program has funded grid-enhancing deployments, and by early 2026, 16 states had some form of advanced transmission technology requirement, with Colorado adding its Grid Optimization Act in April 2026.
The newest pressure is coming from the demand side. Through 2025–26, FERC began overhauling how large loads connect to the grid, and while none of it touches the utility's return on capital, it changes who sees the costs. FERC issued show-cause orders directing all six grid operators to justify or reform their large-load rules. This tees up consideration of alternative transmission technologies in study processes and greater transparency into costs.
And the rules are moving toward making the large load pay for the upgrades its connection requires. Pennsylvania's model large-load tariff, for example, recommends utilities charge data centers for the upgrades their interconnection makes necessary. It also instructs utilities to let those customers self-construct certain upgrades, including some affecting the wider grid. That combination is what matters. The party paying the bill now has a reason to ask whether a cheaper fix exists and, in at least one state, a route to build it. We have not yet seen a DLR deployment selected this way, because these frameworks are only months old, but the cost gap between a DLR fix and a rebuild is becoming visible to the party who pays the difference.
How Relae Helps Find the Value of DLR
Through our Power, Data, and Innovation practice, Relae combines transmission congestion data, line-level thermal constraints, and short-term weather forecasts into a single view of where dynamic ratings would actually pay. The output is a short list of candidate lines, each with a modeled capacity uplift and an estimated dollar value, turning a vague “DLR is promising” into a priced, line-by-line decision. It is the transmission-side complement to our work on the interconnection queue and demand-side flexibility. All three are ways of closing the gap between demand and delivered capacity faster than new construction allows.
How to Fix Load Forecasting for the AI Era
Key Takeaways
- Accurate load forecasting is needed to distinguish and prioritize real demand, align capital deployment, and reduce delays in bringing new power capacity online. Traditional load forecasting was built for predictable, gradual demand growth, not for the scale, uncertainty, and dynamic behavior of data centers.
- The system-level fix to data-center load forecasting requires probabilistic, more frequent, category-specific methods paired with mandatory data standards and policy alignment. Together, these give planners visibility into the range of possible futures and the likelihood of each.
- Without that fix, today's forecasts conflate real demand with speculative submissions, reducing accuracy. Inaccurate forecasting in either direction is expensive: underbuild adds friction to economic development; overbuild risks raising retail rates. Both can erode public trust in planning.
- Behind-the-meter generation (BTM) and load flexibility can help achieve speed-to-power in the near term. Just 1% data-center flexibility could unlock 100 GW—more than the entire US nuclear fleet.
Load Growth Is Increasing, Uncertain, and Concentrated
For two decades, US electricity demand was flat. Utilities, transmission planners, and corporate buyers built their planning models around that reality. Then AI workloads changed it.
AI load growth is large, uncertain, and concentrated in major power markets. While load forecasting projections vary across studies, the trajectory is clear: electricity demand is scaling faster than the bulk power grid was designed to handle. Accurate load forecasting is needed to distinguish and prioritize real demand, align capital deployment, and reduce delays in bringing new power capacity online.
On April 30, 2026, Relae (formerly Carbon Direct) hosted a Trellis Group panel on load forecasting in the AI era. Panelists included Derya Eryilmaz, PhD, Vice President of Power Commercialization at Relae; John Miller, Director of Transmission Policy at the Corporate Energy Buyers Association (CEBA); Daniel Padilla, Strategy and Business Development Lead at Emerald AI; and Sam Hodas, Head of US Government Affairs at National Grid. Jake Mitchell, Director of Climate Tech Innovation at Trellis Group, moderated.
The conversation explored where load forecasts fail, what they cost, how to fix them, and near-term solutions to overcome grid constraints. Here is what the panel found.
What Is Load Forecasting?
Load forecasting is the practice of predicting how much electricity will be consumed across a region, at what times, and under what conditions. It informs the major capital and procurement decisions on the grid: where to build transmission, how much generation to procure, what capacity to bid into wholesale markets, and how corporate buyers secure clean, firm power.
Long-term forecasts inform multi-year decisions about transmission and generation. Short-term operational forecasts inform real-time grid operations and trading. The two often sit in separate workflows, but short-term operational forecasts should feed into long-term system planning to improve accuracy as demand patterns shift.
The Bulk Power Grid Is Under Strain
Large power users face constraints on clean, firm power, transmission capacity, multi-year interconnection queues, and aging infrastructure. The strain is most acute in PJM Interconnection (PJM) and the Electric Reliability Council of Texas (ERCOT), the two US markets expected to see the most significant load growth. Each constraint raises the cost of getting load forecasts wrong.
Hodas from National Grid describes the operational reality on the utility side: aging infrastructure inherited from a different demand era. “We’ve got transmission lines that are 70 to 100 years old in New York and Massachusetts, some of the oldest in the country, still in operation.” Replacing or upgrading that infrastructure requires investment, and ratepayers are already pressed.
Why Today’s Load Forecasts Fail
Traditional load forecasting was built for predictable, gradual demand growth, not for the scale, uncertainty, and dynamic behavior of data centers.
Most utilities and Independent System Operators (ISOs) produce load forecasts on annual or biannual cycles. They aggregate submissions from individual customers, run that data through a deterministic single-peak load estimate against a single capacity scenario, and pass the consolidated forecast up to regional planners. Regional Transmission Organizations (RTOs) roll those bottom-up utility forecasts into a regional view.
This worked when demand was flat and predictable. It no longer works with nonlinear growth driven by data centers. Eryilmaz from Relae identifies key structural limitations.
Four Structural Limitations to Traditional Forecasting Methods
- Over-stating and double-counting. Data centers bid into multiple regions while shopping for power, inflating regional forecasts and blurring the line between real and hypothetical demand—the speculative-load problem.
- Deterministic models (vs probabilistic models). Most planning runs a single peak load estimate against a single capacity scenario, missing the geographic concentration and uncertainty inherent in integrating large loads into the system.
- Aggregated submissions. Utilities report large loads as a single block of gigawatts, with no resolution into workload type, ramp schedule, or operational shape. Planners reverse-engineer peak-demand assumptions rather than measure them.
- Infrequent cadence. Annual or biannual forecasts cannot catch an 80% queue reduction or a multi-gigawatt addition between cycles.
The Speculative-Load Problem
The core challenge in load forecasting is distinguishing real versus hypothetical load. While data center electricity demand is projected to grow by 13-27% annually through 2028, the majority of the projects in the data center queue may not materialize, inflating regional load forecasts.
American Electric Power's Ohio utility (AEP Ohio) introduced a tariff requiring data centers to put up firm financial commitments before getting in line for grid connection. Its interconnection queue dropped from 30 gigawatts to 5.6 gigawatts. More than 80% of the submitted load was speculative: projects that disappeared once commitment became required.
ERCOT shows the same overstatement problem on a larger scale. Roughly 225 gigawatts of data center demand sits in the ERCOT queue against a historic system peak of 85 gigawatts. Texas Senate Bill 6 introduced similar financial obligations for new loads, but those rules apply only to interconnections after 2025, and the cleanup of speculative demand has not yet materialized.
The speculative-load problem shows up in interconnection times. An average new project in PJM can wait 4 to 5 years to become operational. Some of that delay is a real backlog. The rest comes from the inability to distinguish real submissions from speculative ones.
As Eryilmaz puts it, “Load forecasting is actually the center of all of these problems. It is a tool to help planners make the right investment decisions.”
The Cost of Inaccurate Forecasting
As Miller from CEBA notes, “A single misforecasted project can swing a transmission plan by hundreds of megawatts.” Significant inaccuracies can erode public trust in the planning process in two main ways. Underbuilding adds friction to economic development and can limit corporate access to clean power markets. Conversely, overbuilding risks raising retail rates if capacity remains underutilized.
The goal is to achieve right-sized infrastructure investment. When planning aligns with actual large load growth, it can be net beneficial to retail rates. By spreading fixed costs across more usage, significant new demand can put downward pressure on the rates via the “denominator effect.”
On the other hand, forecasting variability can distort capacity procurement and interconnection queue prioritization. When load forecasts spike upward, grid operators like PJM have to scramble to buy additional electricity capacity on short notice. These emergency procurements lock in major dollar commitments on the basis of unstable forecast numbers.
PJM, Midcontinent Independent System Operator (MISO), and Southwest Power Pool (SPP) have also reshaped their interconnection queues to make room for new large loads, but those queue priorities depend on the same forecasts that are unreliable in the first place.
“There is no substitute for good backbone regional transmission planning,” Miller says. “Full stop. That is the enabler of all of the load growth that we’re talking about.”
BTM Generation and Load Flexibility: A Near-Term Bridge
Hyperscalers’ need for power is way faster than that of utilities and RTOs. Generation alone cannot scale fast enough to meet this new demand, and hyperscalers need speed-to-power.
As Eryilmaz frames it, behind-the-meter generation and load flexibility are interim solutions to the timing mismatch between data center urgency and the grid's slower build cycles. BTM generation and flexibility work differently:
- BTM is power generated on the data center's side of the utility meter, bypassing grid interconnection entirely. The structure gives operators large, reliable blocks of power without waiting years for grid approval.
- Load flexibility is the demand-side approach. A data center modifies its grid draw in response to grid signals. In practice, that can mean curtailing compute workloads during stress events, pre-cooling facilities ahead of a heat wave, drawing from on-site batteries or generators, or shifting workloads to data centers in less-constrained regions.
The Value of Load Flexibility
Relae’s power system modeling quantifies the dollar value of load flexibility in ERCOT. Load flexibility can eliminate forced load shedding risk, even at 40 gigawatts of data center buildout, preventing $5.5 billion in annual consumer welfare losses by curtailing an average of 5% of demand for under 1% of operating hours.
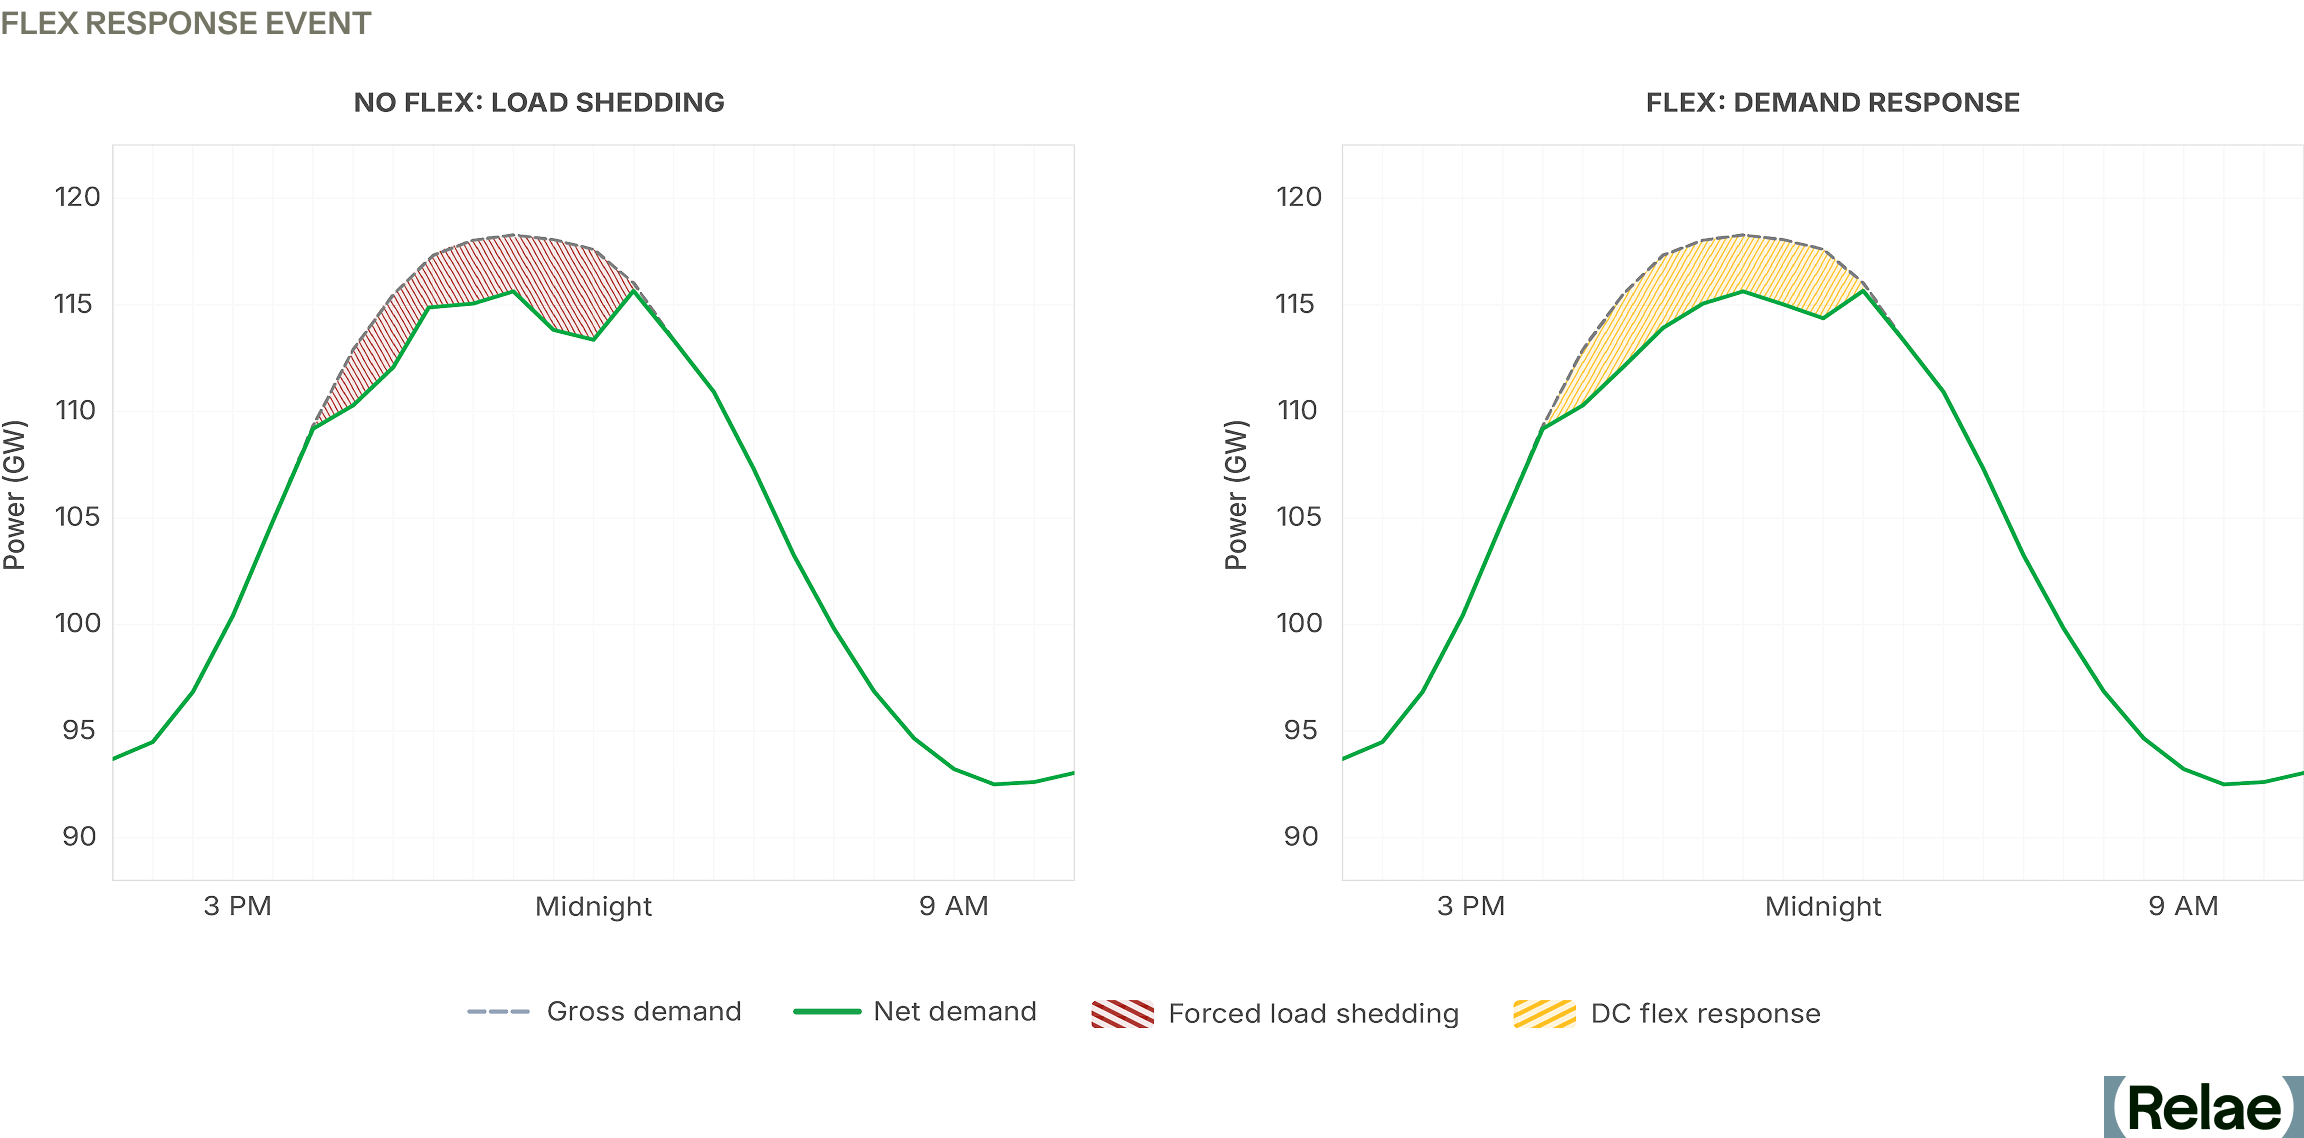
Padilla from Emerald AI reinforces the scale and value of load flexibility: “With just 1% flexibility, we can unlock 100 gigawatts of data centers across the US. That’s more than the entire US nuclear fleet.”
Silicon Valley Power, a municipal utility, is the first US utility to tie flexibility to interconnection speed: flexible data centers get connected faster. NVIDIA, EPRI, Digital Realty, and PJM are partnering on the Aurora AI Factory, the first purpose-built reference design for flexible AI data centers.
But standardized policy for load flexibility is lagging. Padilla highlights this challenge: “Today, if a data center wants to be flexible, they have nowhere to point. We need standardized tariffs, interconnection rules, and product definitions for large loads that reward them with upsizing interconnection in response to flexibility.”
Flexibility Takes Many Forms, but it Isn't Universal
Flexibility means accepting brief, predictable downtime, and some workloads can't tolerate it. Hospital systems and mission-critical enterprise applications need 99.999% uptime, the "five nines" standard. As Padilla puts it: "99.9% uptime, with brief and predictable curtailments, is plenty" for most AI workloads. That distinction determines which data centers can participate in flexibility programs.
Miller points out that compute-level flexibility is not always feasible. BTM batteries and virtual power plants (VPPs) are among the alternatives that can offset what data centers withdraw when the grid is stressed, even at facilities whose compute workloads cannot pause directly.
Better Load Forecasting: The Longer-Term Fix
While BTM generation and load flexibility can help address near-term speed-to-power, the longer-term fix is improving load forecasting methods and the standardization of data provided by the data centers themselves.
Eryilmaz outlines three technical shifts for better load forecasting:
- Embed short-term operational forecasting into long-term planning. Short-term spikes, weather risk, and reserve considerations carry direct implications for multi-year capital decisions. The line between operations and planning breaks down when growth is nonlinear.
- Replace deterministic models with probabilistic methods. Risk metrics like loss of load hours (expected hours per year that demand exceeds supply) and expected unserved energy (total expected energy shortfall) measure both how much capacity the system has and the conditions under which it might fall short. The North American Electric Reliability Corporation (NERC) has suggested both metrics as part of its reliability framework.
- Forecast load by category. Treating all data center load as a single block hides the differences in load profiles, operational schedules, and ramp-up timing that drive system planning.
Policy Alignment
Technical forecasting improvements only scale with policy alignment, and Miller proposes a two-part fix:
On the top-down side, RTOs need authority to take an independent view of utility-submitted forecasts. They should require milestones, such as firm financial commitments and secured financing, before counting a submitted load against the regional forecast.
On the bottom-up side, state regulators set the rules that govern how individual utilities prepare their forecasts. Large load tariffs play a big role in how utility-level forecasts come together. Federal and state authorities need to row in the same direction. Hodas frames the same alignment from the utility side: “Grid investment unlocks economic growth, but for us to make those investments, we need regulatory certainty.”
Standardizing Large-Load Data
The Federal Energy Regulatory Commission (FERC) has since moved: in June 2026 it issued show cause orders directing six RTOs and ISOs—CAISO, ISO-NE, MISO, NYISO, PJM, and SPP—to revise or justify their large-load interconnection rules, and in July 2026 it directed NERC to develop computational-load reliability standards and registration criteria by the end of the year. Both are useful first steps. But as Eryilmaz argues, voluntary disclosure has not closed the gap.
The industry cannot meaningfully compare ISO forecasts when each utility submits load data in different shapes (e.g., using different methods and data standards) on different schedules. Mandatory submission requirements and published methodologies, applied consistently across utilities, ISOs, and state regulators, are the only path to forecasts whose components are actually comparable.
Getting Load Forecasting Right Starts Now
The system-level fix to improving forecasting is through probabilistic, category-specific methods paired with data standardization and policy support. Together, these account for the scale, uncertainty, and dynamic behavior of data center loads, and give planners visibility into the range of possible futures and the likelihood of each.
All forecasts will be wrong to some degree, but as Miller puts it, “It's ultimately not about having a perfect prediction. It's about baking in methods to account for uncertainty.” These system-level improvements won't eliminate errors entirely, but they will minimize them, leading to more confident investment decisions and a grid better prepared for what's ahead.
Frequently Asked Questions
What is load forecasting, and why is it harder now with AI data center loads?
Load forecasting predicts how much electricity a region will consume, when, and under what conditions—the basis for where to build transmission, how much generation to procure, and how corporate buyers secure clean, firm power. It was designed for two decades of flat, gradual demand growth. Data center load is none of those things: it is large, geographically concentrated, arrives in gigawatt blocks with no disclosed operating shape, and can be withdrawn as quickly as it appeared.
What is speculative load in an interconnection queue, and how do planners tell it apart from real demand?
Speculative load is capacity requested by projects that may never be built — often the same data center bidding into several regions at once while shopping for power, which counts the same gigawatts more than once. The tested filter is a financial commitment: when AEP Ohio required firm commitments before queue entry, the utility's reported data center pipeline fell from about 30 GW to roughly 5.7 GW. Milestone requirements, independent RTO review of utility submissions, and mandatory data standards are the tools planners have.
Is load flexibility proven and scalable today, or still emerging?
The modeling case for load flexibility is strong; the commercial case is still early. Duke's Nicholas Institute found the 22 largest US balancing authority areas could absorb roughly 76–126 GW of new load if it accepts modest curtailment, and Relae's ERCOT modeling shows demand response eliminating forced load shedding risk at 40 GW of data center buildout, avoiding $5.5 billion in annual consumer welfare losses. What is still missing is the market plumbing—standardized tariffs, interconnection rules, and product definitions—so a data center willing to be flexible has somewhere to sign up.
What should a company look for when evaluating a region's load forecast?
Ask whether the forecast is probabilistic or a single deterministic peak, how often it is refreshed, and whether large loads are broken out by category and operating shape rather than reported as one block of gigawatts. Then ask what milestone or financial commitment a project must clear before its megawatts count toward the forecast. A forecast that cannot answer those three questions cannot tell you how much of the queue ahead of you is real.
[cta]