EU Emissions Trading System Reform: What It Means for CDR and International Credits
Key Takeaways
- The European Commission’s proposal to reform the EU Emissions Trading System (EU ETS) would fund 250 million tonnes of biogenic emissions capture with carbon storage (BioCCS) and direct air capture with carbon storage (DACCS), from 2031-2040.
- Our modeling suggests that the Commission’s anticipated prices are unrealistically low, meaning revenue from auctioned ETS allowances may be insufficient to fund an equivalent volume of DACCS and BioCCS.
- The proposal would also fund the procurement of up to 260 million tonnes of high-quality international carbon credits from 2036-2040. This would turn the EU into a major buyer of credits under Article 6 of the Paris Agreement, and set eligibility standards that will shape demand beyond Europe.
- Negotiations are expected to conclude in early 2027 and will determine the procurement volumes, scope of eligible projects, design of funding mechanisms, and associated timelines.
- Developers who design projects to meet demand and eligibility standards in both voluntary and compliance markets will be best placed to capture this value.
Voluntary and Compliance Markets Are Converging
Carbon project developers are already commercializing across voluntary and compliance markets. Eligible nature-based projects can sell credits to voluntary buyers or to CORSIA-obligated airlines. Similarly, ethanol plants paired with carbon capture and storage (CCS) can generate durable carbon dioxide removal (CDR) credits or monetize their low-carbon ethanol through California’s Low Carbon Fuel Standard. Corporate buyers are also guided by the Science Based Targets initiative’s (SBTi) Corporate Net Zero Standard, which introduces mandatory CDR from 2035. Increasingly, suppliers will need to consider both voluntary demand and compliance opportunities in order to maximize their economic benefits and climate impact.
The European Commission’s proposal to integrate carbon credits into the EU Emissions Trading System (ETS) creates another significant opportunity. The proposal reshapes the ETS on several fronts. It expands airline obligations, extends incentives for sustainable aviation fuel (SAF), reforms price control levers, and attaches conditions to the distribution of free allowances. All of these reforms are under negotiation with the European Parliament and the Council of the EU, with a final agreement expected in the first quarter of 2027. This blog focuses on the two elements most relevant to carbon project developers: the integration of CDR, and the procurement of international credits.
What Is the EU Emissions Trading System?
The EU ETS is Europe’s flagship emissions trading scheme: a cap-and-trade carbon market covering power, industry, aviation, and maritime shipping. The EU ETS sets an overall cap on the emissions allowed from regulated sectors. Companies must hold one allowance for every tonne of CO2 equivalent (tCO2e) they emit, or face penalties. Most allowances are sold at auctions, and those funds are recycled back into climate and energy projects in Europe. The number of allowances issued decreases annually, which tightens supply, increases prices, and sharpens the incentive to decarbonize. However, driving those final emissions to zero can become prohibitively expensive. Integrating CDR into the ETS would allow entities to compensate for the residual emissions from the hardest-to-abate sectors with an equivalent volume of CDR.
The European Climate Law and the 2040 Target
The European Climate Law sets a binding target to cut net emissions 90% below 1990 levels by 2040. The law lets international carbon credits cover “up to 5% of 1990 net Union emissions.” The baseline emissions were around 4,609 million tCO2e, meaning 5% is roughly 230 million tCO2e per year. The Commission’s proposal would replace a small share of mandated ETS emissions reductions with international credits, easing pressure on regulated entities while keeping the bulk of the effort (at least 85% reduction) at home.
The proposal now sits with the European Parliament and the Council of the EU, with members of each body working to reach consensus. Once each body has adopted a unified negotiating position, they will enter into ‘Trilogue’ negotiations alongside the Commission to agree on a final text. On current timelines, those talks will begin in early 2027.
Integration of CDR into the EU ETS
What Did the Commission Propose?
Scope: The proposal brings only biogenic emissions capture with carbon storage (BioCCS) and direct air capture with carbon storage (DACCS) credits into the ETS. As long expected, the proposal requires these units to be generated in the EU and certified under the Carbon Removal and Carbon Farming (CRCF) Regulation. The Commission chose to exclude all other project types, at least initially. The proposal does not indicate the relative procurement quantities of BioCCS and DACCS, but the Commission will pursue a portfolio approach that considers cost-effectiveness.
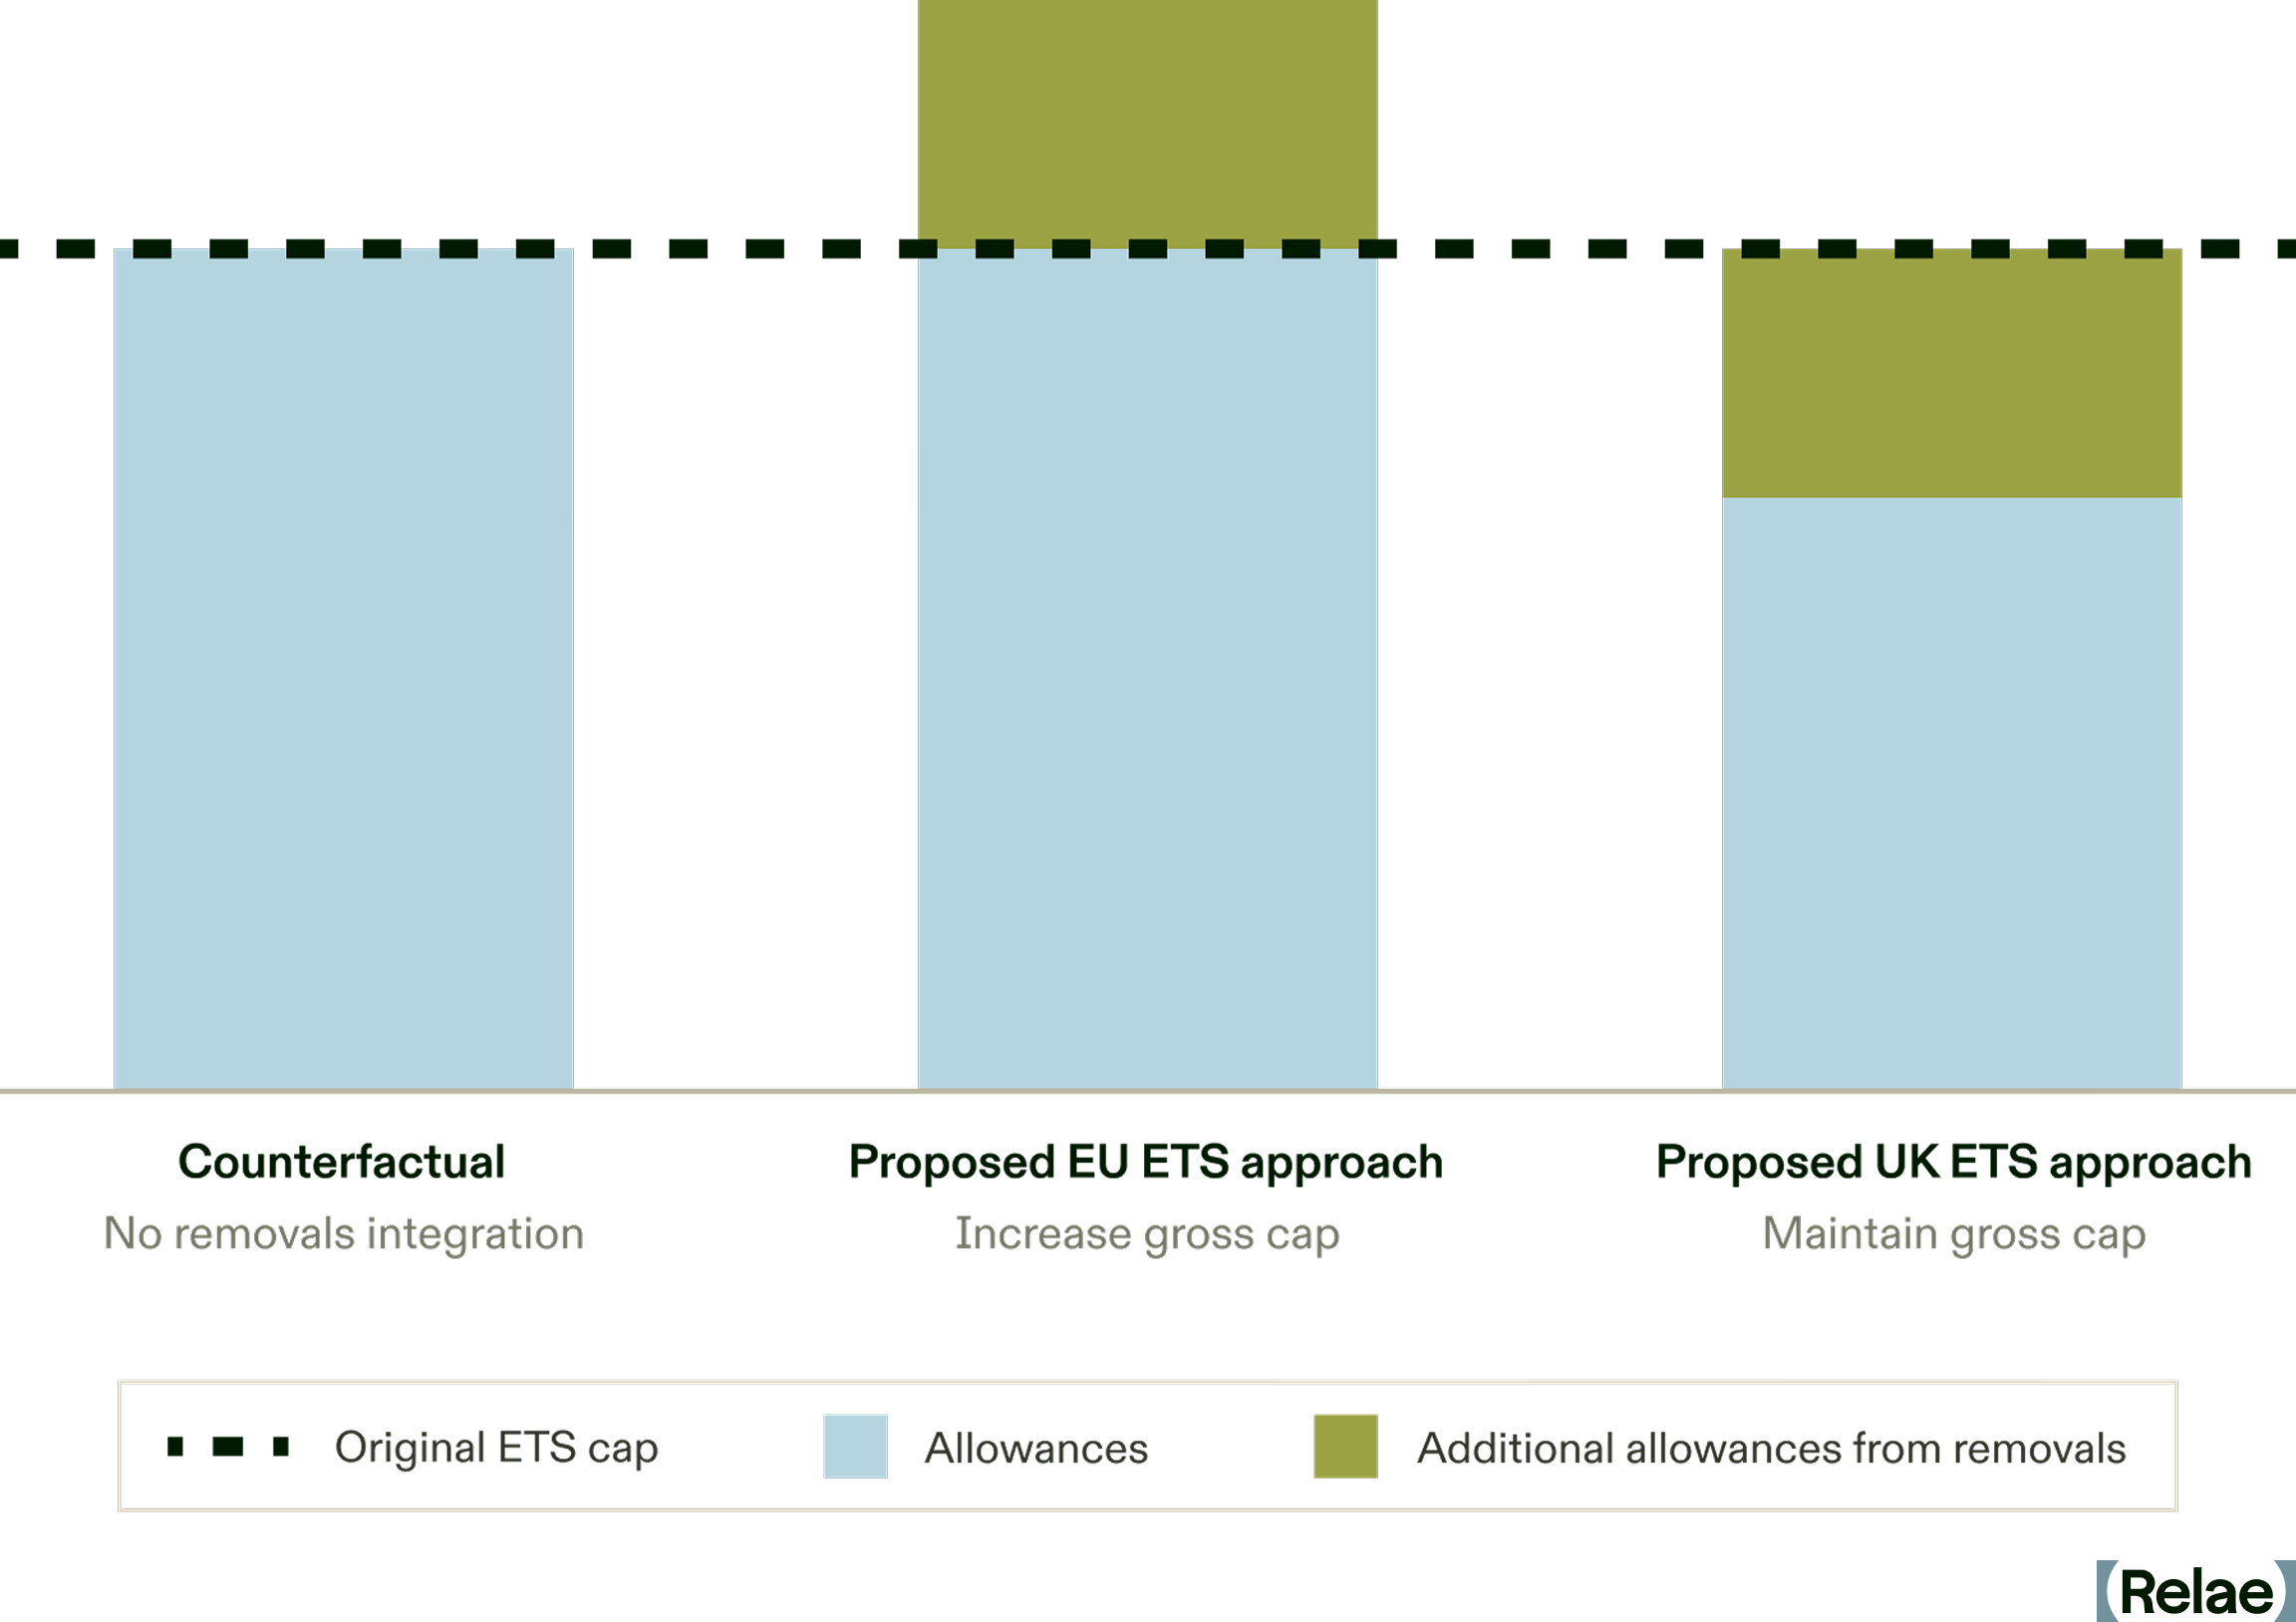
Volume: The Commission would increase the ETS cap by a total of 250 million allowances, and use the additional auction revenue to fund the purchase of 250 million tCO2e of CDR. If the initial funds are insufficient, revenue from an additional 10 million allowances would be set aside to fund these purchases.
Mechanism: BioCCS facilities regulated under the ETS that generate their own CRCF-certified CDR can use the credits to reduce their ETS obligations. Otherwise, all procurement and use of units would be managed by a central procurement facility, not by regulated entities. This design differs from the approach promoted by the UK ETS Authority in 2025 (see Figure 1). This could be relevant in discussions about relinking the systems, as fungibility of CDR generated in the respective markets will be critical to developer planning.
Timeline: The Commission can start buying eligible CDR in 2031. The volume of allowances auctioned to fund this procurement will start in 2031 and increase each year, up to 48 million allowances in 2040. The level of procurement in earlier years was not included in the proposal. An important review clause is built in: in 2034, the Commission will assess whether evidence supports the integration of more project types, and also whether regulated entities can start buying CDR directly.
What’s Under Negotiation?
Scope: Of all excluded project types, the Commission's accompanying Impact Assessment discussed biochar most favorably. Peter Liese, the European Parliament’s lead negotiator on ETS reform, initially proposed to include biochar, but capped at 20%, possibly to assuage concerns that biochar would crowd out DACCS and BioCCS due to its lower cost. Even if non-CCS CDR remains excluded for now, the final text could require new legislation to set criteria on how those projects can achieve integration in future.
Volume: Negotiators’ perspectives vary widely on the optimal volume of CDR to include in the ETS. The parliamentary Greens, more skeptical of increasing the ETS allowance cap to accommodate CDR, have proposed that the 250 million figure should be as low as 75 million. Conversely, Renew, a centrist party more supportive of CDR integration, wants to increase the figure to 300 million. In any case, specific procurement targets for all years, not only 2040, would improve market certainty and enhance project bankability.
Mechanism: Revenue from auctioned ETS allowances may be insufficient to fund an equivalent volume of CDR. Our proprietary modeling, which draws on anonymized real-world price points by suppliers, suggests the Commission’s anticipated CDR prices are unrealistically low. Separately, Council representatives have proposed to set aside 50 million allowances in case the initial funding falls short, up from the Commission’s proposed 10 million. Other ETS aspects also play a role. For example, extended provision of free allowances would reduce auction demand and depress prices. Developers will want confirmation of how much CDR the Commission will buy, regardless of the ETS allowance price.
Timeline: Negotiators and industry advocates have called for the Commission to start procuring CDR well before 2031. The review considering inclusion of non-CCS project types could also be brought forward from 2034. Both of these aspects would enhance certainty for developers, and enable projects to reach Final Investment Decision (FID).
EU Procurement of International Carbon Credits
What Did the Commission Propose?
Volume: The European Climate Law allows the use of around 230 million tCO2e of international credits per year. The European Commission proposed that the ETS use some of these credits–up to 260 million tCO2e in total across 2036-2040. In total, this demand for Paris Agreement-aligned internationally transferred mitigation outcomes (ITMOs) would be greater than the 170-215 million tCO2e projected for CORSIA Phase 1. Importantly, the ETS only represents a portion of the full amount of international credits available for EU entities to use. Rules governing how EU member states can use ITMOs to meet their climate targets are pending, and the allocation and use of those credits across EU climate policy instruments remain subject to further legislation.
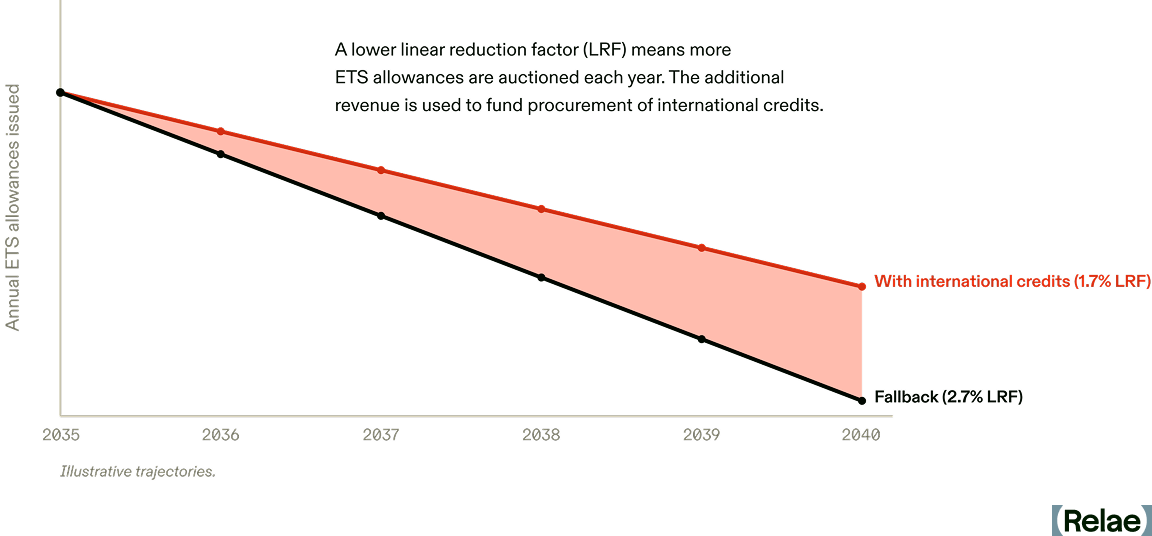
Mechanism: The linear reduction factor (LRF), which sets the rate at which the issuance of new ETS allowances declines annually, would fall from 3.7% over 2031-2035 to 1.7% from 2036-2040, rather than the 2.7% that would otherwise apply. That one-point slowdown leaves more allowances in the system. Auction revenue from up to 260 million extra allowances would fund the purchase of an equivalent volume of high-quality international credits. Again, procurement would run through a Commission facility; regulated entities cannot buy credits directly.
Scope: Credits would need to meet criteria established under the Climate Law. A proposal is expected in late 2026, expected to make reference to standards under Article 6.4 of the Paris Agreement and impose additional requirements on the quality of the host country’s climate reporting.
Timeline: Revenue from auctioned ETS allowances will be set aside for international credits from 2036 onwards. However, the European Climate Law provides for a pilot phase from 2031-2035, which could enable earlier activity from the Commission. A review in 2033 will determine if sufficient high-quality credits are available on the market—if there aren’t, the LRF will rise to 2.7%, closing the headroom opened for international credits.
What’s Under Negotiation?
Volume: The most important question is whether international credits survive the negotiations at all, with some influential parties concerned about replacing domestic emissions reductions driven by the ETS with projects outside of EU control. Parliamentary groups, members of the Council of the EU, and the European Economic and Social Committee, an EU advisory body, have all proposed that international credits be entirely excluded from the text.
Mechanism: Should international credits remain in scope, the Commission will be pushed to elaborate on expectations for the pilot period. Peter Liese’s proposal also suggested that international projects developed by EU-linked companies could be given priority. This could lead third-country governments to seek more European involvement in the development of carbon projects. Additionally, reporting on closed-door negotiations suggests that some parties want to connect international credits to the market stability reserve (MSR), which adjusts allowance supply in response to surplus in the market, and leave the LRF untouched.
Scope: The quality criteria for international credits will be laid out in separate legislation, and similar criteria may be applied to EU airlines meeting their CORSIA obligations. The Commission’s Climate Change Expert Group has already discussed meaningful restrictions, such as on projects related to avoided deforestation or based in countries with faulty reports under Article 6 of the Paris Agreement. These rules will be critical for stakeholders, as mere compliance with the rules of certification registries may not be enough to qualify a project for procurement eligibility.
Timeline: The review of the international credit market in 2033 leaves project developers little time to secure capital before procurement begins in 2036. The start date is fixed in the Climate Law, so it is not up for negotiation. However, the inflexible design of the fallback could change. As drafted, the LRF rises to the full 2.7% in 2036 if there are not enough available high-quality credits, meaning none can be used at all. Negotiators could instead use the volumes the market delivers, and scale the LRF to the remaining gap, rather than raising it in full.
Proposed EU ETS Timeline: Key Dates for CDR and International Credits
- Early 2027: Trilogue negotiations expected to begin, with a final agreement targeted for the first quarter.
- 2031: The Commission can begin buying CDR, and the pilot phase for international credits may be considered for 2031-2035.
- 2033: Review of whether enough high-quality international credits are available. If not, the LRF rises to 2.7% (in 2036-2040).
- 2034: Review of whether to admit more CDR project types and let regulated entities buy CDR directly.
- 2036: International credit procurement begins, and the LRF would fall to 1.7%.
- 2040: Allowances auctioned to fund CDR reach up to 48 million, and the 90% net emissions reduction target applies.
Positioning for What Comes Next
However the final text lands, the EU is becoming a major player in the market for CDR and internationally transferred mitigation credits. Compliance demand will become increasingly important, and if you’re raising capital for a project, you should no longer plan around voluntary buyers alone. You need a clear view of the regulatory factors that decide project viability, including committed volumes, legislative timelines, eligibility rules, and allowance price controls. We help developers formulate cohesive strategies across voluntary and compliance markets, while building quality projects that deliver the committed tonnes and impact.
Frequently Asked Questions
Can companies use carbon dioxide removal or international credits for EU ETS compliance?
Under the European Commission proposal, the Commission buys both centrally, so regulated operators cannot surrender CDR units or international credits to meet their obligations. There is one exception: a regulated entity that generates its own biogenic emissions capture with carbon storage (BioCCS) credits certified under the Carbon Removal and Carbon Farming (CRCF) Regulation can use those to reduce its ETS obligations.
Which carbon dioxide removal pathway would be eligible under the EU ETS?
Only biogenic emissions capture with carbon storage (BioCCS) and direct air carbon capture and storage (DACCS). Both must be EU-based and certified under the Carbon Removal and Carbon Farming (CRCF) Regulation. Other CDR methods are excluded for now.
When would the EU start buying carbon dioxide removal and international credits?
The two run on different timelines. The European Commission could begin purchasing CDR from 2031, with volumes ramping up to 48 million tonnes of CO2 equivalent (tCO2e) in 2040. Actual procurement volumes may depend on auction proceeds, removal costs, and the final mechanism design. International credit procurement would start in 2036.
Carbon Removal
Relae helps carbon removal buyers, investors, suppliers, and project developers navigate a complex market shaped by evolving science, quality standards, delivery risk, and claims expectations. We combine carbon removal strategy, project-level diligence, and market intelligence informed by work with leading buyers and project developers to help you assess quality, build diversified portfolios, and scale high-integrity carbon removal.
Article 6 of the Paris Agreement: A Practical Primer



Chimdi Obienu

Chimdi Obienu
,

Before Relae, Chimdi worked as the Carbon Markets Data and Policy Lead at EcoAct (part of Schneider Electric), where he created the knowledge management system covering frameworks such as CORSIA, Article 6 of the Paris Agreement, and the ICVCM Core Carbon Principles. As part of the Research and Innovation Team, he built scenario modeling tools to quantify the exposure to regulatory carbon pricing mechanisms, such as the EU ETS and CBAM, as well as the costs of assorted carbon offsetting approaches.
At EcoAct, Chimdi also worked as a sustainability consultant, supporting clients with GHG inventory accounting, environmental disclosures (e.g., CDP), and the development of decarbonization strategies.
Chimdi began his career in Washington DC, advising clients on policy developments and technology innovation across the energy and transportation sectors.
Best Student, University of Sussex MSc in Energy Policy
What to Read Next
Decarbonizing Cement and Concrete: Are Their Emissions Set in Stone?
Key Takeaways
- Cement is the key ingredient in concrete and is responsible for more than 80% of concrete’s emissions. Cement’s GHG emissions are the primary technical challenge in decarbonizing an industry that accounts for over 8% of annual global greenhouse gas emissions.
- The global market for low-carbon concrete is constrained by the slow deployment of breakthrough technologies, yet demand from major buyers such as hyperscalers, developers, and infrastructure investors is accelerating. This mismatch between demand and supply is creating a new market mechanism: environmental attribute certificates (EACs) for building materials.
- EACs represent the climate benefits of low-carbon materials and can be traded separately from the physical product. These certificates, when backed by robust technical diligence, offer a near-term funding mechanism to accelerate decarbonization across the cement and concrete supply chain.
The AI Boom Meets an Industrial Reality
As the market for AI infrastructure expands, data center construction is accelerating—and with it, demand for concrete, one of the most carbon-intensive materials in the built environment. For both builders and material suppliers, the embodied carbon of cement and concrete is under a microscope due to its significant climate impact. Hyperscalers, like Microsoft and Meta, have 2030 targets that far outpace the concrete industry’s readiness to provide near-term low-emissions materials.
This piece explores why cement and concrete decarbonization is so challenging and how credible, high-quality EACs can help bridge the ambition gap.
Cement and Concrete: An Important Distinction
These two terms are often used interchangeably, but they are not the same—and the distinction matters for decarbonization strategy. Cement is the reactive ingredient in concrete, acting like an egg in a cake batter. Concrete itself is a blend of cement, aggregates (like sand and gravel), and water (the batter overall). While concrete is widely used and often seen as the emissions culprit, it is actually cement—just 15% of the mix by volume—that is responsible for more than 80% of concrete’s lifecycle carbon emissions.
Why Is Concrete so Hard to Decarbonize?
Concrete is the second most-used material on Earth after water. Despite emitting only ~0.13 kg of CO₂ per kilogram, its sheer scale gives it an outsized climate impact—contributing around 8% of global CO₂ emissions. Yet decarbonization has been slow, held back by technical, structural, and accounting challenges across a complex supply chain.
The Supply Chain Behind Concrete’s Carbon Footprint
To understand why decarbonizing concrete is so difficult, it’s essential to understand how it’s made and what drives its emissions. Three factors explain much of the difficulty:
- Cement is made in an emissions-intensive process. Cement is produced by heating limestone to extreme temperatures (~1450 °C) to create clinker, a reactive material that binds sand and aggregates into concrete. This energy and carbon-intensive process is where the majority of the emissions occur.
- Concrete is made to order. Concrete is a blend of cement, aggregate, and water. It is made to order at local batch plants and poured on-site or used in precast molds, with mix designs tailored to specific compressive strength and durability requirements.
- The supply chain is decentralized and performance-driven. Because concrete mixtures must meet application-specific performance requirements, low-carbon innovations are limited to those that do not decrease product quality and performance at any point in the value chain.
This layered supply chain, from kiln to batch plant to job site, means decarbonization strategies must be compatible with local infrastructure, material availability, and performance needs. There is no single lever to pull.
Clinker Is the Main Emissions Driver
Clinker production alone accounts for the majority of cement’s emissions, due to the chemical process (calcination) that converts limestone into lime and releases CO2. Not only does calcination directly produce CO2, but the combustion of fossil fuels used to heat the kiln adds to the emissions of the overall process.
Low-Carbon Concrete Technology: Invented, Not Yet Deployed
Six promising technologies are in development to address cement and concrete emissions, including:
- Carbon Capture and Storage (CCS): CCS can be retrofitted to capture the fuel and process emissions from clinker production, delivering nearly complete decarbonization of the cement manufacturing process. CCS can be combined with electrification or fuel switching to deliver deeper decarbonization
- Supplementary cementitous materials (SCMs): SCMs offer two key benefits: they can partially replace conventional cement in concrete mixtures, and certain SCMs react with CO₂ from industrial or atmospheric sources to enable durable carbon storage.
- Electrification: Electrifying kiln heating systems can reduce emissions from fossil fuel combustion during clinker production. When powered by low-carbon electricity, this approach lowers the carbon intensity of cement manufacturing while maintaining the high temperatures required for clinker formation.
- Fuel Switching: Natural gas, biomass, and renewable natural gas are low carbon-intensity fuels that can replace the higher-emitting coal and refuse derived fuel that usually drive the clinker production process. Unlike electrification, some alternative fuels can be used as 'drop-in' replacements in existing equipment.
- Synthetic and recycled aggregates: Alternatives to traditional gravel and crushed stone, made from waste materials or industrial byproducts, which can lower emissions and reduce resource extraction.
- CO2 curing: A process where concrete is cured with captured CO2 instead of air, helping lock carbon into the material and partially offsetting upstream process emissions.
Each solution faces deployment challenges, from raw material availability and geographic constraints to cost, performance certification, and integration with legacy infrastructure.
Few decarbonization strategies have reached industrial scale today, but these strategies are being piloted and demonstrated, and given targeted support, some have the potential to significantly decarbonize the future of the industry.
The Gap Between Targets and Real Market Capacity
Hyperscalers, utilities, real estate developers, and other large organizations with ambitious scope 3 targets are looking to significantly reduce the embodied carbon throughout their supply chain. However, the current supply of deeply decarbonized cement and concrete is insufficient to support these targets through direct procurement alone; the low-carbon material simply does not exist at the required volume or in the right geographies. In some cases, pilot plants produce too little material to meet large-scale demand, while projects capable of larger volumes may not yet be located in regions where interested buyers are concentrated.
In this context, EACs offer a flexible mechanism to fund innovation and bridge the gap. By unbundling climate attributes from physical materials, near-term obstacles, such as geographic availability, can be overcome while channeling capital toward scalable and catalytic solutions.
When backed by rigorous life cycle assessments and high-quality, transparent traceability standards, EACs can provide the financial bridge for truly innovative suppliers to invest in the capital solutions required to decarbonize cement and concrete. EACs can serve a catalytic role to support scalable strategies and help ensure that first-of-a-kind facilities are built, and direct procurement of low-carbon concrete is increasingly feasible in the years to come.
How Environmental Attribute Certificates Work in Cement and Concrete Markets
EACs translate emissions reductions from low-carbon cement and concrete production into climate attributes that can be purchased separately from the physical material. Instead of requiring buyers to procure low-carbon concrete directly from a specific supplier site, EACs allow the climate benefit associated with that production to be transacted independently through a book and claim model.
In practice, a producer implements a verified emissions reduction intervention, such as reducing clinker content through supplementary cementitious materials, installing carbon capture at a kiln, or deploying alternative cement chemistries. The resulting emissions reductions are quantified through life cycle assessment and product-level disclosures such as Environmental Product Declarations. Verified reductions can then be converted into certificates representing the climate benefit of that lower-emissions production.
Buyers can purchase these certificates to support the deployment of low-carbon cement and concrete technologies while making progress toward embodied carbon reduction targets. In this way, EACs provide an early demand signal and a revenue stream that can help producers finance capital-intensive decarbonization investments across the cement and concrete supply chain.
What This Means for Suppliers and Buyers
Whether you are procuring concrete or producing it, EACs are only one part of a broader decarbonization strategy. Navigating this space requires decisions at the intersection of technical feasibility, GHG accounting, and capital strategy. Key considerations include:
- GHG accounting and reportability: Life cycle assessments, Environmental Product Declarations, and other product-level attributes must be tracked and transacted with high integrity. Buyers should report their EAC activities responsibly, especially in the current absence of formal standards and guidance.
- Procurement alignment: EAC buyers must ensure purchased certificates reflect equivalent performance grade materials to what was directly procured for structural applications.
- Monetization pathways: Book-and-claim EAC models offer producers a way to fund capital-intensive decarbonization upgrades while giving buyers a credible way to meet interim scope 3 goals. EAC transactions can take many forms and should be designed thoughtfully to minimize risks such as double counting.
Frequently Asked Questions
What is low-carbon cement, and how does it work?
Low-carbon cement reduces emissions by replacing traditional clinker with supplementary cementitious materials (SCMs), switching to cleaner fuels, electrifying kilns, or capturing CO₂ at the point of production. Because cement is responsible for more than 80% of concrete's lifecycle emissions, interventions targeting clinker production deliver the greatest climate impact. Most approaches are technically proven at smaller scales but have not yet reached the industrial volumes needed to meet mainstream demand.
How do EACs for cement and concrete compare to direct procurement of low-carbon materials?
Direct procurement means physically buying low-carbon concrete from a supplier, which requires that product to exist at conditions that often can not be met today. EACs decouple the climate benefit from the physical material, allowing buyers to fund verified emissions reductions across the supply chain even when direct sourcing isn't feasible. Both approaches can count toward scope 3 targets, but EACs offer more flexibility in the near term while the low-carbon materials market matures.
Is low-carbon concrete proven and available at scale today?
The core technologies for decarbonizing cement and concrete are technically demonstrated, but most have not reached commercial scale. Supply is geographically concentrated and insufficient to meet the volume demands of large buyers like hyperscalers, utilities, and real estate developers. This gap between technical readiness and market availability is precisely what makes EACs a valuable bridging mechanism right now.
What should a company look for when evaluating EACs for cement and concrete?
High-quality EACs should be backed by rigorous life cycle assessments and transparent traceability standards that tie the certificate to a specific, verifiable emissions reduction intervention. Buyers should also confirm that the certificates represent materials with equivalent performance grades to what they are directly procuring for structural applications, and that accounting practices minimize risks like double counting. Working with a technically credible advisor to evaluate EAC quality is essential, since the market currently lacks formal standards and guidance.
How Relae Can Help Decarbonize Cement and Concrete
Decarbonizing cement and concrete is both a technical and a strategic challenge. Relae brings integrated expertise across geochemistry, life cycle assessment, carbon accounting, and industrial decarbonization strategy to help buyers and producers navigate the complex path to decarbonization. Relae works directly with producers developing low-carbon cement and concrete technologies and with global buyers seeking credible pathways to address embodied emissions in construction. Our team combines industrial decarbonization engineering, geochemical expertise, and carbon accounting to evaluate emerging EAC frameworks and ensure they deliver real climate impact.
- EAC advisory for buyers: Relae helps buyers procure high-quality EACs through criteria development and in-depth technical diligence of EAC offerings across a range of low-carbon commodities, supporting purchased certificates that reflect genuine, verifiable climate impact.
- EAC advisory for suppliers: Relae helps producers design high-quality EAC interventions and assess potential EAC claims throughout the supply chain, informed by technical assessment, book-and-claim systems, and market landscaping.
- For both: Relae’s levelized cost of carbon abatement tooling provides custom modeling to assess trade-offs across cement and concrete decarbonization pathways, helping ensure that every dollar of climate spend goes further.
Scope 3.1 Emissions: How to Measure and Reduce Value Chain Impact
Key Takeaways
- Scope 3.1 emissions, purchased goods and services, can account for up to 67% of a company’s total carbon footprint, making them a critical category for measurement and action.
- Companies can reduce risk, meet stakeholder demands, and strengthen supply chain resilience by proactively managing scope 3.1 emissions.
- Relae empowers organizations to take meaningful action on scope 3.1 through science-based measurement, practical emissions management strategies, and deep supplier engagement.
What Are Scope 3 Emissions and Why Do They Matter?
Scope 3 emissions include all indirect greenhouse gas (GHG) emissions that occur across a company’s value chain. While scope 1 emissions are from directly owned or controlled activities, and scope 2 are indirect emissions from the generation of purchased electricity, heat, or steam, scope 3 emissions encompass upstream and downstream activities throughout the value chain.
Within scope 3, there are 15 categories, including activities such as raw material extraction, purchased services, shipping, business travel, product use, and end-of-life treatment. Critically, scope 3 emissions usually make up the majority of a company's total carbon footprint. Across sectors, CDP finds supply chain emissions average 26 times a company's operational emissions, and in supply-chain-heavy sectors like apparel, the share exceeds 95%.
Category 3.1 (purchased goods and services) is often the largest contributor. For many organizations, it can be as much as 67% of their total corporate footprint. Despite being outside a company’s direct operational control, scope 3 emissions are increasingly scrutinized by regulators, investors, and customers alike, making them essential to measure, manage, and reduce.
What Is Included in Scope 3.1 Emissions?
Scope 3.1 emissions capture all cradle-to-gate emissions associated with products and services procured by an organization. These include emissions from the extraction of raw materials, energy usage, manufacturing processes, waste, and transport and travel up to the point of delivery to the reporting company. As such, the types of activities within this category are quite extensive and disparate.
Examples of scope 3.1 items include:
- Raw materials (e.g., limestone, copper ore, lumber)
- Intermediate products (e.g., steel, electronic components, platform chemicals)
- Packaging materials
- Office supplies and equipment
- Professional services
- Cloud computing and software services
The size of scope 3.1 emissions varies widely by industry. For example, a consumer goods manufacturer sourcing large volumes of physical products may see a larger share of emissions in this category than the supplier providing the raw materials. For data centers that run on very low-carbon electricity, equipment and construction can account for 40% of lifetime emissions. For many organizations that are service-based or contract out manufacturing, scope 3.1 can be the most significant emissions category.
What Is the Strategic Value of Scope 3.1?
While scope 3.1 emissions fall outside a company’s direct operational control, they are not beyond its influence. Addressing emissions from purchased goods and services may open up a range of strategic benefits:
- Innovation opportunities through lower-carbon materials and production processes.
- Enhanced supplier relationships and engagement on shared sustainability goals.
- Improved resilience and risk mitigation across supply chains.
By assessing and acting on scope 3.1 emissions, companies can drive meaningful reductions and catalyze change throughout the entire supply chain.
What Are the Methods for Calculating Scope 3.1 Emissions?
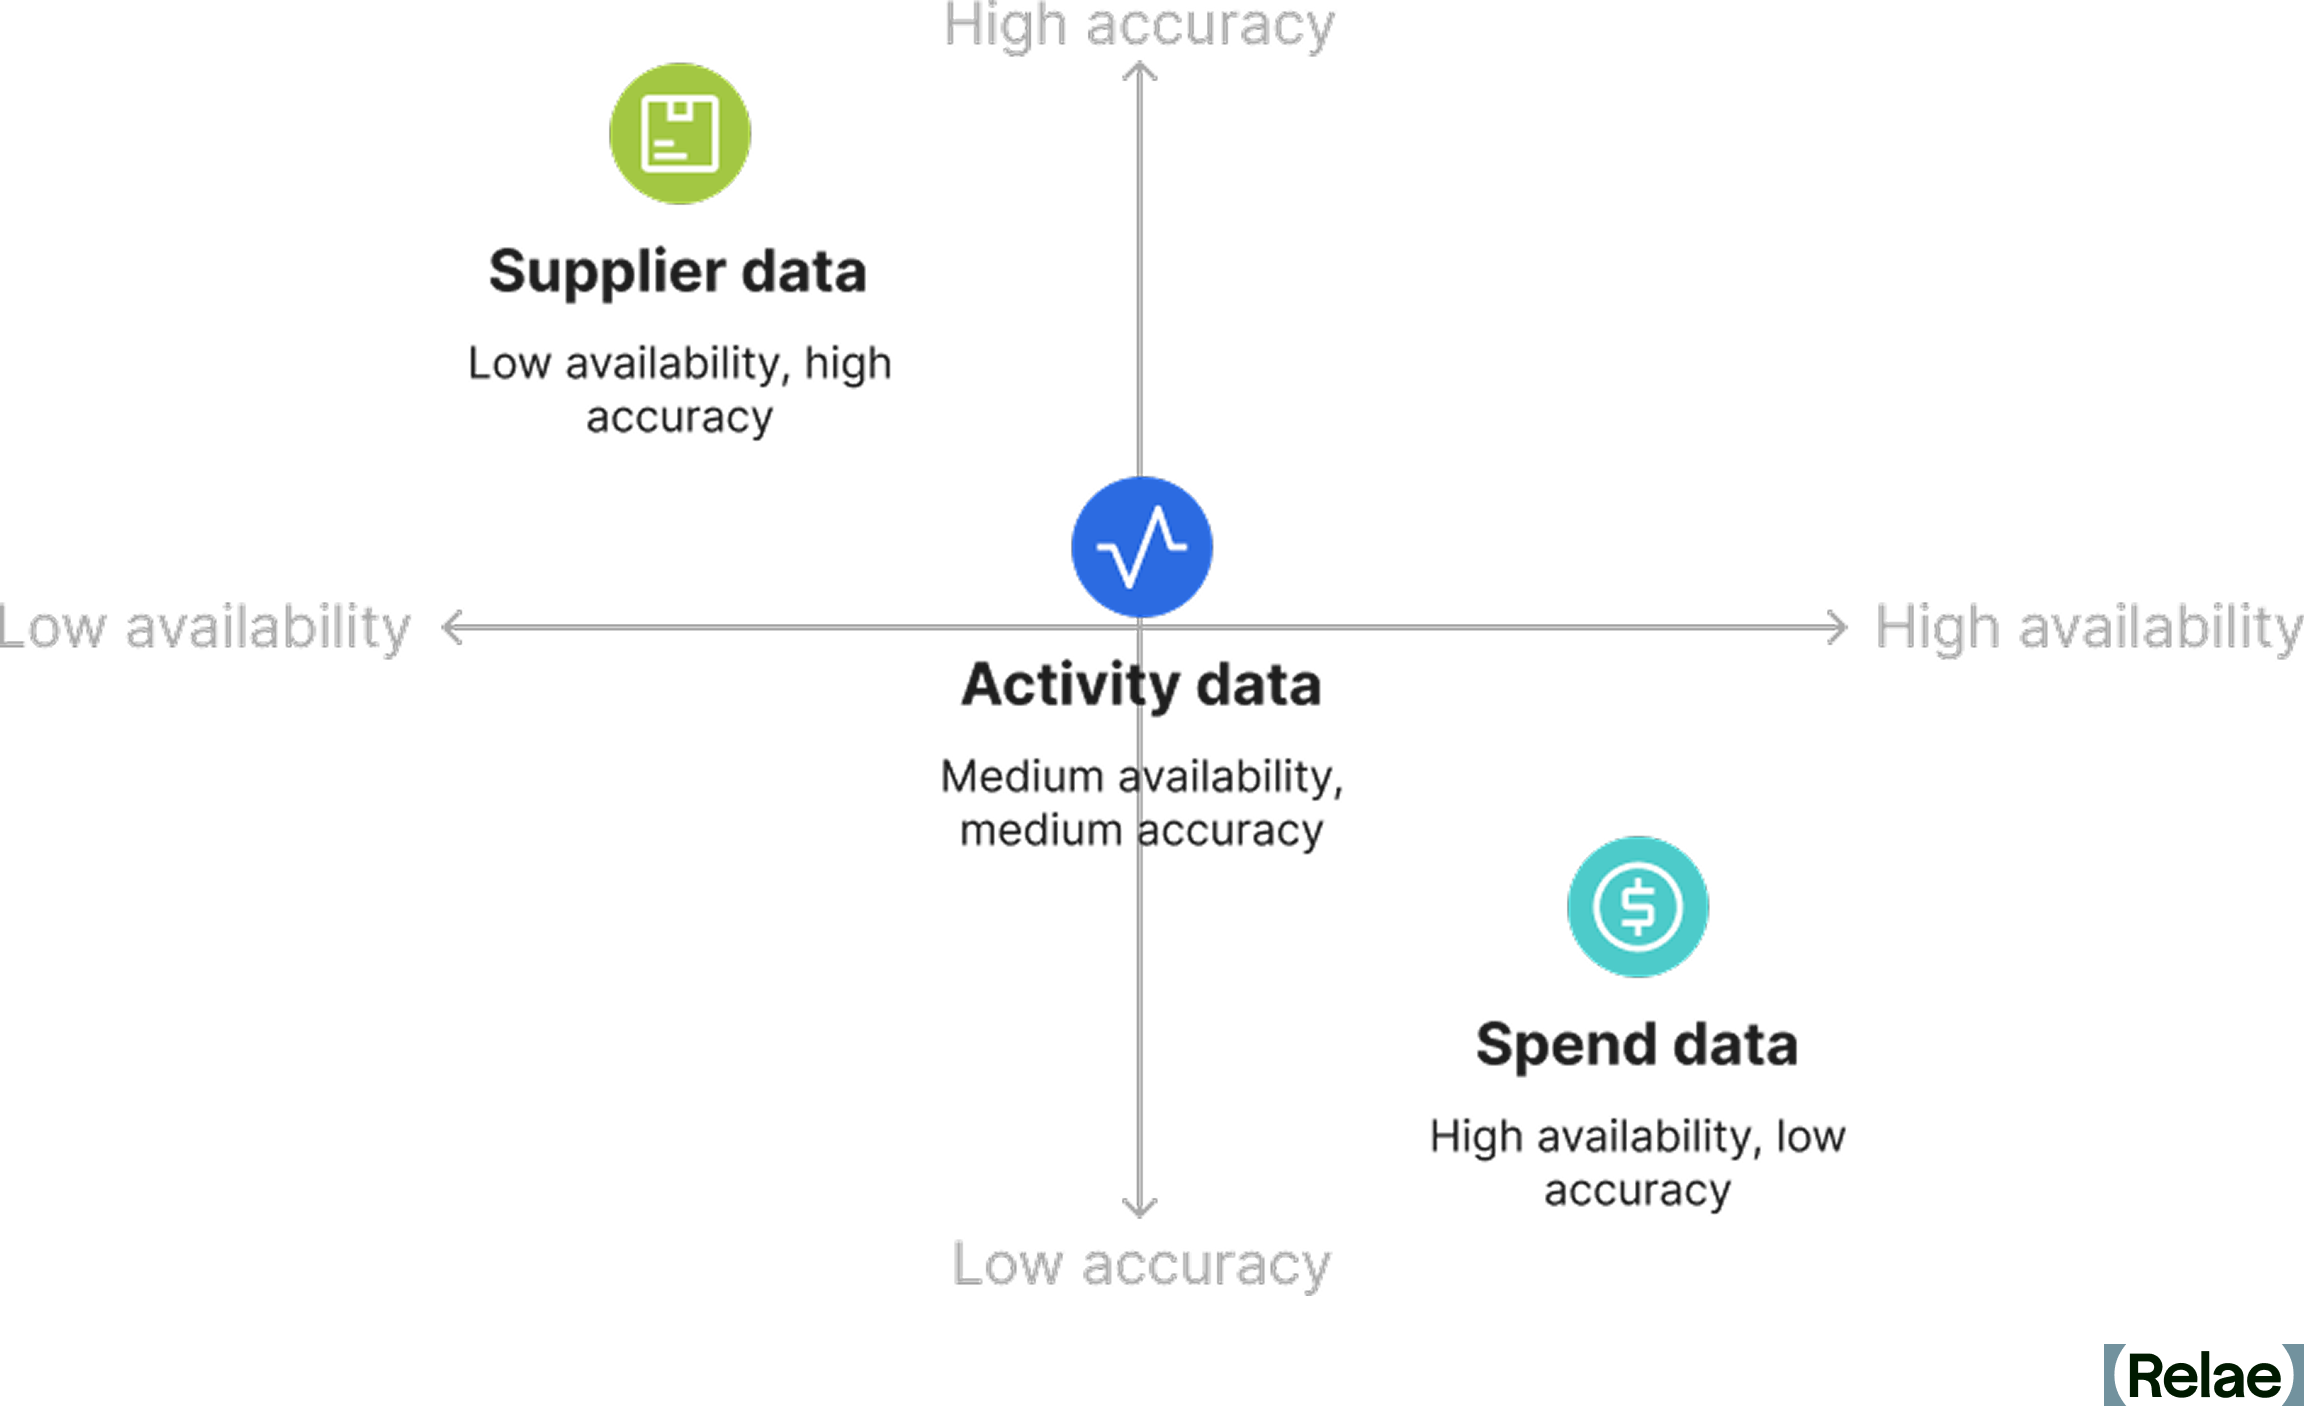
There are four methods to calculate scope 3.1 emissions based on the data collected. Each offers a different balance of speed, accuracy, and scalability.
1. The Spend-Based Method
This approach multiplies the amount of money spent on a good or service by an economic emissions factor (e.g., kg CO₂e per dollar spent). Most companies use this approach as a starting point but transition to more accurate methods as they advance in their sustainability journey.
Advantages
- Fast and scalable across categories
- Useful for initial hotspot identification
- Helps fill data gaps when activity data is unavailable
Limitations
- Lower accuracy, especially during periods of inflation or economic volatility
- Cannot reflect actual emissions reductions by suppliers
- Misalignment between price and emissions (e.g., high-cost items may not be high-emission)
2. The Average Data Method
This method uses average emissions factors for goods or services, based on industry datasets. For instance, industry life cycle assessments (LCAs) might be used to estimate the emissions associated with a kilogram of steel purchased.
Advantages
- More accurate than spend-based
- Suitable for companies refining emissions data to enable targeted reductions
Limitations
- Lack of raw data granularity
- Geographic variation limited
3. The Supplier-Specific Method
The supplier-specific method is the most accurate approach and involves collecting actual emissions data directly from suppliers. This includes LCAs, environmental product disclosures (EPDs), product carbon footprints (PCFs), supplier emissions reports, or Environmental, Social, and Governance (ESG) reports.
Advantages
- High accuracy and granularity
- Builds engagement with suppliers
- Enables tracking of supplier improvements over time
Limitations
- Challenging to scale across many suppliers
- Data may be confidential, inconsistent, or incomplete
- Requires continuous updating of supplier information
4. The Hybrid Approach
Adopting a hybrid approach allows many companies to maximize their data collection efforts by applying the supplier-specific method for high-impact purchases and using average or spend-based methods elsewhere. This tiered approach enables efficient use of resources while maintaining data quality for critical emission sources.
Where Can You Find Scope 3.1 Data?
Data for scope 3.1 emissions typically resides in procurement and finance functions. Purchase orders, invoices, and supplier contracts often contain critical information such as volume, product category, and spend. However, collecting, organizing, and analyzing this data can be resource-intensive, especially for companies with complex and global supply chains. Data type and availability play a key role in determining the method used for calculating emissions, impacting the accuracy and ability to reduce emissions.
What Are the Challenges in Measuring Scope 3.1 Emissions?
As most organizations will attest, measuring scope 3.1 has many challenges, from resource constraints to data availability. As organizations intensify their climate commitments, they are increasingly confronted with a range of technical, logistical, and strategic barriers that make accurate measurement and consistent reporting difficult. Understanding these roadblocks is critical to developing more resilient and impactful scope 3.1 measurement practices.
- Data availability and quality: Collecting high-quality data is often a bottleneck, with many organizations lacking the systems to track product-level or supplier-specific emissions. Without the proper tracking in place, emissions calculations rely on less accurate methods, making it difficult to reflect or meet reduction efforts.
- Supplier inconsistencies and allocation complexities: Even when suppliers share emissions data, the methodologies, boundaries, and underlying assumptions across them will vary widely. This adds an extra layer of difficulty to data aggregation. Additionally, the allocation of supplier emissions may vary based on the supplier’s chosen method, such as economic (based on spend and supplier revenue/emissions) or service-level (based on units purchased and supplier output/emissions). These inconsistencies can significantly affect reported totals, making it challenging to compare suppliers.
- Complex, multi-tiered supply chains: Upstream emissions can span multiple suppliers across different geographies and industries. Visibility often becomes cloudier beyond Tier 1 suppliers, making it difficult to account for emissions generated deeper in the value chain.
- Timing and synchronization: Aligning procurement, emissions calculation, and reporting cycles can be challenging. Delays in supplier disclosures or emissions factor updates can create reporting lags and misalignment.
Top Five Strategies to Reduce Scope 3.1 Emissions
Reducing scope 3.1 emissions requires balancing precise measurement with targeted action. This means identifying high-impact categories, collaborating with key suppliers, and harnessing available emissions data to improve accuracy and accountability. Here are five strategies organizations can use to start driving impact:
- Prioritize key categories and suppliers: Not all purchases contribute equally to emissions. Conduct a hotspot analysis to identify the highest-emitting goods or services and prioritize the top suppliers for engagement. Consider prioritizing the share of emissions, the share of procurement spend, and the current methodology type.
- Engage suppliers and set expectations: Encourage suppliers to measure and disclose their emissions, invest in LCAs or PCFs, and set their own science-based targets. Collaborative initiatives, such as supplier engagement programs, can support progress.
- Leverage readily available supplier reports: Many electronic companies, cloud providers, and industrial products provide detailed emissions data through EPDs, LCAs, and specific service emissions reports. For example, AWS and Google offer detailed emissions reports for data hosting and services. Leveraging these can help reduce uncertainty and improve accounting accuracy in software-heavy organizations. However, they should be utilized with caution, as some providers have faced scrutiny in 2026 for reporting efficiency gains without disclosing cloud-specific energy use or the growth in embodied hardware emissions behind it.
- Identify opportunities for low-carbon inputs: The same reports that help improve reporting accuracy can also provide more detail on the material inputs of purchased goods. This level of information can enable organizations to pursue opportunities for lower-carbon inputs to reduce emissions.
- Invest in centralized data systems: A centralized platform for carbon accounting data management can streamline emissions tracking, improve visibility, and enable scenario modeling. Several of the other strategies cannot be as effective without the right tools in place to manage this key information.
Turning Complexity Into Opportunity
Tackling scope 3.1 emissions may feel daunting, but it’s also where some of the biggest climate opportunities lie. By investing in better data, fostering supplier collaboration, and integrating sustainability into procurement practices, companies can unlock innovation, resilience, and long-term value. Organizations that lead on scope 3.1 will not only meet emerging disclosure standards but will shape the low-carbon supply chains of the future.
Frequently Asked Questions
What are scope 3 emissions, and why do they matter?
Scope 3 emissions are all the indirect greenhouse gas emissions in a company's value chain, everything from raw material extraction and purchased services to product use and disposal. They matter because they're usually the majority of a company's footprint. They also fall outside a company’s direct control, which makes them the hardest to measure and the most scrutinized by regulators and investors.
What is included in scope 3.1 emissions?
Scope 3.1 covers the cradle-to-gate emissions of everything a company buys, i.e. all emissions generated up to the point of delivery. That includes raw materials, intermediate goods like steel and electronic components, packaging, office equipment, professional services, and cloud computing. It captures the supplier's extraction, energy use, manufacturing, waste, and transport. It does not include emissions from using or disposing of your own products, which sit in other scope 3 categories.
What are the methods for calculating scope 3.1 emissions?
There are four. The spend-based method multiplies spend by an emissions factor per dollar, which is fast, scalable, and the usual starting point. The average-data method applies industry emissions factors to physical quantities, like kilograms of steel. The supplier-specific method uses actual supplier data such as LCAs, EPDs, or product carbon footprints, and is the most accurate. Most companies land on a hybrid, the final method, which takes supplier-specific data for high-impact purchases and uses estimates elsewhere.
How can companies reduce scope 3.1 emissions?
Start with a hotspot analysis to identify where emissions are coming from. This will usually show that a small share of suppliers and categories drives most of the footprint. From there, engage those suppliers on measurement and targets, use supplier reports and EPDs to replace estimates with real data, and use that detail to identify lower-carbon inputs. Centralized carbon accounting data makes each of these repeatable rather than a one-off exercise.
Do AI data centers' hardware purchases count as scope 3.1 emissions?
Yes, for a data center operator, servers and chips are purchased goods, and therefore count in scope 3.1.
Direct Air Capture, Simply Explained
Key Takeaways
- Emissions cuts alone are not happening fast enough to meet global climate goals. Direct air capture (DAC) removes carbon dioxide (CO2) that is already in the atmosphere. It has become one of the fastest-growing carbon removal approaches even as it stays capital-intensive.
- DAC's core advantage is flexibility. Because the atmosphere fully mixes within about two weeks, a DAC facility can be sited almost anywhere with clean power and CO2 storage and still deliver the same climate benefit.
- DAC investment has grown to roughly US$2.2 billion across 37 specialized companies since 2021. Per-tonne costs (currently US$500–1,000 or more) remain the technology's central barrier to scale.
- US federal support for DAC is still unsettled. The US Department of Energy cut its regional DAC hub program from a planned US$3.5 billion to roughly US$1.2 billion between October 2025 and April 2026. This is a signal that deployment funding, not the underlying science, is DAC's biggest near-term risk.
What Is Direct Air Capture?
Direct air capture (DAC) works by sucking in air, filtering it to remove CO2 that has built up over time and still sits in the atmosphere. To be effective, DAC must draw a lot of air into separating equipment like filter banks or cooling towers. This is similar to the small-scale systems that have scrubbed CO2 from air in spacecraft and submarines for decades. From there, CO2 filtering typically involves a chemical process that binds the CO2 for release later. While the most commonly used chemical compounds in this process are liquid solvents or solid sorbents, other chemical, electrical, and physical processes could also work.
After the filtering process, the captured CO2 is usually stored in one of two ways. The most important is geological storage, which keeps CO2 out of the air and oceans indefinitely in deep geological formations (typically a mile down or more) and offers the clearest climate benefits. The second is storing the CO2 in products like concrete, which offers clearer commercial benefits. A new generation of mineralization projects is expanding this second pathway, turning captured CO2 into building materials rather than only storing it underground. In addition, CO2 can be recycled into fuels and chemicals, which prevents net-new CO2 from being released but does not count as a carbon removal solution since these materials are eventually used, releasing the captured CO2 back to the atmosphere.
The Advantages of Direct Air Capture
DAC has many advantages as a CO2 removal approach. First and foremost, it's scalable. In effect, there are no practical limits to our ability to scrub CO2 from the sky or store it in deep geological formations around the world. This means scaling can be fast and removals profound.
It's straightforward. The devices remove CO2 from the air, a meter measures it, and operators store and monitor that CO2. It's clearly additional (meaning it only happens with financial and human intervention), easily verified, and durable (stored for many hundreds of years or more), meeting the bar set by our own Criteria for High-Quality Carbon Dioxide Removal.
It has a small physical footprint. Typical DACe systems do the carbon removal work of trees with 1,000–2,000 times less space. This leaves more room for conservation, agriculture, rewilding, and other important work.
It can be done anywhere with low-carbon energy and CO2 storage options. Globally, our atmosphere mixes fully every two weeks, meaning that CO2 released in China or Australia arrives over the US (and vice versa) in this amount of time. Because of this, DAC facilities can be sited anywhere and still have a climate benefit—as long as there is sufficient clean energy available and options for CO2 storage or use are nearby. This reduces competition for land and provides opportunities for economic development in regions with the right resources.
Finally, and most critically, DAC is a backstop technology. While reducing emissions remains the top priority, there are certain types of emissions that are either very hard or very expensive to abate. The last fraction of hard-to-abate emissions can be managed through DAC, effectively capping global costs to reach net-zero emissions. In fact, the more rapidly DAC scales and deploys, the less total energy and cost are needed to achieve key climate goals.
Challenges and Concerns of Direct Air Capture
Like all climate mitigation approaches, DAC has challenges. The primary challenge today is cost. Today's large-scale systems cost roughly US$500–1,000 or more per tonne of CO2 removed, depending on the technology and site, though several developers are targeting US$100–150 per tonne over the next 10 years. Although the costs will come down over time through deployment and wider adoption, today's high costs are a barrier to investment and deployment.
Another challenge is around the energy requirements associated with DAC. Pulling one million tonnes per year of CO2 out of the air requires roughly 200–300 megawatts of zero-carbon energy (a combination of heat and electricity). Given the limited supply of zero-carbon energy available today, there is a valid question about whether this is the best use of that resource today.
Finally, there is the question of environmental risks and community burdens of DAC. Experience to date suggests that the total environmental burdens and consequences of this pathway are among the lowest of any clean energy and climate technology. But since DAC systems involve heavy equipment and chemicals, questions about the full environmental risks and burdens to communities remain, especially given its limited commercial deployment. Although most DAC systems will be sited in remote locations, not near communities, and pose no serious environmental risks, reasonable concerns must be addressed before permitting and building future DAC projects.
Why the Excitement Now?
Although current climate science and added urgency from organizations like the Intergovernmental Panel on Climate Change (IPCC) have driven interest in DAC, other important advances have fed broad interest and excitement about its potential. Since 2017, DAC technology has matured greatly, including the deployment and operation of many projects around the world. Costs have dropped, new pathways have opened, and private investment in DAC-specific companies has reached roughly US$2.2 billion across 37 companies since 2021.
Two large facilities illustrate where deployment stands today. Climeworks' Mammoth plant in Iceland has been operating since May 2024, although not at full capacity. Occidental's Stratos plant in Texas remains delayed past its most recent 2026 second quarter target due to a component issue, with no confirmed new startup date as of this writing. Both facilities carry substantial commercial offtake agreements from aviation, energy, insurance, and tech companies, agreements that continue to hold even as construction timelines have slipped.
In part, interest results from new policy advancements. In the US, the Inflation Reduction Act's 45Q tax credit, maintained under the 2025 One Big Beautiful Bill Act, currently provides US$180 per tonne for DAC paired with dedicated geologic storage, with added parity for utilized CO2. The Department of Energy's Regional Direct Air Capture Hubs program, originally planned at US$3.5 billion, was cut back sharply in an October 2025 review. It was then partially restored in April 2026 when the Department of Energy confirmed its two flagship projects, Project Cypress in Louisiana and the South Texas DAC Hub, would proceed. The program's total is now expected to be near US$1.2 billion. In addition, California has amended its Low-Carbon Fuel Standard to allow DAC as a compliance mechanism, and the US Department of Energy has explored a pilot program to purchase valid, durable carbon dioxide removal, including DAC. Recently, the Carbon Dioxide Removal Leadership Act was introduced to Congress, which would require the Secretary of Energy to remove CO2 directly from ambient air or seawater.
Other programs around the world reflect this growing interest. In the UK and EU, governments have promised CO2 removal purchases this decade, which will likely include DAC. Research programs have begun in Canada, the UK, Germany, Japan, and China. Developing nations increasingly see DAC as a potential new industry and hope to take advantage of their natural resources to expand energy access while being paid to remove CO2 from the air and oceans.
The Future of Direct Air Capture
I'm pleased to have played a small role in DAC's new prominence. I've had the good fortune of being at DAC project groundbreakings and ribbon cuttings, led the first-ever government grants program for DAC, worked with scientists to develop new DAC technologies, published analysis over a decade ago on the need for DAC, and testified before the US Congress on the benefits and needs of DAC on three separate occasions. Based on my experience in DAC over the last 16 years, I believe that smart investment, policy, deployment, and community engagement will convert the promise of DAC into thousands of projects. These projects will help avoid the worst outcomes of climate change and restore some natural balance to the world. With federal support now concentrated on fewer, better-resourced flagship projects, rather than spread across two dozen early-stage hubs, the DAC field is being pushed toward fewer high-profile delays and more repeatable, bankable deployments.
Frequently Asked Questions
How does direct air capture differ from capturing carbon at an industrial site?
Industrial, or point-source, capture removes CO2 at a smokestack, where concentrations are high. Direct air capture removes CO2 that is already spread throughout the open atmosphere. DAC facilities can operate almost anywhere with available clean power and storage, not only next to a specific emitter.
Is direct air capture actually operating today, or is it still experimental?
Direct air capture is operating today; it is not just experimental. Climeworks' Mammoth plant in Iceland has been running since May 2024, and dozens of smaller facilities are active worldwide. However, the largest US projects, including Occidental's Stratos plant in Texas, are still working through startup delays. Once it begins operating, DAC will be fully commercial, although limited in deployment.
How much does it cost to remove one tonne of CO2 with direct air capture?
Current large-scale direct air capture systems cost roughly US$500–1,000 or more per tonne of CO2 removed, depending on the technology and facility site. Several developers are targeting costs of US$100–150 per tonne later this decade, though that has not yet been demonstrated at commercial scale and is likely to take 10 years or more to achieve
Does using direct air capture reduce the need to cut emissions?
No. Direct air capture is a backstop for emissions that are difficult or costly to eliminate outright, not a substitute for cutting emissions in the first place. Reducing emissions remains a priority; DAC addresses both what is left over (residual emissions) and what’s already in the air and oceans.
Carbon Removal, Reduction, and Avoidance Credits Explained
Key Takeaways
- Trust in carbon credits remains low. In part, this is because many mistakenly treat every credit type as interchangeable.
- Reduction, removal, and avoidance credits are verified against fundamentally different baselines, so credit quality must be judged based on type and project specifics, never with one blanket standard.
- The Integrity Council for the Voluntary Carbon Market's Core Carbon Principles now give buyers an independent bar to check against, including 44 methodologies approved across 13 eligible crediting programs, as of August 2026.
- Removal credits still make up only 5–6% of the market, even as compliance-driven demand accelerates, per our 2026 State of the Voluntary Carbon Market report.
Three Types of Carbon Credits: Reduction, Removal, and Avoidance
A carbon credit is a mechanism that allows one party to compensate another for their carbon mitigation activities. Based on their net emissions impact, there are three types of carbon credits: reduction, removal, and avoidance.
- Reduction credits reflect activities that decrease greenhouse gas emissions, compared to prior practices.
- Removal credits reflect activities that remove carbon dioxide already present in the atmosphere and oceans and lock it away for decades, centuries, or millennia.
- Avoidance credits reflect activities that prevent greenhouse gases from being emitted in the first place. For all three types, credits are assessed and issued by measuring or estimating how much carbon is reduced, removed, or avoided as a result of a credit purchase and its associated activities.
While credits are assessed in different ways depending on the type, one of the most important indicators of quality is a project's baseline - the emissions that would be present in a business-as-usual scenario, without action being taken to reduce, remove, or avoid them. Project developers use baselines as a means of comparison to assess the net emissions impact of a project.
- Baselines must be accurately set and data-driven.
- Emissions impacts of a project must be correctly calculated against its baseline.
Reduction, removal, and avoidance projects involve very different activities and, for some types of projects, it may be more challenging to establish an accurate baseline. However, without accurate baselines, climate impacts cannot be reliably determined.
Across the voluntary carbon market, Reduction credits represent roughly 20% of the purchases. Removal credits represent roughly 5% of the purchases. The remainder, roughly 75%, are avoidance credits.
Carbon Reduction Credits
Carbon reduction must drive the majority of our push to net zero, but translating carbon reduction activities into carbon credits that can be purchased is challenging. Examples of activities represented by carbon reduction credits include reducing fossil fuel use by improving fuel efficiency, or programs that reduce the methane that is generated from farms or municipal waste processing.
Reduction credits are measured and quantified against the baseline emissions of an existing technology or process. Some reduction credits are easy to track and measure, such as efficiency investments or destruction of fugitive methane. Other projects are more complex. For example, low-emission cookstove projects in developing regions rely on tracking patterns of cookstove use and quantifying emission factors for various fuel and stove combinations, both of which are hard to do. The result, as studies have shown, sometimes leads to overcrediting in reduction projects.
Superpollutant Credits
One class of reduction credit, superpollutant credits, has garnered recent attention. These credits involve the reduction of non-CO2 greenhouse gases with very strong radiative forcing, such as methane, nitrous oxides, or fluorinated gases like chlorofluorocarbons. These are not a substitute for CO2 removal, but can provide rapid and profound reductions at modest cost. Many different kinds of superpollutants exist in today’s market, worth roughly $60M today. Recent purchases by tech companies and others have highlighted the potential of these reduction credits.
Another class of reduction credit, transition credits, involves the deliberate early closure of emitting assets like coal-fired power plants or heavy manufacturing facilities. Early efforts by governments, banks, and companies around the world under the Just Energy Transition Partnership agreement jump-started transition credits as a concept at COP26. The Kinetic Coalition, in partnership with many groups including Relae, has launched work to bring transition credits to market with several pilot efforts, including closing a coal plant in the Philippines 10 years early.
Carbon Removal Credits
Projects that remove carbon come from a diverse set of solutions, from nature-based solutions like reforestation, to hybrid solutions like biochar, to engineered solutions such as direct air capture and storage. Roughly 5–6% of credits on the voluntary carbon market today are classified as removals, up from roughly 3% a few years ago.
Carbon removal baselines are determined differently depending on whether a project uses an engineered, hybrid, or nature-based solution. For engineered removals, the baseline is zero, because no carbon removal was occurring in the absence of the project. The credited removal will be the difference between the quantity of carbon removed and any emissions that occur to facilitate the removal (determined through a carbon credit life cycle assessment). Baselines for hybrid and nature-based removals can be more challenging. In natural systems, changes in carbon stocks created by removals must be measured and approximated over time, and creditable removals represent the additional carbon removed by the intervention relative to the baseline (e.g., fallow land versus a reforestation project).
Another important consideration for carbon removal credits is project durability, a measure of the likely duration of carbon storage. Stored carbon can re-enter the atmosphere either through deliberate actions (e.g., deforestation) or accidental ones (e.g., wildfires). Nature-based removals are especially vulnerable to being re-released and are usually considered less durable (i.e., stored for less than 50 years). In contrast, engineered solutions offer high durability (i.e., stored for hundreds to thousands of years), and hybrid removals also offer durability periods that are typically longer than those of nature-based removals.
While less durable, nature-based solutions are effective, cost-effective, and widely available today. They made up over 95% of all carbon removal credits issued in 2025. Engineered and hybrid solutions are more expensive and scarce but offer longer durability. Prices of engineered carbon removal are likely to fall with innovation and increased market participation, but are currently much higher than most nature-based credits. With SBTi's finalized Corporate Net-Zero Standard V2.0, this balance is likely to shift. Large companies must now purchase removal credits covering 1–100% of scope 1, scope 2, and scope 3 emissions between 2035 and their net-zero year, with an explicit focus on more durable CO2 removal credits.
Carbon Avoidance Credits
Examples of carbon avoidance include avoiding deforestation that would result in the release of carbon dioxide into the atmosphere or clean energy projects that avoid the release of emissions from burning fossil fuels in possible facilities. This can be confusing, since many avoided credits are called reduction credits, as is the case with projects under the Reducing Emissions from Deforestation and Forest Degradation (REDD+) framework. Avoidance credits make up roughly 75% of certified credits on the voluntary carbon market today - an overwhelming majority - in part due to high availability and low price.
Avoiding emissions is an important goal with numerous environmental, climate, community, and other benefits. Relae works with clients and customers across industries on developing and implementing strategies to avoid emissions within their value chain. However, there are significant challenges with the way that many carbon avoidance credits are created.
- Carbon avoidance credits are based on an estimate of the emissions that might have existed had a project not been funded. Because it is impossible to observe what might have happened in the absence of a project, carbon avoidance estimates are determined by considering historic data and contextual information. Statistical models can be used to create a presumed baseline that represents what would have happened in the absence of the project.
- Because the baseline is not observed in an avoided emissions project, there is uncertainty in calculating the number of carbon credits it produces. If the baseline is not set accurately, a project can overcredit. While the lack of a directly observed and measured baseline means avoidance credits will always have some degree of uncertainty, high-quality avoidance projects present compelling evidence to support their baselines, greatly reducing uncertainty.
New datasets, statistical techniques, and methodologies are providing opportunities for developing avoidance credits with more certainty. Three REDD+ methodologies have now cleared the Integrity Council for the Voluntary Carbon Market (ICVCM) assessment for its Core Carbon Principles (CCPs), a concrete sign that credit quality standards for avoidance projects are maturing.
Defining and Standardizing Quality in the Voluntary Carbon Market
Carbon credits are intended to reduce, remove, or avoid emissions. They pay for an environmental service that must be delivered. Companies working to generate climate benefits through credit purchases must grapple with the differences and uncertainties of credit quality to ensure that the intended benefits are realized.
While high-quality credits exist for all types of projects, a rich understanding of the differences in methodologies, geographies, physics, and ecology is required to identify high-quality projects and understand varied certainty, durability, and risk terms. Identifying high-quality carbon projects demands extensive and project-specific diligence beyond carbon market certification.
Our own diligence work reveals that high-quality projects can be hard to find. Fewer than 10% of the carbon removal projects we assessed for our 2026 State of the Voluntary Carbon Market report met our quality criteria. This diligence work now has an additional, independent backstop. As of August 2026, the ICVCM has approved 44 methodologies across 13 programs, as eligible for its CCP label, including ACR, Gold Standard, and VCS. For buyers, considering projects that are CCP-eligible should be used as a first filter—not a substitute for project-level diligence, but representing a legitimate floor.
While realized emissions impacts may be difficult to prove in some cases, it is important to remember that some projects provide additional co-benefits. REDD+ projects, for example, may have a positive impact on conservation and biodiversity, and cookstove projects may offer clear human health and social welfare benefits. However, these benefits should be assessed separately from carbon reduction, removal, or avoidance benefits.
Frequently Asked Questions
What's the difference between a carbon credit and a carbon offset?
A carbon credit represents one verified tonne of emissions reduced, removed, or avoided. A carbon offset describes how a buyer uses that credit, typically to counterbalance emissions it has not yet accounted for. The credit itself does not change type based on how it's claimed.
Which type of carbon credit—reduction, removal, or avoidance—is highest quality?
No single type is inherently highest quality. Each project, regardless of type, is verified against a defined baseline. Quality depends on how rigorously that specific baseline was set and how well the project meets other quality criteria. Removal credits from engineered sources have the most straightforward baseline (zero), and avoidance credits carry the most baseline uncertainty by design, but these are only one determinant of credit quality.
Do carbon removal credits automatically meet the ICVCM’s Core Carbon Principles?
No. The ICVCM assesses methodologies and programs, not individual projects. If a project uses a methodology that is eligible for the CCP label, this can be a useful floor but is not a guarantee of high quality.
How does SBTi's near-term removal mandate change which credits I should buy now?
SBTi's finalized Corporate Net-Zero Standard V2.0 doesn't require removal purchases until 2035, but it sets the ramp now (i.e., 1% of scope 1, scope 2, and scope 3 emissions in 2035, scaling to 100% by the net-zero year). This means the highest-durability removal supply that is scarcest and most in demand today is the same supply that many companies will need later. The SBTi guidelines are still changing, so buyers and project developers must track them closely.
Scope 2 Emissions Explained: Tracking, Reporting, and Reducing Impact
Key Takeaways
- Scope 2 emissions (indirect emissions from energy use) are increasingly critical to address. With surging electricity demand, especially from data centers, scope 2 is a growing share of corporate emissions and a priority for decarbonization.
- Approaches to scope 2 accounting are evolving—and formal changes are now on the table. Both location-based and market-based methods remain accepted under the Greenhouse Gas Protocol. Still, the Protocol's recently closed public consultation proposes more granular approaches, including 24/7 power and carbon matching, that would better reflect the realities of modern power markets.
- Proven decarbonization levers, such as reducing energy use, entering power purchase agreements, procuring green tariffs, and buying high-quality renewable energy certificates, are already available and impactful. Decarbonization, not just measurement, must be the goal. Companies don’t need to wait to decarbonize.
Accounting for Indirect Emissions From Energy Use
As businesses and organizations strive to reduce their environmental impact, carbon accounting has become an essential tool for tracking and managing greenhouse gas (GHG) emissions. Carbon accounting helps organizations measure, report, and mitigate their emissions across various activities. A key framework for categorizing these emissions is the Greenhouse Gas Protocol (GHG Protocol), which classifies emissions into three scopes:
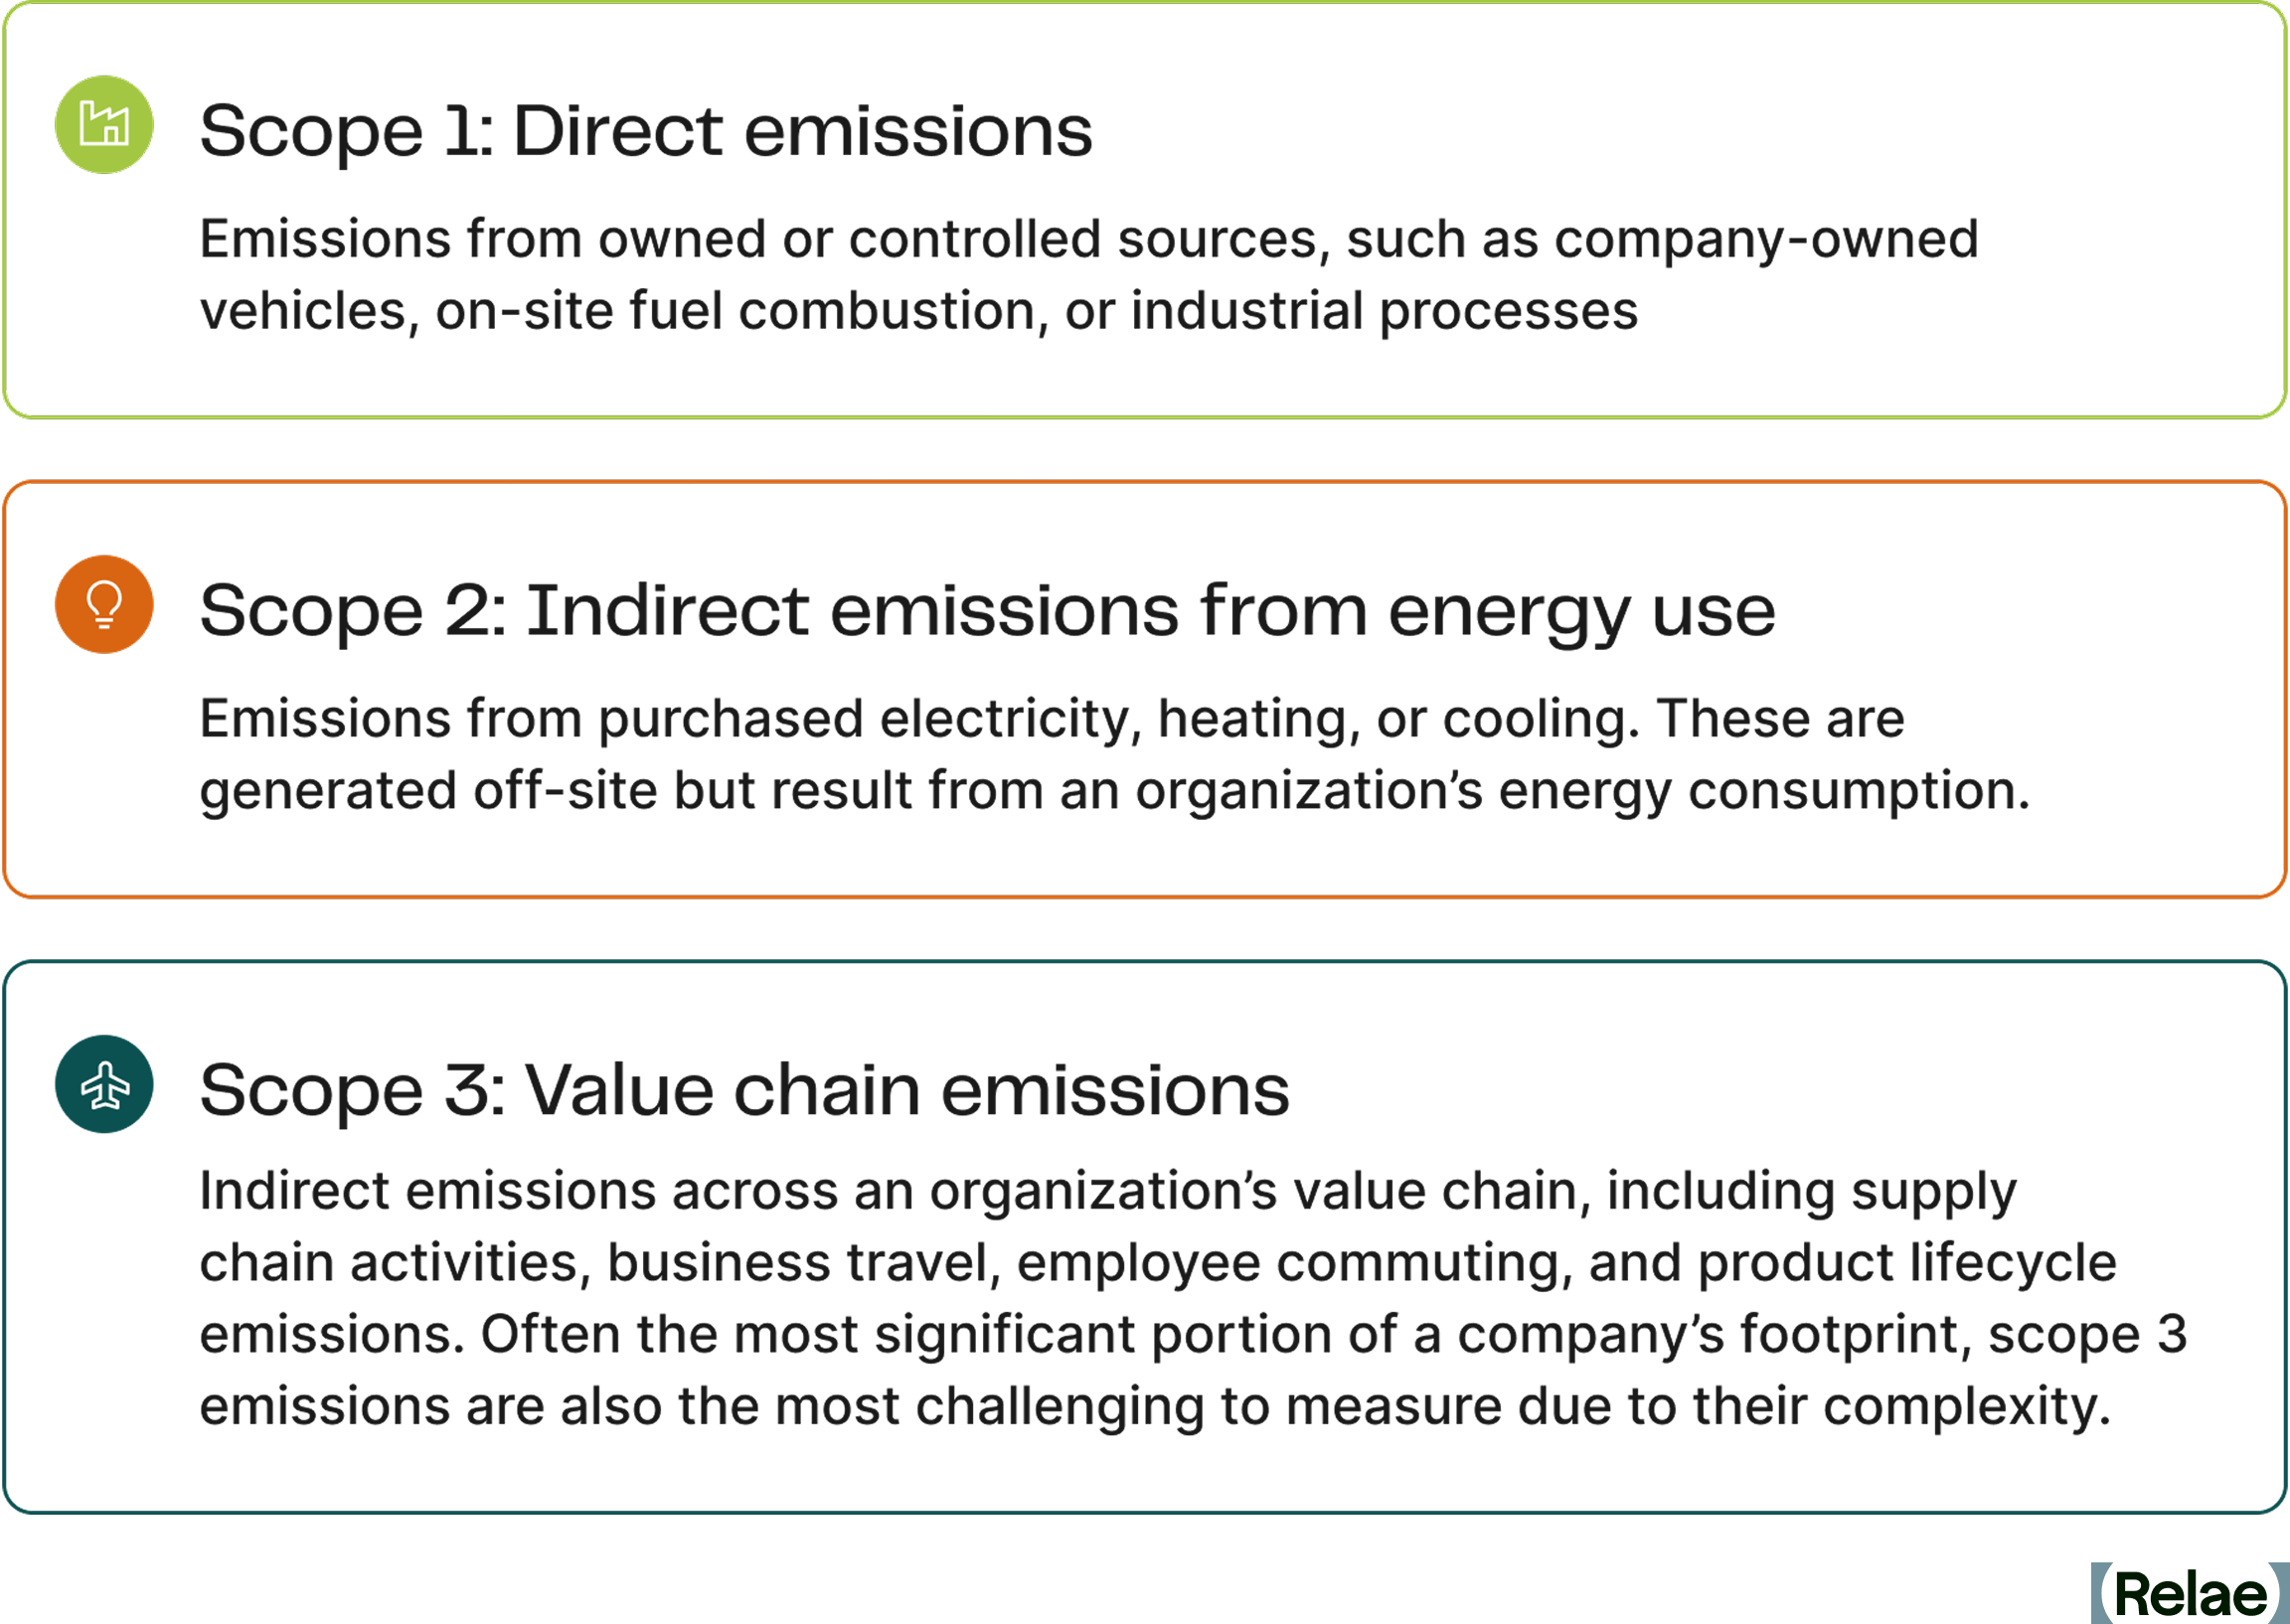
Each scope presents unique challenges and opportunities for reduction. Among them, scope 2 emissions are particularly significant because they stem from purchased energy, which is often generated using fossil fuels. However, numerous reduction mechanisms exist today to help organizations eliminate these emissions, such as improving energy efficiency in order to use less energy, and transitioning to renewable energy sources through market-based mechanisms. Understanding scope 2 emissions is crucial for businesses looking to contribute meaningfully to the global energy transition and achieve sustainability goals.
What Are Scope 2 Emissions?
Scope 2 emissions refer to indirect GHG emissions associated with the consumption of purchased energy. Unlike scope 1 emissions, which result from direct fuel combustion, scope 2 emissions arise from the generation of electricity, steam, heat, or cooling that a company procures from external sources.
The primary sources of scope 2 emissions include:
Purchased electricity: When businesses buy electricity from a utility provider, the emissions from power plants that generate this electricity are classified under scope 2.
Purchased heat, steam, and cooling: Some companies purchase heat, steam, or cooling services instead of generating them on-site. These services often come from centralized facilities that may rely on fossil fuels, thereby contributing to scope 2 emissions.
What sets scope 2 emissions apart from other scopes is the presence of market-based mechanisms that offer multiple pathways for organizations to reduce their carbon footprint. Unlike scope 1, where emissions reductions often require technological shifts or operational changes, scope 2 reductions can be achieved through strategic procurement decisions. The transition to renewable energy sources is an essential component of sustainability strategies, setting the stage for a broader energy transition across industries and economies.
How Are Scope 2 Emissions Measured Today?
The GHG Protocol currently outlines two primary approaches for calculating scope 2 emissions: the location-based method and the market-based method.
Location-Based Method
The location-based method calculates emissions for electricity consumption based on the average emissions intensity of the grid where the energy consumption occurs. This approach is mandatory under various reporting frameworks and does not take into account a company’s procurement choices.
- Relies on grid averages: Emissions are calculated based on regional grid emissions factors rather than specific energy purchases.
- Time-delayed data: Since grid emissions factors are typically updated annually, this method may not reflect real-time energy sourcing changes.
- Limited control: Companies using this method have less direct influence over their reported emissions, as they depend on the overall energy mix of their region.
Market-Based Method
The market-based method, on the other hand, reflects an organization’s actual procurement decisions and energy-sourcing strategies. It accounts for specific contracts, such as power purchase agreements (PPAs), renewable energy credits (RECs), and green tariffs, which allow businesses to claim lower emissions from their purchased electricity.
- Reflects company choices: Emissions calculations take into account contractual agreements for renewable energy purchases.
- Mechanism for electricity transition: Encourages organizations to invest in low-carbon electricity options and actively support the transition to renewables.
- Multiple reduction options: Companies can reduce their scope 2 emissions through a portfolio of mechanisms like PPAs, RECs, and green tariffs, making this method a flexible and strategic tool for decarbonization.
While market-based mechanisms provide flexibility in reducing scope 2 emissions, they also highlight the need for more precise and updated carbon accounting methodologies. For example, some decarbonization strategies, such as time-shifting energy consumption to better match renewable generation, are not accounted for under these methods. This and other limitations mean that the traditional methods outlined in the GHG Protocol are increasingly seen as outdated in an era of rapid changes in energy generation and grid dynamics. As a result, the market is shifting toward more advanced power emission accounting methodologies that provide a more accurate reflection of emissions associated with electricity use.
Proposed Changes to the GHG Protocol Scope 2 Guidance
The current GHG Protocol Scope 2 Guidance provides a market-based instrument methodology, originally designed in the early 2000s, that allows US-based companies to procure renewable energy at any point within a year from anywhere in North America and apply it to any of its annual electricity consumption within that same year. This methodology, as written, allows for a potentially significant mismatch of “emissions caused” (by consuming electricity) versus “emissions avoided” (by generating renewable electricity) in that it does not account for any of the realities of electric grids and generators, which vary significantly over different regions, seasons, and time of day.
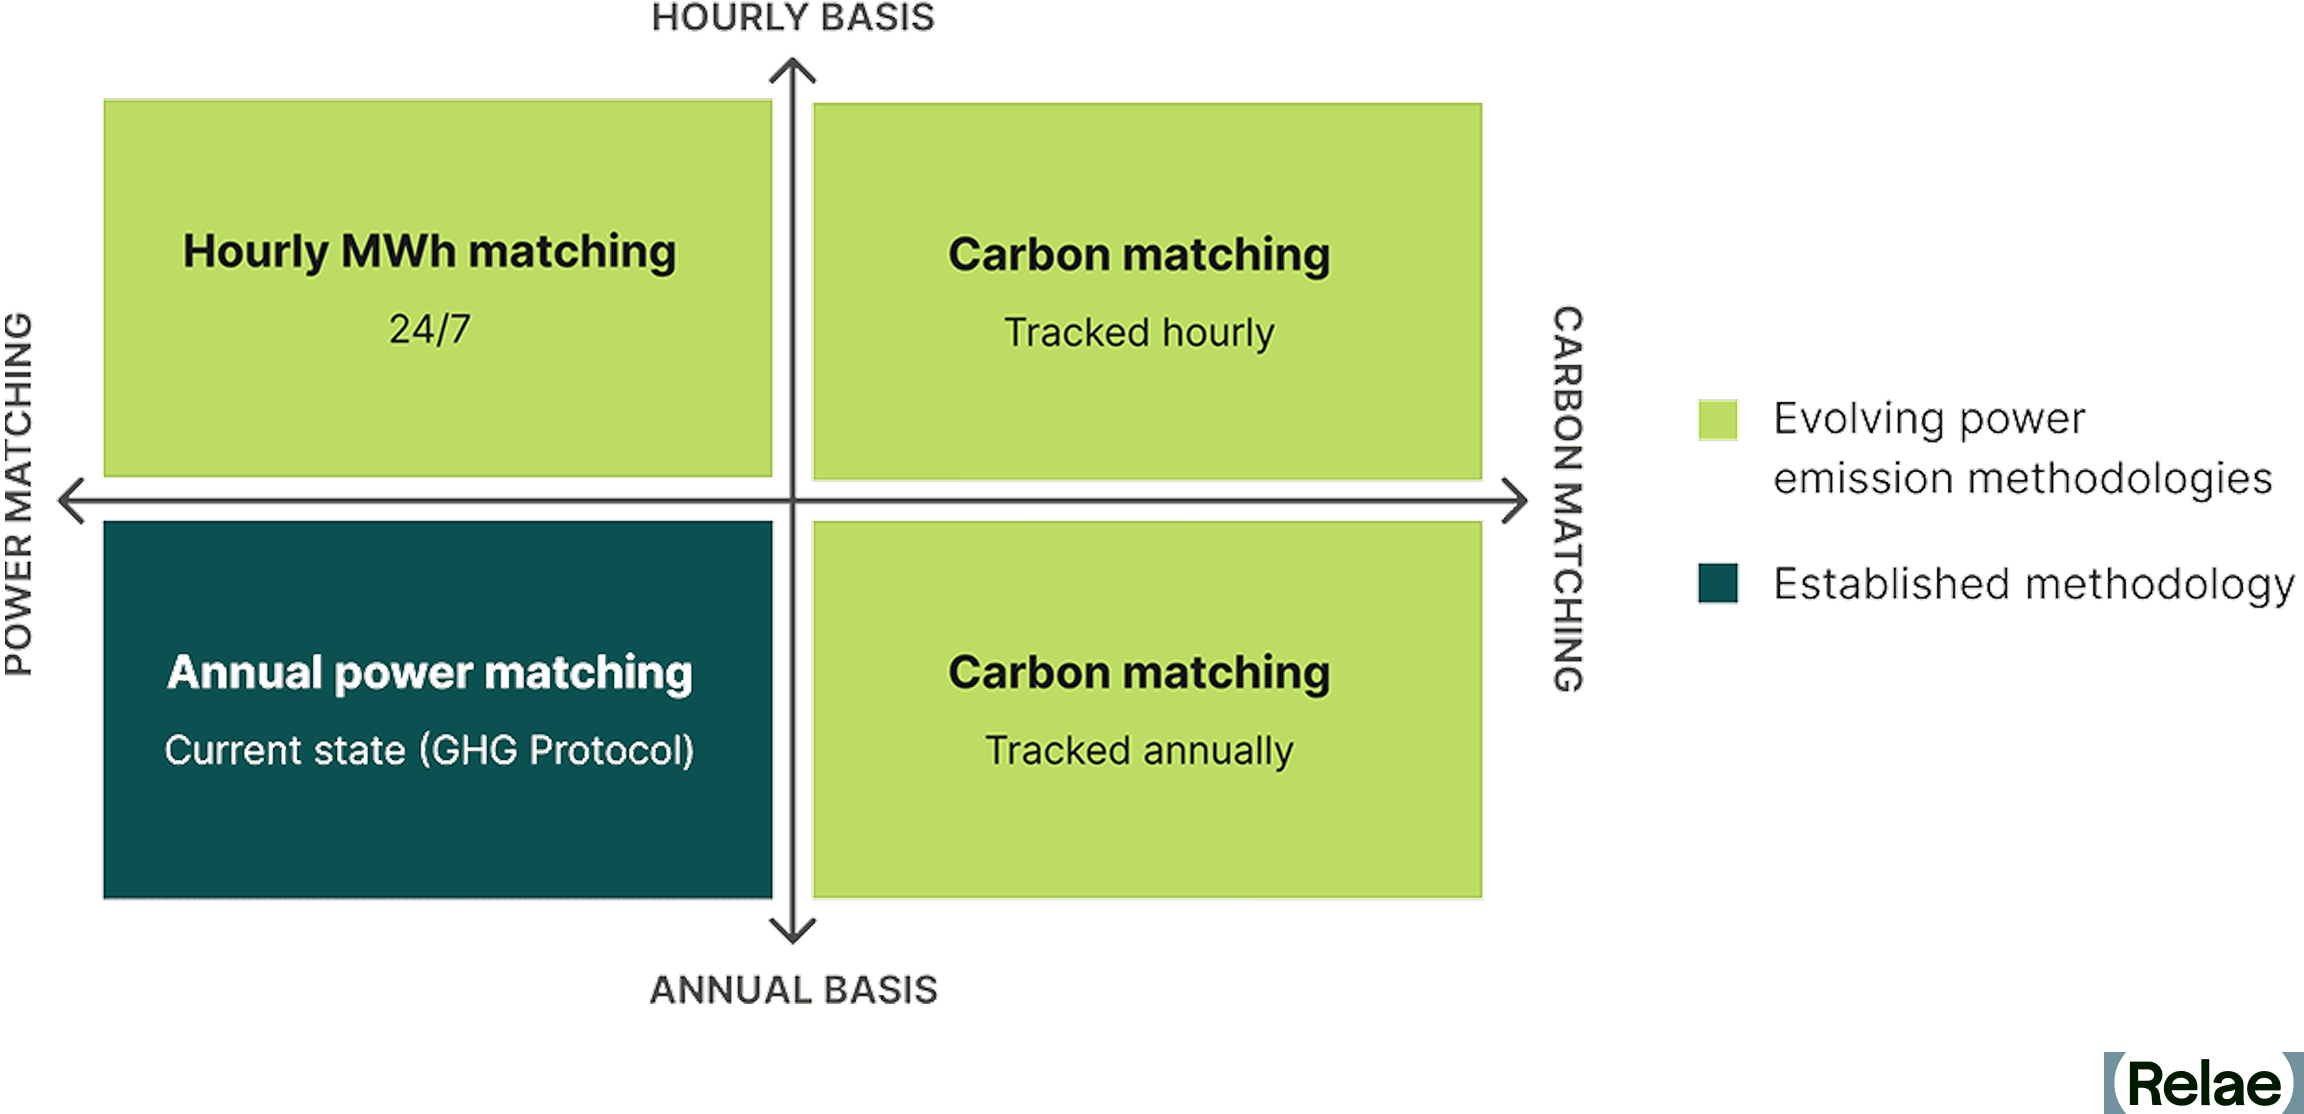
In response to this, the GHG Protocol Scope 2 Guidance is currently undergoing a revision process, which will include how emissions associated with electricity consumption are calculated. A focus of the revision process is on how to better account for the real emissions associated with a corporate’s electricity consumption, and more impactful ways of mitigating them through market-based instruments and other approaches. Advanced power emission accounting methodologies, such as 24/7 power matching and carbon matching, are being explored as ways to better represent the GHG emissions associated with electricity consumption.
- 24/7 power matching emphasizes matching electricity consumption with an equivalent amount of renewable energy production on an hourly basis.
- Carbon matching emphasizes measuring the emissions impact of incremental electricity consumption or production at a specific time.
These emerging methodologies propose a shift toward more granular temporal and region-specific matching, which could require companies to rethink their emissions reporting approach and explore more advanced tracking tools. They may also introduce new strategies beyond market-based instruments for reducing scope 2 emissions, such as time-shifting energy consumption.
As power grids continue to decarbonize and new digital tools emerge, businesses will need to adapt to these evolving methodologies to remain compliant, enhance sustainability strategies, and achieve meaningful reductions in emissions. Companies that proactively integrate advanced power emission tracking into their carbon accounting strategies will be better positioned to lead in the transition to a low-carbon economy.
How to Reduce Scope 2 Emissions
The GHG Protocol provides multiple mechanisms for reducing scope 2 emissions, allowing organizations to shift their energy consumption toward lower-carbon alternatives. These include:
- Reducing energy consumption: Improving energy efficiency in operations can significantly lower electricity use. In some cases, this involves capital investments in more energy-efficient equipment, but in other cases, it can be based on operational changes such as reducing unnecessary lighting, HVAC, and other services during non-working hours. (Electrification efforts, such as shifting from fossil fuel-powered systems to electric alternatives, may actually increase scope 2 emissions, but this can ultimately reduce overall emissions by correspondingly decreasing scope 1 emissions and allowing for renewable energy procurement.)
- RECs: Companies can purchase unbundled RECs (emissions “attributes” separated from the actual electricity product) to offset emissions associated with purchased electricity. While there has been criticism of RECs due to their significant range in quality, high-quality RECs are available, which may include ensuring regional matching, financial additionality, on-line date additionality, or tighter temporal generation to consumption matching. The use of high-quality unbundled RECs is the most accessible and realistic option for most smaller-scale companies to address scope 2 emissions.
- On-site generation and co-location: Installing on-site renewable energy generation, such as solar panels, allows companies to directly offset their electricity consumption from the grid. In some commercial settings, such as companies using leased real estate or co-located data centers, partnering with facilities that prioritize renewable energy procurement can help reduce scope 2 emissions for the facility owner while the facility occupant reduces scope 3 emissions.
- PPAs: Entering into long-term contracts with renewable energy providers ensures companies receive electricity from clean energy sources while supporting the expansion of renewable generation capacity. PPAs are available with standardized contract terms, and some service providers will aggregate demand from multiple smaller companies to reach the minimum required amount for typical PPA contracts. Hedging products are also available to reduce market risks.
- Green tariffs: Many utilities offer green tariffs that enable businesses to purchase renewable energy directly through their electricity provider, often at a premium but with lower emissions impact. For many smaller companies, this is a more viable approach than a PPA with a single renewable generator.
By adopting a combination of these strategies, businesses can significantly lower their scope 2 emissions while aligning with broader sustainability goals and regulatory requirements. The path to decarbonization requires proactive investment in cleaner energy sources, efficient consumption practices, and leveraging market-based instruments to drive the transition toward a low-carbon future.
Why Does Reducing Scope 2 Emissions Matter?
Reducing scope 2 emissions is the underpinning of decarbonizing the power sector and enabling the global energy transition. In 2025, S&P reported that corporate buyers added 15.2 GW of renewable capacity in the US, up from 9.1 GW in 2024, illustrating the growing impact of the corporate sector on the electricity grid. Cleaner grids translate to lower emissions for all energy users. Organizations that actively reduce their scope 2 emissions can contribute to decreasing demand for fossil fuel-based electricity and accelerate the deployment of renewable energy infrastructure.
For companies that own and operate data centers, this transition is especially important. AI data centers consume large amounts of electricity, and their reliance on purchased power makes them a significant source of scope 2 emissions. Since many businesses rely on third-party data center services, reducing emissions from these facilities also helps lower scope 3 emissions across industries. Corporates can influence data centers by requiring that they have a clear and explicit low-emission power strategy in place before procurement.
Beyond direct corporate benefits, reducing scope 2 emissions has a tangible long-term impact on power grids. Increased investment in renewable energy procurement sends a strong market signal, encouraging utilities and developers to expand clean energy projects. As more companies commit to sourcing renewable energy, the overall mix of grid power shifts, making low-carbon electricity more accessible and reducing reliance on fossil fuel-based generation. Ultimately, widespread corporate action in scope 2 emissions reduction supports the broader decarbonization of power markets and strengthens global climate commitments.
Frequently Asked Questions
Will RECs (renewable energy certificates) still count toward scope 2 reductions under the GHG Protocol's proposed changes?
Under the current Scope 2 Guidance, yes—RECs remain a valid market-based instrument. The proposals from the GHG Protocol's recent consultation range from retaining market-based accounting with stricter quality criteria to restructuring how instrument-based claims are reported altogether, and nothing is final until the revised standard is published. What's clear is that scrutiny is rising, particularly for unbundled RECs with weak temporal or geographic connection to a company's actual consumption, so prioritizing high-quality RECs now is the best way to future-proof a procurement strategy.
How would the proposed hourly and regional matching requirements affect companies that rely on unbundled RECs today?
Hourly (24/7) and regional matching would require renewable generation claims to line up much more closely with when and where a company actually consumes electricity. Companies relying on annually matched, unbundled RECs sourced from distant grids would likely see their reported market-based emissions rise under such requirements. The practical preparation is to start collecting more granular (ideally hourly) consumption data and shift toward RECs and contracts with tighter regional and temporal matching.
What's the practical difference between location-based and market-based scope 2 accounting, and will that distinction survive the GHG Protocol's revision?
The location-based method calculates emissions using the average emissions intensity of the local grid, regardless of procurement choices, while the market-based method reflects a company's actual contracts, such as PPAs, RECs, and green tariffs. The consultation explored options from strengthening the criteria for market-based claims to reporting emissions and market instruments in separate, complementary statements. Both concepts will exist in some form, but companies should expect the requirements behind market-based claims to tighten.
When is the new Scope 2 Guidance expected to take effect, and what should companies do now to prepare?
Per the GHG Protocol's July 2026 development plan, a draft of the revised consolidated Corporate Standard is expected for public consultation in 2027, with a final published standard currently estimated for late 2028, and adoption timelines will follow publication. Companies should take action now. Energy efficiency, PPAs, green tariffs, and high-quality RECs reduce real emissions under any accounting regime. Building hourly consumption tracking and auditing the quality of existing REC portfolios now will make any future transition smoother.
How SAF Mandates in the EU and UK Are Reshaping Aviation Fuel Markets
Key Takeaways
- SAF and e-SAF mandates are reshaping the aviation fuel market. The EU and UK impose steep non-compliance penalties, turning regulatory requirements into a strategic lever for those who act early.
- Non-compliance is costly. Penalties run roughly 3 times the cost of compliance in the EU and from about 2 to 13 times in the UK, making long-term planning essential to mitigate risk.
- e-SAF producers have a unique opportunity. Mandates and penalties are shifting the economics of aviation fuel, making e-SAF more attractive despite historically high production costs.
How SAF Compliance Stacks Up
Airlines and fuel suppliers operating in Europe and the UK face growing economic uncertainty due to stringent mandates requiring the adoption of sustainable aviation fuels (SAF) with carve-outs for SAF produced from renewable hydrogen, also known as Power-to-Liquids (PtL) or e-SAF.1 These mandates, aimed at reducing aviation emissions, carry steep penalties (up to 13 times the cost of compliance) for fuel suppliers who fail to meet required quotas. While this creates cost uncertainty for airlines and passengers, it opens a strategic opportunity for e-SAF producers. These producers are challenged by high production costs relative to other SAF on the market and a limited set of buyers that can afford the premium on a voluntary basis.
This piece explores the cost implications for aviation being shaped by these EU and UK SAF mandates and outlines how airlines and suppliers can respond strategically to minimize risk and maximize opportunities. By understanding these dynamics, industry stakeholders can turn regulatory compliance into a source of competitive advantage.
Understanding SAF Mandates in the EU and UK
The EU Commission’s ReFuelEU Aviation regulation, part of the European Green Deal, sets binding targets for aviation sustainability. Beginning in 2025, ReFuelEU mandated that aviation fuel suppliers offer a minimum percentage of SAF and e-SAF at EU airports. By 2030, suppliers must blend at least 6% SAF, including 1.2% e-SAF. To discourage tankering practices (carrying excess fuel for return trips, increasing emissions), ReFuelEU Aviation requires airline operators to refuel at least 90% of their annual aviation fuel needs at a given EU airport before departure.
In parallel, the UK Department for Transport (DfT) mandates a higher SAF blend of 10% by 2030 and places greater emphasis on reducing reliance on hydrogenated esters and fatty acids (HEFA) SAF fuels, which face eventual limitations on feedstock supply. HEFA’s allowable share will decline annually from 100% in 2025 to 42% in 2040. The UK also includes a sub-mandate specifically for PtL SAF.
The Real Cost of Falling Behind on SAF Mandates
The financial impact of these mandates is significant. Each year, the European Union Aviation Safety Agency (EASA) publishes regulatory reference prices for SAF, e-SAF, and conventional jet fuel (CJF) that anchor non-compliance penalties in the EU, most recently the 2025 Aviation Fuels Reference Prices for ReFuelEU Aviation. Using these reference prices for current-year costs and projected production costs or prices for SAF, e-SAF, and CJF from 2030–2050, the following analysis compares EU and UK compliance versus non-compliance penalties, converting all figures to US$/gallon.2
The price gap between SAF and fossil jet fuels remains wide. In 2025, SAF is approximately three times the price of CJF, while e-SAF is nearly twelve times more expensive. Projections indicate this price gap narrows by 2030, but far more for SAF than for e-SAF. The projected price of SAF in 2030 is US$5.46/gallon, more than double the estimated US$2.41/gallon for CJF. The price difference is even greater for e-SAF: with no traded e-SAF market yet, projected 2030 prices span US$5.70/gallon to US$33.00/gallon, with a central estimate around US$18/gallon, or roughly seven times the price of CJF.
Estimated Jet Fuel Prices 2025-2050 (US$/Gallon)
Source: European Union Aviation Safety Agency. 2025 Aviation Fuels Reference Prices for ReFuelEU Aviation. (link); UK Department for Transport. SAF Mandate: Final-stage Cost Benefit Analysis. (link); EUROCONTROL. Aviation Outlook 2050: Main Report. (link)
The mandates carry strict penalties for non-compliance. Penalties for non-compliance in the EU are set at a minimum of two times the price difference between SAF and CJF per gallon of unmet obligation. Additionally, fuel suppliers must supply any unmet fuel obligations in subsequent reporting periods, which pushes the cost of non-compliance in the EU to three times the cost of compliance.
In the UK, penalties work differently: fuel suppliers must pay a fixed buy-out price per megajoule (MJ) of unmet obligation, which translates to US$24.64/gallon of unmet SAF obligation and US$26.08/gallon of unmet e-SAF obligation.3 Because the buy-out is fixed while compliance costs vary, UK penalties range from about 2 times the cost of compliance for e-SAF to 13 times for SAF in later years. The intent is clear: regulators are serious about pushing aviation towards sustainable fuels.
Cost-Comparison of Compliance vs Non-Compliance (US$/Gallon)
Note: The cost of compliance under both mandates is calculated as the price premium of SAF/e-SAF over CJF per ton, using region-specific SAF prices: the EU SAF price reflects HEFA-based supply (ReFuelEU imposes no HEFA cap), while the UK SAF price is a weighted average of HEFA and higher-cost advanced pathways based on the UK's declining HEFA cap. The e-SAF (PtL) price is the same in both regions.
Cost-Comparison of Complicance vs Non-Compliance (US$/Gallon)
e-SAF Has a Policy-Driven Market Opportunity
These price differentials present risk and opportunity. Airlines and fuel suppliers that fall short of compliance will face steep penalties. Those who comply strategically, can mitigate those risks and benefit from financial incentives that help offset higher fuel costs.
Incentive structures support SAF and e-SAF production. For example, the EU’s Emissions Trading System (ETS) has allocated allowances to offset SAF costs, especially for renewable fuels of non-biological origin (or e-SAF). Similarly, the UK offers tradable certificates and has now legislated a Revenue Certainty Mechanism (Sustainable Aviation Fuel Act 2026) that will guarantee SAF producers a set strike price through contracts-for-difference-style agreements, funded by a levy on fuel suppliers, with the first allocation round expected in 2027. The UK’s ETS also provides an indirect incentive as SAF use by airlines lowers compliance costs through reducing required allowances.
Strategic Recommendations for Airlines and Suppliers
To navigate this shifting landscape, airlines and fuel suppliers must think strategically about procurement and compliance, potentially including:
- Proactive procurement: Airlines and fuel suppliers should prioritize securing long-term contracts with SAF and e-SAF producers. Early engagement can help ensure access to limited supply and stable pricing.
- Leverage incentive programs: Actively participate in available incentive schemes, such as the EU ETS and UK tradable certificates, to minimize compliance costs.
- Invest in e-SAF production: Consider strategic investments or partnerships in e-SAF production to align sustainability goals with regulatory requirements and financial incentives.
- Plan for volatility: Develop robust risk mitigation plans, using flexible procurement strategies and financial instruments to buffer against supply chain disruptions and price swings.
Turning Mandates into Market Momentum
As 2030 approaches, the pressure on airlines and fuel suppliers to comply with SAF mandates will intensify. Those who proactively respond to and embrace the mandates can transform regulatory requirements into strategic opportunities. Rather than viewing mandates as burdens, forward-looking stakeholders can use them to drive sustainable innovation and long-term resilience.
The EU and UK mandates for SAF and e-SAF represent an emerging shift in aviation fuel markets. Stakeholders that act now, by engaging with incentives and investing in sustainable fuel solutions, will emerge as industry leaders. Now is the time for airlines, fuel suppliers, and e-SAF producers to act decisively, transforming regulatory compliance from a costly obligation into a clear competitive advantage.
Frequently Asked Questions
What happens if an airline or fuel supplier misses its SAF mandate quota?
Fuel suppliers—the obligated parties—pay a penalty on every unmet tonne: in the EU, twice the price gap between SAF and jet fuel, plus supplying the shortfall in a later period; in the UK, a fixed buy-out price (£0.137/MJ for SAF, £0.145/MJ for e-SAF). Combined, non-compliance runs roughly 3 times the cost of complying in the EU and from about 2 to 13 times in the UK.
What is e-SAF, and how is it different from other SAF?
e-SAF, also called Power-to-Liquid (PtL) fuel, is made from renewable or low-carbon electricity, hydrogen, and captured CO₂ rather than biomass feedstocks. It costs more to produce than conventional SAF today, but both the EU (from 2030) and UK (from 2028) mandates carve out a specific, growing sub-quota for it.
What is the UK's Revenue Certainty Mechanism?
It is a UK government scheme, modeled on the Contracts for Difference structure used in the power sector, that guarantees SAF producers a set strike price for up to 10 years, funded by a levy on aviation fuel suppliers. It became law through the Sustainable Aviation Fuel Act 2026, and the first contract allocation round is expected in 2027.
Is the EU considering changes to its SAF mandate timeline?
The EU has scheduled a formal review of ReFuelEU Aviation for 2027, following calls from airline groups to delay the 2030 e-SAF sub-target. No delay has been adopted, and the European Commission has said it remains "fully committed" to both the SAF and e-SAF mandates and that the 2027 review will evaluate the regulation rather than revise it.
Can corporate buyers still claim SAF benefits from fuel used to meet these mandates?
No, mandated volumes are claimed in the compliance market, so to avoid additionality concerns, voluntary corporate scope 3 claims (typically made through SAF certificates and book-and-claim) must come from supply beyond what the mandates require. As mandate demand grows, the pool available to voluntary buyers tightens, which is why early procurement locks in both supply and price.