



Research, Analysis, & Point of View
Original insights from the Relae team on the forces reshaping power systems, GHG emissions, environmental markets, nature, and the capital and policies behind them.
In-Depth Research
Criteria for High-Quality Low Carbon Fuels 2026
Community Opposition to AI Data Centers: Lessons Learned
Carbon Capture for Gas-Fired Power Generation
Blogs
Who Pays for AI? The Hidden Cost of Rising Data Center Demand
Key Takeaways
- AI data centers are driving the fastest electricity demand growth in decades: US data centers consume an estimated 4 to 5% of US electricity today, projected to reach as much as 9 to 17% by 2030 (EPRI).
- Without deliberate cost allocation, residential and small-business ratepayers subsidize private AI infrastructure.
- Peer-reviewed modeling projects data center growth could raise US power costs 6 to 29% nationally by 2030, and up to 57% in the hardest-hit regions.
- Utility commissioners, state regulators, and policymakers now have working models to draw from, including large-load tariffs, dedicated rate classes, and direct assignment of transmission costs.
AI Data Center Energy Demand Is Testing the Limits of the Grid
AI is driving electricity demand at a pace the US grid has not seen in decades. US data centers already consume an estimated 4 to 5% of the nation's electricity, and EPRI projects that share could reach 9 to 17% by 2030. Behind nearly every AI model and digital product is the invisible infrastructure that powers it: data centers. These facilities are resource-intensive, requiring massive amounts of electricity to power servers, substantial water for cooling, and extensive new grid infrastructure.
In the race to decarbonize the grid, data centers are emerging as a critical pressure point. This infrastructure sits at the intersection of digital growth and climate action, forcing a difficult question: who pays to power AI?
Legacy Utility Models Weren’t Built for this Growth
Utilities must upgrade aging grid infrastructure to meet this new surge in electricity demand, while maintaining reliability. Under legacy utility frameworks, it's often ratepayers who foot the bill for those upgrades. And the costs are not distributed equitably.
Traditional utility planning assumes that increased demand justifies expanded investment in generation and transmission infrastructure. When a new type of large customer, like a tech company, moves into a utility’s service territory, utilities plan new infrastructure to meet that projected demand.
Utilities typically recover the cost of new infrastructure through a process called rate base cost recovery. This allows utilities to charge all customers in the “rate base” for the expenses incurred, including thousands of individuals, families, and small businesses, even when those costs stem from the demands of just a few large users.
This legacy model struggles to keep pace in the AI boom era, where massive new electricity demand can double within a few years, a scale of growth that used to take decades. Additionally, while data centers create short-term construction jobs, there are almost no lasting employment benefits for local communities.
It's clearly inequitable for all ratepayers to bear the costs of upgrading the grid to benefit just a small number of massive data centers. But that's not the only problem. If utilities decide to meet new power demand from large data centers with new fossil fuel generation, such as gas peaker plants, they risk creating stranded assets: infrastructure that becomes obsolete or uneconomical as climate targets, clean energy mandates, or the cost-effectiveness of renewables accelerates. Once built, ratepayers will have to continue paying for these long-lived investments for years, even if they are underutilized or retired early due to policy shifts. This risk is no longer hypothetical: to serve projected data center load, Georgia regulators approved a plan to extend the lives of two massive coal plants to as late as 2038, and Virginia regulators stripped roughly $350 million tied to speculative early-stage data center projects out of Dominion Energy's revenue forecast.
If utilities are locking in decades of new fossil fuel generation to meet short-term data center growth, ratepayers may be left holding the bag for infrastructure that contradicts their climate goals and state mandates, with little ratepayer or community input into the decision. Effectively, local communities may be subsidizing a technology that they did not directly ask for in the first place and has little to no direct community benefits. The result is a long-term misalignment between utility investment strategy and the public interest.
Ratepayers Bear the Cost of Private AI Expansion
The economic burden of data center expansion can fall disproportionately on households and small businesses. But data centers, as the largest and fastest-growing users, often negotiate bespoke contracts, subsidized rates, or fixed-price electricity agreements that shield them from long-term cost volatility.
This can result in other customers, especially residential and low-income ratepayers, bearing a disproportionate share of the infrastructure and maintenance costs. In many states, residential and low-income customers already experience energy cost burdens that exceed affordability thresholds. Adding the weight of infrastructure investments to serve energy-intensive data centers, without sharing those costs equitably, exacerbates an already regressive utility cost allocation system.
Georgia shows how these costs reach ratepayers even when regulators act. Georgia Power customers absorbed six rate increases totaling roughly $43 per month between 2023 and 2025, and while regulators approved a base-rate freeze through 2028, the freeze excluded fuel and storm costs. In 2026 fuel-cost proceedings, testimony showed that large industrial and data center customers raise other customers' monthly fuel costs by 5 to 11%, prompting the Georgia Public Service Commission to open an investigation into how fuel costs are allocated between large loads and residential customers. Ratepayers noticed: in November 2025, both Georgia PSC seats flipped in elections run explicitly on utility bills and data center cost-shifting. In Virginia, regulators approved a rate increase of roughly $16 per month for typical Dominion Energy residential customers amid surging data center demand.
These examples are not anomalies. A peer-reviewed study in Environmental Research Letters projects that data center growth could raise US power costs 6 to 29% nationally by 2030, and up to 57% in the hardest-hit regions, with Virginia among the steepest. This is a systemic shift in energy demand, one that places a growing burden on communities and lacks clear public benefits.
Environmental and Community Impacts Are Mounting
Beyond economic impacts, the geography of data center development reveals another layer of inequity: environmental justice. Data center siting often prioritizes affordable land, low resource costs (e.g., electricity, water), and climate considerations like heat variability. They also rely on proximity to pre-existing fossil fuel generation and transmission infrastructure. Research now confirms the pattern this creates: an analysis of 550 EPA-regulated data centers found that air pollution burdens near data centers rise with the share of people of color living nearby, and a 2026 Washington state study found more than half the state's data centers sit in census tracts with the highest concentrations of people of color.
These communities often absorb the negative externalities beyond their electricity bills, including increased air pollution from peaker plants and on-site diesel or gas backup generators, traffic and construction noise, water stress, and land use changes. Simultaneously, they do not receive direct net positive benefits. Frontline communities are paying attention to this trend, and opposition has become a defining force in where AI infrastructure gets built. Gallup finds 71% of Americans now oppose a data center in their own area, and Data Center Watch counted roughly $130 billion in projects blocked or delayed in the first quarter of 2026 alone. The stakes of community opposition are increasing and intensifying.
The consequences of ignoring communities are now playing out in federal court. At xAI's Colossus facility in Memphis, developers operated dozens of on-site gas turbines without air permits in a majority-Black area already burdened by industrial pollution. After the Shelby County Health Department granted permits for a subset of turbines in July 2025, the fight moved to xAI's second campus across the state line: in April 2026, the NAACP filed a Clean Air Act lawsuit over roughly 27 unpermitted gas turbines at the Colossus 2 site in Southaven, Mississippi, seeking penalties of more than $100,000 per day. On-site power can help reduce demand on the grid, which can be a benefit. But when that generation runs without permits or oversight, nearby communities bear unmeasured health and environmental impacts from hazardous emissions, and the litigation now underway shows how quickly unpermitted power becomes a legal and reputational liability.
To date, data center developers do not appear to have maximized potential community benefits or engagement. Data centers have not typically employed many local residents beyond construction phases, resulting in limited economic benefits, particularly when facility ownership is distant from the local community or has few local ties. When these same communities already experience high pollution burden or economic precarity, the cumulative impact of a new data center can deepen existing vulnerabilities.
Water use is also a mounting environmental justice concern. Many data centers rely on evaporative cooling systems that draw millions of gallons of water per day, and peer-reviewed research finds significant gaps in how the industry discloses its water footprint. In drought-prone regions, this can stress already-depleted aquifers and heighten tensions over water access.
The result is a high-stakes tradeoff between digital infrastructure and local resource resilience, one that communities should be a part of deciding.
States and Regulators Are Writing the New Rules
Virginia, the "Data Center Capital of the World," is home to 674 data centers that consume an estimated 25% of the state's electricity, a share EPRI projects could reach 39 to 57% by 2030, the highest of any state. After legislators considered but did not pass data center bills in the 2025 session, the 2026 General Assembly passed roughly 15 data center bills, including legislation, signed in May 2026, directing regulators to ensure data center costs are not subsidized by other customers, along with new requirements for site impact assessments and water-use reporting. Virginia's State Corporation Commission had already created a dedicated rate class for high energy use customers, with 14-year contract terms and minimum charges that apply whether or not the projected load materializes, and in August 2026 it went further, ordering Dominion to develop a tariff that directly assigns transmission costs to the data centers that trigger them.
Virginia is not alone. Ohio regulators approved a landmark tariff requiring large data centers to pay for 85% of the capacity they request, whether or not they use it. Oregon's POWER Act created the nation's first legislated rate class for data centers. Texas gave its grid operator authority to curtail large loads during emergencies. Minnesota, California, Alabama, Tennessee, South Dakota, Nebraska, and Florida have all enacted their own ratepayer-protection measures, and at the federal level, FERC ordered the nation's largest grid operator to write new rules for data centers that co-locate with power plants, citing the need for consumer protection and clear cost allocation. State energy officials are also proactively planning for data center expansion.
The direction is clear. The unresolved question is whether these reforms move faster than the costs already flowing to ratepayers.
What Is the Public Good of Data Centers?
AI infrastructure powers innovation, job creation, research, and the technologies we rely on every day. But it may also bring inequitable social and direct financial costs. Like highways, factories, and pipelines before them, the question remains: What is the public good of AI data centers? How should we hold data center developers accountable to the public interest, which values a clean energy future? We need clear-eyed assessments of how data centers impact energy affordability, climate progress, and environmental equity.
Yesterday's utility policy frameworks were not designed for hyperscale AI data centers. The reforms now underway are a start, but without sustained attention they may still force the public to subsidize private expansion, through economic and environmental costs, often without equitable community engagement, climate accountability, or local benefit.
AI Data Center Growth Needs Accountability, Equity, and Reform
To align data center growth with the public interest, the stakeholders involved now have proven models to build on:
- Utilities and regulators can require large customers to pay an equitable share of new infrastructure costs, as Ohio's minimum-take tariff and Virginia's dedicated rate class now do.
- Public Utility Commissions can mandate equity and community impact assessments during siting and permitting, following Virginia's new site assessment requirements.
- States can condition tax incentives and zoning approvals on local hiring, emissions reductions, and community benefits agreements.
- Data center developers can prioritize clean power and commit to transparent, equitable community engagement and benefits plans before opposition, litigation, and cancellations decide the outcome for them.
As we build the digital backbone of the next century, we must avoid repeating injustices of the past. A just energy transition requires more than megawatts: it demands equity, policy interventions, and real climate progress.
[cta]
Frequently Asked Questions
How do utilities typically recover the cost of infrastructure built to serve large data center customers, and why does this burden fall on other ratepayers?
Utilities recover infrastructure investments through rate base cost recovery: regulators approve new generation, transmission, and distribution spending, and the costs are spread across all customers in the rate base through their monthly bills. That model worked when demand growth was gradual and diffuse, but when a single data center campus drives hundreds of megawatts of new investment, standard cost allocation spreads those costs across households and small businesses unless regulators adopt a special tariff or rate class that assigns them to the customer who caused them.
What are stranded assets in the context of data center power demand, and how do they create long-term risk for utilities and ratepayers?
Stranded assets are long-lived infrastructure investments, like new gas plants built for projected data center load, that become underused or uneconomical before they are paid off, whether because demand never materializes or because policy and market shifts overtake them. Because utilities recover those costs through rates over decades, ratepayers keep paying even if the asset sits idle. The risk is acute today because data center demand forecasts are highly uncertain: Virginia regulators removed roughly $350 million tied to speculative data center projects from one utility's revenue forecast in 2025.
Why do data centers often locate in rural or low-income communities, and what are the environmental justice implications?
Data center siting favors cheap land, fast permitting, low-cost power and water, and proximity to existing generation and transmission, conditions most common in rural, low-income, and historically marginalized communities. Research confirms the consequences: analysis of 550 EPA-regulated data centers found air pollution burdens rise with the share of people of color living nearby. These communities absorb the air pollution, water stress, noise, and land use impacts while receiving few lasting jobs or direct benefits.
What regulatory or policy tools can states and Public Utility Commissions use to ensure data center growth doesn't unfairly shift costs to residential and small-business ratepayers?
The toolkit has expanded rapidly since 2025. Commissions can create dedicated large-load rate classes and tariffs with minimum take-or-pay provisions, long contract terms, collateral requirements, and exit fees, as Ohio and Virginia have done; directly assign infrastructure enhancement costs to the customers that trigger them; and require site impact assessments during permitting. Legislatures can codify ratepayer protections, require water and load-forecast transparency, and condition tax incentives on community benefits, models now in place in at least eight states.
This commentary reflects public policy analysis and opinion, not legal advice or regulatory determinations.
Scope 1 Emissions Explained: How to Track, Report, and Reduce Operational Carbon
Key Takeaways
- Scope 1 emissions are direct and controllable, making them a powerful starting point for decarbonization.
- Reducing scope 1 emissions can improve energy efficiency and lower operating costs.
- Reporting on scope 1 emissions is now required under new climate regulations, and companies that act now will gain an edge.
Why Scope 1 Emissions Matter Now
When we talk about corporate decarbonization, scope 2 and scope 3 emissions tend to take up the headlines, with a focus on renewable energy certificates (RECs) or challenges like complex supply chains. But scope 1 emissions, those produced directly from sources a company owns or controls, don’t get as much airtime. This is a missed opportunity.
As AI data center growth pushes companies towards on-site power, more organizations are confronting scope 1 boundaries for the first time. Scope 1 emissions enable companies to take immediate, tangible action to cut carbon, drive operational efficiencies, and get ahead of growing regulatory pressure.
What Are Scope 1 Emissions?
Scope 1 emissions are the direct greenhouse gas (GHG) emissions from sources that a company owns or controls. They mostly come from activities where fuels are combusted on-site within an organization’s operations. For industries that combust high amounts of fuels within their operations (e.g., oil and gas, chemicals, manufacturing), scope 1 can represent a significant share of the company’s emissions. For industries that outsource most of their production, scope 1 can be a smaller share of the overall footprint.
Scope 1 emissions typically fall into four categories:
- Stationary combustion: Emissions from burning fuels on-site for heating, manufacturing, or electricity generation. This includes boilers, furnaces, and turbines at company facilities.
- Mobile combustion: Emissions from company-owned or operated vehicles and equipment, such as cars, aircraft, delivery fleets, ships, or construction machinery.
- Fugitive emissions: Unintentional leaks or releases of gases, often from refrigeration and air conditioning systems. These can have an outsized impact because many refrigerants have global warming potentials (GWPs) hundreds or even thousands of times greater than carbon dioxide.
- Self-produced energy: Emissions from electricity, heat, or steam generated on-site, such as through natural gas-fired generators or cogeneration plants, even when the energy is used internally.
Identifying and categorizing scope 1 emissions correctly are the first steps toward uncovering potential operational improvements and carbon reduction approaches.
On-Site Power for AI Data Centers
As AI pushes data center operators toward on-site (“behind-the-meter”) power, a high-stakes accounting question follows: are those behind-the-meter emissions scope 1 or scope 2? The answer comes down to control, not location.
Under the GHG Protocol, emissions from on-site generation are scope 1 only when the reporting company owns or financially controls the generating asset (i.e., the self-produced energy category above). In most data center power deals, a third party owns and operates the generator and sells the electricity to the data center. In that structure, the company buying the power reports the emissions as scope 2, and the company generating the power reports the combustion as scope 1. Given the growth in emissions from the scale of AI infrastructure, getting the boundary right matters for corporate credibility.
Why Scope 1 Emissions Are a Strategic Priority
While scope 3 is often talked about as the largest source of emissions for corporations, that isn’t the case for all industries. For heavy sectors like oil and gas, chemicals, and manufacturing, scope 1 emissions aren't just significant - they are the bedrock of the emissions story. Other industries depend on these sectors' outputs to operate their own businesses, meaning that decarbonizing heavy industries’ scope 1 emissions can also drive reductions across other organizations’ scope 3 emissions.
Since scope 1 emissions are typically within a company’s direct operational control, they present a great starting point for decarbonization. Unlike scope 3 emissions, which require influencing suppliers, customers, or partners, companies can take immediate action on scope 1 sources. Even for industries with relatively small scope 1 footprints, reductions can often happen more quickly through internal decisions, such as equipment upgrades, process improvements, or fuel switching.
Regulatory momentum is also making scope 1 management increasingly urgent. Policies like the European Union’s Corporate Sustainability Reporting Directive (CSRD), California’s Climate Corporate Data Accountability Act (SB 253), and global ISSB-aligned frameworks are requiring companies to measure and publicly disclose their scope 1 emissions. Even within voluntary frameworks, reporting on scope 1 emissions is getting tighter. Within the Science-Based Targets Initiative (SBTi)’s new draft Net Zero Standard, scope 1 emissions must now have a separate target from scope 2 emissions, and the boundary must cover 100% of scope 1 emissions whereas previously the boundary was 95% of emissions. These market shifts highlight the importance of reducing scope 1 emissions.
Operationally, reducing scope 1 emissions offers business value. Many scope 1 reduction strategies, such as upgrading to more efficient equipment or reducing fuel waste can lower energy bills, improve asset performance, and reduce maintenance costs. For companies focused on both sustainability and profitability, targeting scope 1 emissions delivers a strong return on investment.
How to Calculate Scope 1 Emissions
To reduce scope 1 emissions, companies need to know exactly what and how much they are emitting. Calculating scope 1 emissions starts with gathering the right data at the facility level and understanding the activities that generate emissions.
What to Measure
Scope 1 emissions come from activities such as fuel combustion in boilers or vehicle fleets, refrigerant leaks from cooling systems, and on-site energy generation. Ideally, companies should collect activity data, like gallons of diesel used, cubic meters of natural gas consumed, or kilograms of refrigerant leaked and replaced. In cases where direct measurement isn’t possible, companies often rely on estimations, using financial spend data or industry intensity metrics as a proxy for fuel consumption.
Where to Find the Data
Facility-level data is the backbone of comprehensive and comparable scope 1 accounting. Much of the required data can be sourced from utility bills, fuel receipts, maintenance logs for HVAC and refrigeration systems, and reports from on-site equipment operators. Increasingly, companies are deploying sensors to capture real-time data on fuel consumption, refrigerant leaks, and on-site energy generation, improving both accuracy and responsiveness.
How to Calculate the Emissions
Emissions are calculated by applying the emissions factors (i.e., the amount of greenhouse gases emitted per the quantity of fuel or refrigerant) to the collected activity data. Many companies use carbon accounting software to automate calculations, track emissions over time, and ensure consistency with recognized standards like the GHG Protocol. Expert support is often critical, especially for sectors with complex operations. Carbon accounting experts help ensure the data is complete, auditable, and aligned with evolving regulatory requirements.
Accurate scope 1 data builds a strong foundation for compliance as well as for setting credible reduction targets and tracking long-term performance.
How to Reduce Scope 1 Emissions
With scope 1 emissions data in hand, companies can begin identifying and implementing reduction strategies. Because these emissions are within the organization’s operational control, companies often have multiple levers they can pull.
Operational Strategies
- Fuel switching: Replacing fossil fuels like natural gas or diesel with lower-carbon alternatives, like green hydrogen or renewable electricity, can significantly reduce direct emissions from stationary and mobile combustion. Depending on the switch, this could result in higher scope 2 emissions, but these can be more readily addressed through market-based instruments, thus lowering the overall footprint.
- Equipment upgrades: Modernizing boilers, generators, fleets, and other combustion-based equipment can improve energy efficiency and cut emissions. Newer technologies often perform better and emit less.
- Process innovation: In emissions-intensive industries like cement and steel production, rethinking industrial processes can yield dramatic reductions. Low-carbon production methods are increasingly becoming commercially viable.
- Leak detection and repair: Methane leaks from oil and gas operations and refrigerant leaks from cooling systems are major contributors to scope 1 emissions. Deploying monitoring technologies and maintaining rapid-response repair programs can fix leaks before they lead to large amounts of emissions.
Strategic Procurement
- Vendor selection: Companies can prioritize suppliers that offer lower-emissions alternatives for fuels, materials, and services.
- Fleet electrification: Procuring electric vehicles for delivery, service, and logistics fleets reduces both emissions and long-term fuel and maintenance costs.
- Equipment design: Working with suppliers to source modular, emissions-efficient machinery can reduce on-site fuel use and improve flexibility over time.
Driving Innovation Through R&D
- Low-carbon products: Research and development teams can design products and processes that inherently require less energy, or lower-carbon energy, to produce, lowering scope 1 emissions at the source.
- Material innovation: Developing new chemistries or alternative materials can avoid high-emission production methods, contributing to broader decarbonization goals.
- Closed-loop systems: Designing circular, waste-reducing systems can minimize both raw material use and the on-site emissions associated with production and disposal.
Reducing scope 1 emissions often requires up-front investment, whether it’s upgrading equipment, switching to alternative fuels, or embedding low-carbon principles into procurement and R&D strategies. While the initial costs can be substantial, they deliver long-term value through improved operational efficiency, reduced regulatory risk, lower energy expenses, and enhanced brand value in a marketplace that increasingly rewards climate leadership.
Frequently Asked Questions
What are the main categories of scope 1 emissions?
Scope 1 emissions fall into four categories: stationary combustion (fuels burned on-site in boilers, furnaces, or turbines), mobile combustion (company-owned or -operated vehicles and equipment), fugitive emissions (leaks of refrigerants or methane, which often carry outsized global warming potential), and self-produced energy (electricity, heat, or steam generated by equipment the company owns or controls).
Which regulations require companies to report scope 1 emissions, and when do they take effect?
The EU’s Corporate Sustainability Reporting Directive (CSRD) already requires scope 1 disclosure for companies in its first reporting waves. In the US, California’s SB 253 requires companies with over $1 billion in annual revenue doing business in California to report scope 1 and scope 2 emissions, with first reports due November 10, 2026. ISSB-aligned disclosure rules are extending similar requirements across other jurisdictions.
What’s the fastest way for a company to start reducing scope 1 emissions?
Start by measuring at the facility level, since this activity data shows where emissions concentrate. From there, the quickest wins are usually operational, such as repairing refrigerant and methane leaks, upgrading inefficient combustion equipment, and electrifying vehicle fleets, because they sit within the company’s direct control and often pay back through lower fuel and maintenance costs.
Is behind-the-meter power scope 1 or scope 2?
It depends on who controls the generating asset. If a company owns or financially controls its on-site generation, the emissions are scope 1. If a third party owns and operates the generator and sells the power- the structure behind most data center power deals- the buyer reports those emissions as scope 2 under the GHG Protocol’s Scope 2 Guidance.
How SAF Mandates in the EU and UK Are Reshaping Aviation Fuel Markets
Key Takeaways
- SAF and e-SAF mandates are reshaping the aviation fuel market. The EU and UK impose steep non-compliance penalties, turning regulatory requirements into a strategic lever for those who act early.
- Non-compliance is costly. Penalties run roughly 3 times the cost of compliance in the EU and from about 2 to 13 times in the UK, making long-term planning essential to mitigate risk.
- e-SAF producers have a unique opportunity. Mandates and penalties are shifting the economics of aviation fuel, making e-SAF more attractive despite historically high production costs.
How SAF Compliance Stacks Up
Airlines and fuel suppliers operating in Europe and the UK face growing economic uncertainty due to stringent mandates requiring the adoption of sustainable aviation fuels (SAF) with carve-outs for SAF produced from renewable hydrogen, also known as Power-to-Liquids (PtL) or e-SAF.1 These mandates, aimed at reducing aviation emissions, carry steep penalties (up to 13 times the cost of compliance) for fuel suppliers who fail to meet required quotas. While this creates cost uncertainty for airlines and passengers, it opens a strategic opportunity for e-SAF producers. These producers are challenged by high production costs relative to other SAF on the market and a limited set of buyers that can afford the premium on a voluntary basis.
This piece explores the cost implications for aviation being shaped by these EU and UK SAF mandates and outlines how airlines and suppliers can respond strategically to minimize risk and maximize opportunities. By understanding these dynamics, industry stakeholders can turn regulatory compliance into a source of competitive advantage.
Understanding SAF Mandates in the EU and UK
The EU Commission’s ReFuelEU Aviation regulation, part of the European Green Deal, sets binding targets for aviation sustainability. Beginning in 2025, ReFuelEU mandated that aviation fuel suppliers offer a minimum percentage of SAF and e-SAF at EU airports. By 2030, suppliers must blend at least 6% SAF, including 1.2% e-SAF. To discourage tankering practices (carrying excess fuel for return trips, increasing emissions), ReFuelEU Aviation requires airline operators to refuel at least 90% of their annual aviation fuel needs at a given EU airport before departure.
In parallel, the UK Department for Transport (DfT) mandates a higher SAF blend of 10% by 2030 and places greater emphasis on reducing reliance on hydrogenated esters and fatty acids (HEFA) SAF fuels, which face eventual limitations on feedstock supply. HEFA’s allowable share will decline annually from 100% in 2025 to 42% in 2040. The UK also includes a sub-mandate specifically for PtL SAF.
The Real Cost of Falling Behind on SAF Mandates
The financial impact of these mandates is significant. Each year, the European Union Aviation Safety Agency (EASA) publishes regulatory reference prices for SAF, e-SAF, and conventional jet fuel (CJF) that anchor non-compliance penalties in the EU, most recently the 2025 Aviation Fuels Reference Prices for ReFuelEU Aviation. Using these reference prices for current-year costs and projected production costs or prices for SAF, e-SAF, and CJF from 2030–2050, the following analysis compares EU and UK compliance versus non-compliance penalties, converting all figures to US$/gallon.2
The price gap between SAF and fossil jet fuels remains wide. In 2025, SAF is approximately three times the price of CJF, while e-SAF is nearly twelve times more expensive. Projections indicate this price gap narrows by 2030, but far more for SAF than for e-SAF. The projected price of SAF in 2030 is US$5.46/gallon, more than double the estimated US$2.41/gallon for CJF. The price difference is even greater for e-SAF: with no traded e-SAF market yet, projected 2030 prices span US$5.70/gallon to US$33.00/gallon, with a central estimate around US$18/gallon, or roughly seven times the price of CJF.
Estimated Jet Fuel Prices 2025-2050 (US$/Gallon)
Source: European Union Aviation Safety Agency. 2025 Aviation Fuels Reference Prices for ReFuelEU Aviation. (link); UK Department for Transport. SAF Mandate: Final-stage Cost Benefit Analysis. (link); EUROCONTROL. Aviation Outlook 2050: Main Report. (link)
The mandates carry strict penalties for non-compliance. Penalties for non-compliance in the EU are set at a minimum of two times the price difference between SAF and CJF per gallon of unmet obligation. Additionally, fuel suppliers must supply any unmet fuel obligations in subsequent reporting periods, which pushes the cost of non-compliance in the EU to three times the cost of compliance.
In the UK, penalties work differently: fuel suppliers must pay a fixed buy-out price per megajoule (MJ) of unmet obligation, which translates to US$24.64/gallon of unmet SAF obligation and US$26.08/gallon of unmet e-SAF obligation.3 Because the buy-out is fixed while compliance costs vary, UK penalties range from about 2 times the cost of compliance for e-SAF to 13 times for SAF in later years. The intent is clear: regulators are serious about pushing aviation towards sustainable fuels.
Cost-Comparison of Compliance vs Non-Compliance (US$/Gallon)
Note: The cost of compliance under both mandates is calculated as the price premium of SAF/e-SAF over CJF per ton, using region-specific SAF prices: the EU SAF price reflects HEFA-based supply (ReFuelEU imposes no HEFA cap), while the UK SAF price is a weighted average of HEFA and higher-cost advanced pathways based on the UK's declining HEFA cap. The e-SAF (PtL) price is the same in both regions.
Cost-Comparison of Complicance vs Non-Compliance (US$/Gallon)
e-SAF Has a Policy-Driven Market Opportunity
These price differentials present risk and opportunity. Airlines and fuel suppliers that fall short of compliance will face steep penalties. Those who comply strategically, can mitigate those risks and benefit from financial incentives that help offset higher fuel costs.
Incentive structures support SAF and e-SAF production. For example, the EU’s Emissions Trading System (ETS) has allocated allowances to offset SAF costs, especially for renewable fuels of non-biological origin (or e-SAF). Similarly, the UK offers tradable certificates and has now legislated a Revenue Certainty Mechanism (Sustainable Aviation Fuel Act 2026) that will guarantee SAF producers a set strike price through contracts-for-difference-style agreements, funded by a levy on fuel suppliers, with the first allocation round expected in 2027. The UK’s ETS also provides an indirect incentive as SAF use by airlines lowers compliance costs through reducing required allowances.
Strategic Recommendations for Airlines and Suppliers
To navigate this shifting landscape, airlines and fuel suppliers must think strategically about procurement and compliance, potentially including:
- Proactive procurement: Airlines and fuel suppliers should prioritize securing long-term contracts with SAF and e-SAF producers. Early engagement can help ensure access to limited supply and stable pricing.
- Leverage incentive programs: Actively participate in available incentive schemes, such as the EU ETS and UK tradable certificates, to minimize compliance costs.
- Invest in e-SAF production: Consider strategic investments or partnerships in e-SAF production to align sustainability goals with regulatory requirements and financial incentives.
- Plan for volatility: Develop robust risk mitigation plans, using flexible procurement strategies and financial instruments to buffer against supply chain disruptions and price swings.
Turning Mandates into Market Momentum
As 2030 approaches, the pressure on airlines and fuel suppliers to comply with SAF mandates will intensify. Those who proactively respond to and embrace the mandates can transform regulatory requirements into strategic opportunities. Rather than viewing mandates as burdens, forward-looking stakeholders can use them to drive sustainable innovation and long-term resilience.
The EU and UK mandates for SAF and e-SAF represent an emerging shift in aviation fuel markets. Stakeholders that act now, by engaging with incentives and investing in sustainable fuel solutions, will emerge as industry leaders. Now is the time for airlines, fuel suppliers, and e-SAF producers to act decisively, transforming regulatory compliance from a costly obligation into a clear competitive advantage.
Frequently Asked Questions
What happens if an airline or fuel supplier misses its SAF mandate quota?
Fuel suppliers—the obligated parties—pay a penalty on every unmet tonne: in the EU, twice the price gap between SAF and jet fuel, plus supplying the shortfall in a later period; in the UK, a fixed buy-out price (£0.137/MJ for SAF, £0.145/MJ for e-SAF). Combined, non-compliance runs roughly 3 times the cost of complying in the EU and from about 2 to 13 times in the UK.
What is e-SAF, and how is it different from other SAF?
e-SAF, also called Power-to-Liquid (PtL) fuel, is made from renewable or low-carbon electricity, hydrogen, and captured CO₂ rather than biomass feedstocks. It costs more to produce than conventional SAF today, but both the EU (from 2030) and UK (from 2028) mandates carve out a specific, growing sub-quota for it.
What is the UK's Revenue Certainty Mechanism?
It is a UK government scheme, modeled on the Contracts for Difference structure used in the power sector, that guarantees SAF producers a set strike price for up to 10 years, funded by a levy on aviation fuel suppliers. It became law through the Sustainable Aviation Fuel Act 2026, and the first contract allocation round is expected in 2027.
Is the EU considering changes to its SAF mandate timeline?
The EU has scheduled a formal review of ReFuelEU Aviation for 2027, following calls from airline groups to delay the 2030 e-SAF sub-target. No delay has been adopted, and the European Commission has said it remains "fully committed" to both the SAF and e-SAF mandates and that the 2027 review will evaluate the regulation rather than revise it.
Can corporate buyers still claim SAF benefits from fuel used to meet these mandates?
No, mandated volumes are claimed in the compliance market, so to avoid additionality concerns, voluntary corporate scope 3 claims (typically made through SAF certificates and book-and-claim) must come from supply beyond what the mandates require. As mandate demand grows, the pool available to voluntary buyers tightens, which is why early procurement locks in both supply and price.
From Capture-Ready to Capture-Committed: Decarbonizing Natural Gas with CCS
Key Takeaways
- Data centers are driving surging demand for new, firm electricity supply, accelerating natural gas-fired power generation.
- Carbon capture and storage (CCS) offers a practical way to balance long-term climate commitments with the need for new electricity generation in the near term.
- New natural gas-fired power plants must be capture-committed, not just capture-ready, potentially delivering power in 18 months and decarbonized power 18-24 months later.
- Capture-committed plants integrate planning and finance for the CO₂ capture, transport, and storage value chain from the start.
- Relae believes early investment in engineering, infrastructure, and community engagement is essential to meet capture commitments.
A New Era of Electricity Demand and Climate Pressure
The US and much of the developed world are experiencing profound growth in electricity demand. Two main forces are driving this trend: (1) the push to electrify existing uses, such as vehicles and heating, to improve energy security, enhance system efficiency, and reduce air pollution; and (2) the growth of energy-intensive sectors like manufacturing, telecommunications, and AI data centers.
Among these drivers, AI is creating unique demands that catalyze specific investments in electric power generation. Astonishing AI data center buildout, led by a handful of large technology firms (sometimes called “hyperscalers”) and their utility and construction partners, is accelerating energy consumption. These firms prioritize speed. When asked for their top five criteria for bringing new AI infrastructure online, one executive responded: “Speed, speed, speed, cost, and carbon emissions.”
Data centers require reliable, always-on power (referred to as “firm power”). This differs from other use cases, such as residential or commercial, which do not need the same amount of power across all hours. While hyperscalers and their partners are investing in renewables, nuclear, and geothermal energy at a remarkable pace, renewable resources alone do not yet meet the exploding demand for firm power.
Natural Gas Provides Firm Power but Drives Emissions Higher
The mismatch between data center power needs and variable renewable generation is fueling a boom in natural gas-fired power generation. The pipeline of new natural gas-fired power plants is enormous. Plants under construction in 2025 would, by themselves, add roughly 25 million tonnes of greenhouse gases each year to the air and oceans. The full suite of plants in planning is at least 10 times larger. Existing gas plants are also being used more and staying online longer.
.png)
This rapid buildout is creating tension with corporate climate goals. Hyperscalers remain seriously committed to reducing emissions, but their ability to hit those targets is undermined by the need to procure new, large-scale electricity generation quickly.
Carbon Capture Aligns with Data Center Energy Demands
Carbon capture and storage is one way to bridge the gap. Data centers operate continuously and may have the ability to shift or curtail load. This demand profile suits the duty cycles of natural gas turbines and CCS facilities well. The potential to reduce direct emissions is profound: today’s CCS technology can capture 95% or more of CO₂ emissions at competitive costs in many markets.
This has led to a resurging interest in the concept of capture-ready gas power generation. New natural gas power plants can be built and brought online in 18 months. In a capture-ready plant, the developers integrate the necessary interfaces and reserve additional land, water, and energy to enable a carbon capture project to be built at a future date. In favorable locations, carbon capture can be added to a capture-ready plant in 18-24 months.
However, past experience shows that capture-ready plants rarely deliver. The ambition and commitment of the developers were contingent on policy and market signals that were either too small or never materialized. While the base plant may have made economic sense in terms of energy value for investment, it does not appear anyone was willing to pay the climate premium for CCS.
As David Hawkins of the Natural Resource Defense Council famously said, “If your plant is capture ready, my driveway is Ferrari ready.” To bring David’s humorous analogy back to the specifics here: don’t build a new driveway without at least a downpayment on the car.
How to Build Capture-Committed Power Plants for CCS
A better approach is building capture-committed plants, namely facilities that integrate CCS from the start. To be capture-committed, project developers must:
- Identify geologic storage for the many millions of metric tons of CO2 that these plants will produce each year over the next 20-30 years.
- Plan reliable CO₂ transportation from power generation to geologic storage by pipeline, rail, barge, or truck.
- Engage credible vendors of carbon capture technology that serve their needs and fit their goals.
- Fund front-end engineering design (FEED) studies.
- Arrange, or help to arrange, financing for the construction, commissioning, and operation of all necessary components in the CO₂ capture, transportation, and storage value chain.
- Ensure natural gas supply has near-zero fugitive methane emissions.
- Partner with local and frontline stakeholders to incorporate community impact into project planning, design, and financing.
Capture-committed plants send strong market signals. They help build the permitting pathways and develop the workforce, infrastructure, and community acceptance needed to avoid extra expense and delays. Done well, early commitments and investments will likely create repeatable models that reduce build times and costs.
A Path Toward Power That’s Clean Firm and Future-Ready
Eventually more carbon-free power in the form of renewables, nuclear, and geothermal energy will be deployed to serve national and international electric load growth for all types of electrification. Over time, these resources will likely displace natural gas. Until then, hundreds of millions of tons of CO₂ will be emitted each year unless commitments are made to take tangible action now.
Capture-committed natural gas-fired plants offer a pragmatic solution. With the right planning, financing, and community engagement, they can provide reliable power without locking in emissions, and they can deliver enormous benefits compared to uncontrolled operation. Federal and state governments can accelerate this transition by honoring and increasing CCS grants, supporting shared infrastructure, and streamlining permitting for CCS plants as they have for other clean energy supplies. These investments will enable the construction of cleaner, more resilient power infrastructure for the industries driving demand, from AI data centers to heavy industry.
[cta]
Frequently Asked Questions
What is the difference between a capture-ready and a capture-committed power plant?
A capture-ready plant creates an option to add carbon capture in the future, whereas a capture-committed plant treats capture as part of the project from day one. In a capture-ready plant, developers install the right interfaces and reserve extra land, water, and energy, but nothing obligates them to build the capture project, ever. A capture-committed developer secures options for CO₂ transportation and geologic storage, relationships with capture equipment vendors, funding for engineering studies, and financing across the full value chain before the base plant comes online.
Why have capture-ready plants historically failed to add carbon capture?
Nobody was willing to pay the climate premium. Capture-ready developers built plants that made economic sense on energy value alone, then waited for policy and market signals to justify carbon capture. Those signals were either too weak or never arrived, so the option went unexercised and no capture project was ever designed. The base plant runs uncontrolled for decades while the reserved land sits empty. David Hawkins of the Natural Resources Defense Council captured the problem well: "If your plant is capture ready, my driveway is Ferrari ready." Preserving an option costs very little. Exercising it costs a great deal, and capture-ready facilities rarely came with the funding to do so.
If renewables, nuclear, and geothermal will eventually displace gas, why invest in CCS for gas plants now?
Because greenhouse gas emissions happen in the meantime. Gas plants being built today will operate for 20 to 30 years, long before carbon-free resources scale enough to displace them. Left uncontrolled, they will emit hundreds of millions of tons of CO₂ over that span. Capture on those plants avoids most of it. Today's technology can capture 95% or more of CO₂ emissions at competitive costs in many markets.
What can federal and state governments do to accelerate capture-committed projects?
Three kinds of support matter most: funding, infrastructure, and permitting. Governments should honor and extend existing CCS incentives. Developers make capture commitments years before any revenue arrives, so uncertainty in government funding undermines the confidence these projects require. Governments should also support shared CO₂ transport and storage infrastructure. Common pipelines, rail terminals, and storage hubs make it easier for developers to secure physical CO2 offtake. Finally, permitting for CCS should be streamlined the way it has been for other clean energy supplies. Permitting delay is a leading cause of cost overruns, and a capture-committed plant should be able to pursue capture and storage with the same intensity and speed as electricity generation.
Marine Carbon Dioxide Removal: What It Is and How It Works
Key Takeaways
- Marine carbon dioxide removal (mCDR) uses ocean-based processes—primarily ocean alkalinity enhancement (OAE) and direct ocean removal (DOR)—to capture and durably store atmospheric carbon dioxide (CO₂), without the land and freshwater constraints of terrestrial methods.
- The ocean already absorbs roughly 29% of human-caused CO₂ emissions each year, according to the 2025 Global Carbon Budget, and mCDR technologies aim to safely enhance that natural uptake without worsening ocean acidification.
- For corporate carbon buyers and project developers evaluating mCDR, the Criteria for High-Quality Marine Carbon Dioxide Removal, developed by Microsoft and Relae, outlines standards to guide responsible mCDR deployment at scale.
Reducing carbon dioxide (CO₂) emissions alone is no longer sufficient to limit global warming to 1.5°C. To effectively address climate change, scientific consensus highlights the need to remove carbon dioxide already present in the atmosphere. Marine carbon dioxide removal (mCDR), a form of ocean-based carbon removal, offers a scalable solution by leveraging the ocean’s natural ability to absorb and store carbon, without the land and resource limitations associated with terrestrial carbon removal methods.
This guide explores the fundamentals of marine carbon dioxide removal, including how it works, the technologies involved, and its role in global decarbonization.
What Is Marine Carbon Dioxide Removal?
Marine carbon dioxide removal uses ocean-based processes to capture and store carbon dioxide from the atmosphere. mCDR techniques fall into two primary categories:
- Biotic CDR, which includes using photosynthetic fixation, microalgae cultivation, and terrestrial biomass sinking, to capture and store carbon.
- Abiotic CDR, which influences CO₂ concentrations and carbonate chemistry in the seawater to absorb atmospheric CO₂ without increasing acidity. There are two main abiotic mCDR pathways: ocean alkalinity enhancement (OAE) and direct ocean removal (DOR).
How Does Marine Carbon Dioxide Removal Work?
Marine carbon dioxide removal functions via the air-sea gas exchange—a process by which the atmosphere and surface seawater maintain equal CO₂ concentrations—meaning a shift in one leads to a corresponding change in the other. This exchange allows the ocean to absorb or release CO₂ back into the atmosphere depending on concentration levels and factors like pH.
Once absorbed by the ocean, CO₂ exists in several forms, including dissolved CO₂, carbonates, and bicarbonates, influencing the ocean's pH levels. As atmospheric CO₂ levels rise, the oceans absorb roughly 12 GtCO2 annually, approximately 29% of anthropogenic CO2 emissions. This increase is disrupting the natural CO₂ balance and contributing to ocean acidification.
mCDR methods like ocean alkalinity enhancement and direct ocean removal use safe and controlled processes to increase the amount of CO2 absorbed from the atmosphere while mitigating acidification.
Understanding Ocean Alkalinity Enhancement (OAE)
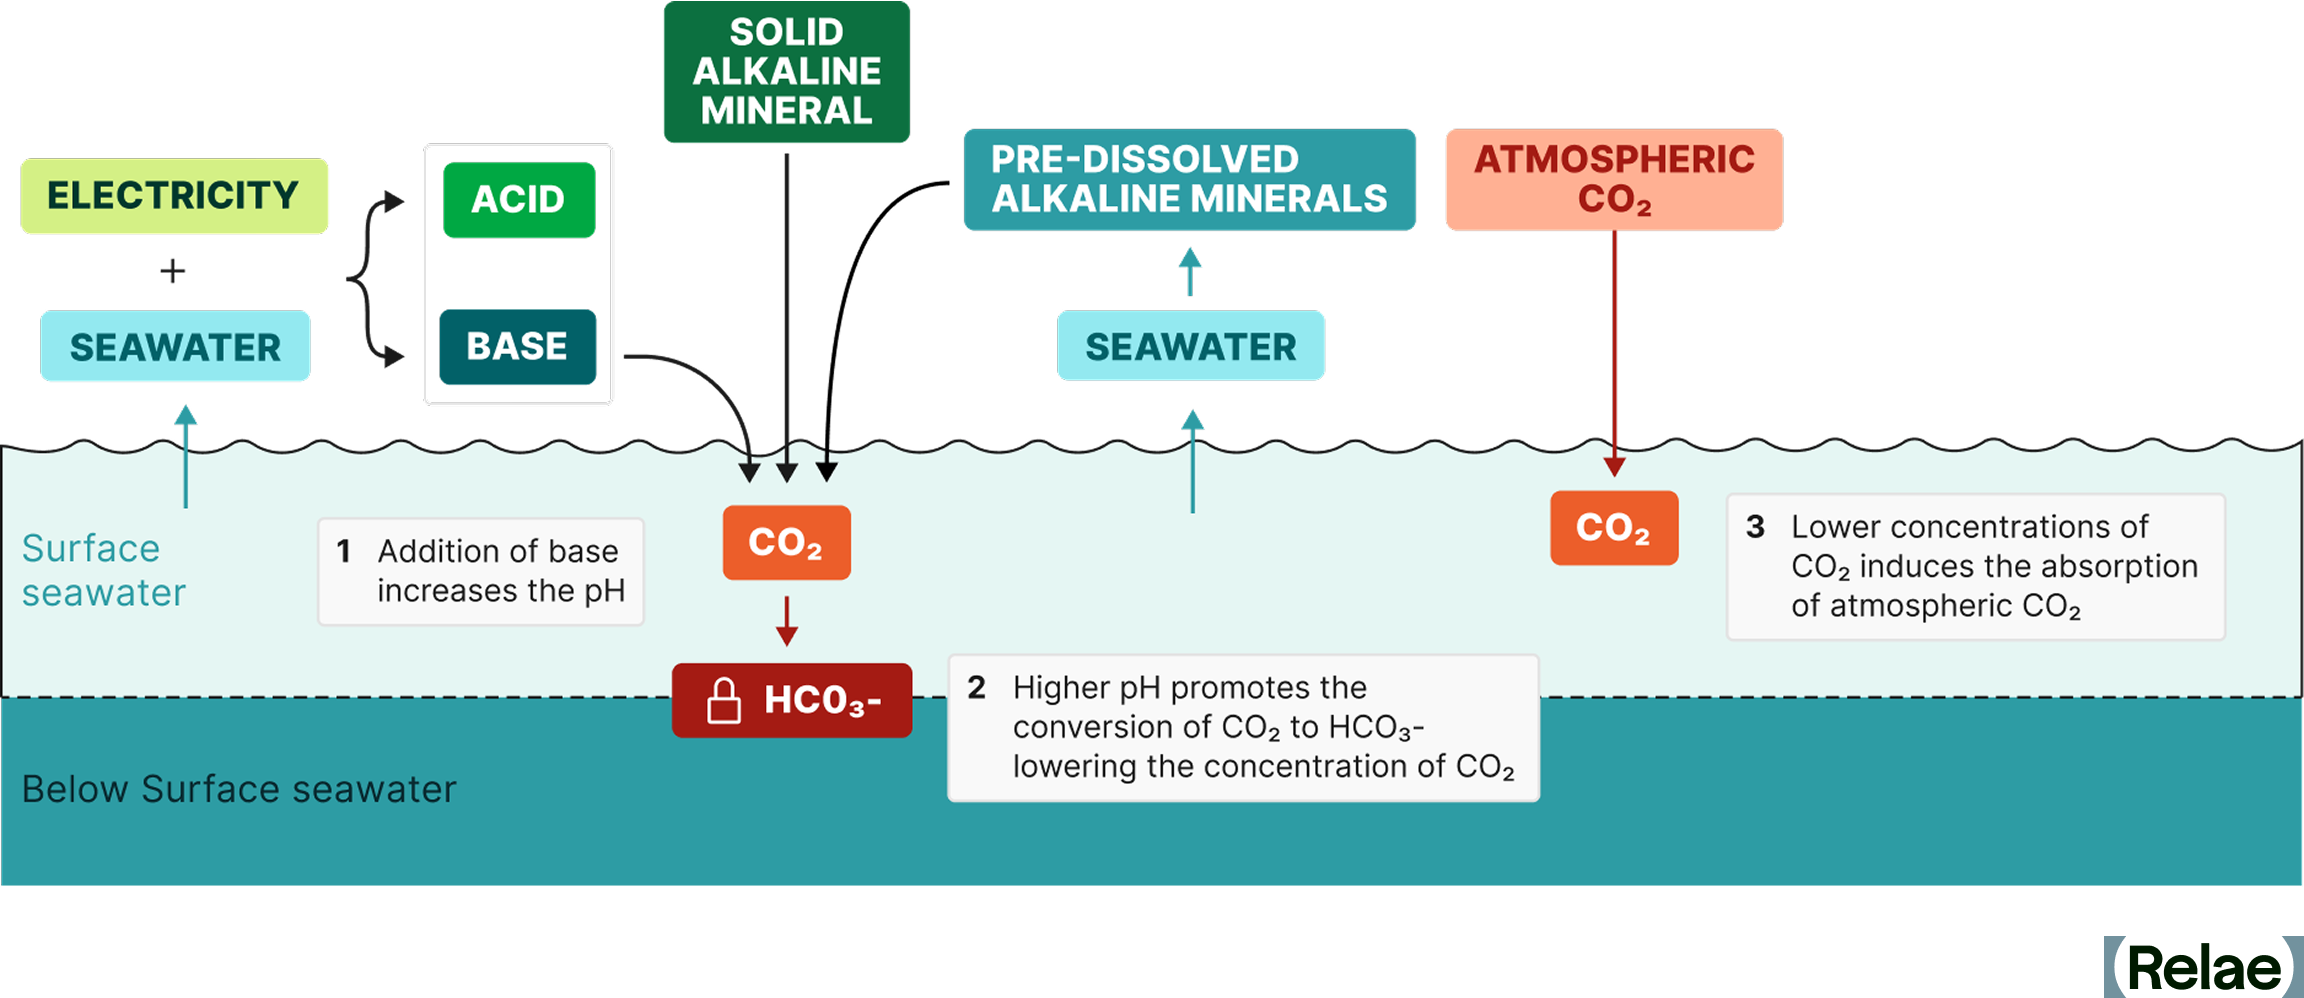
Ocean alkalinity enhancement (OAE) captures and stores atmospheric CO₂ as dissolved carbonates in the ocean by increasing the alkalinity of seawater using one of two primary methods:
- Adding alkaline minerals such as olivine or basalt to seawater.
- Using electrochemical methods to add alkaline compounds to seawater.
Both of these methods increase the alkalinity of seawater and, thereby, its capacity to absorb atmospheric CO₂ without acidification.
OAE methods can also differ by location and the manner in which seawater interacts with alkaline substances and atmospheric CO₂. This interaction may occur in the open ocean or within a controlled mCDR project facility. Each approach involves trade-offs: open ocean methods tend to be less energy-intensive but present greater uncertainties and challenges in measurement, reporting, and verification (MRV).
Understanding Direct Ocean Removal (DOR)
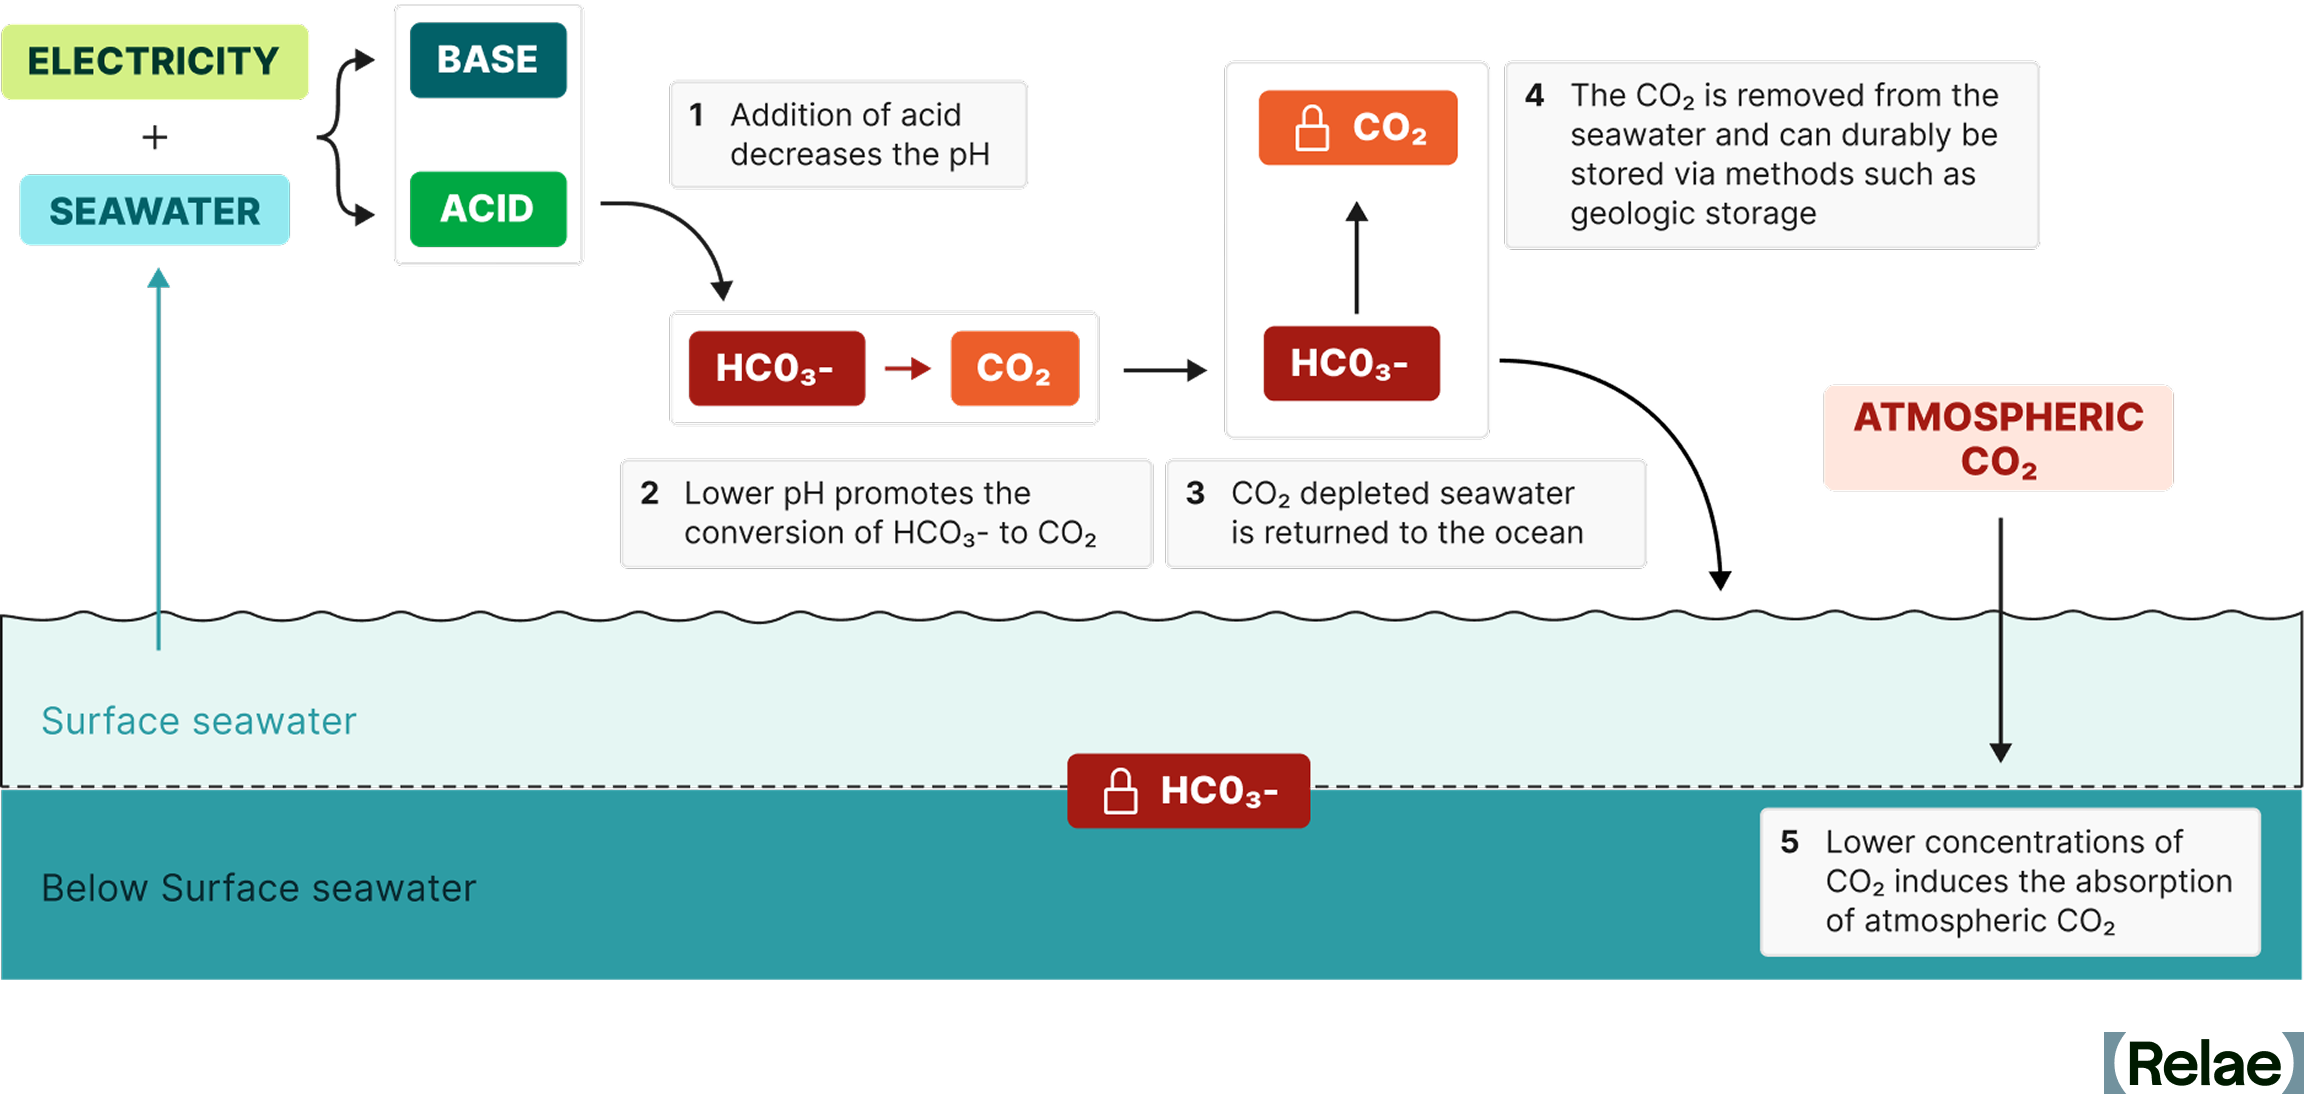
Direct ocean removal (DOR), also called direct ocean capture (DOC), removes CO₂ dissolved in seawater using the controlled acidification of seawater in a closed system using one of two primary methods:
- Electrochemical methods such as electrolysis of seawater or electrodialysis
- The addition of minerals like olivine and basalt.
The acidified and CO₂ depleted seawater is neutralized to native pH and allowed to equalize with and remove atmospheric CO₂. Once removed, CO₂ can be safely stored using geologic storage with a durability of >1,000 years.
Nomenclature for Direct Ocean Removal
Direct ocean removal is more commonly referred to as direct ocean capture. Relae believes the term direct ocean removal (DOR) is more accurate for two reasons:
- We think it is scientifically more accurate as both OAE and DOR remove CO₂ from the atmosphere but DOR directly removes CO₂ from the oceans, where in OAE, CO₂ is captured as bicarbonates in the ocean.
- DOC is a term for dissolved organic carbon, which is frequently used in mCDR project documents, reports, and the scientific literature.
Key Benefits of Marine Carbon Dioxide Removal
Understanding how mCDR works highlights its potential to address climate challenges. Here are the key benefits that make it a critical tool in global decarbonization strategies.
- Scalable carbon removal without land constraints: Marine carbon dioxide removal does not require large land areas or significant freshwater resources, making it highly scalable.
- Harnessing the ocean’s natural carbon sink: The ocean absorbs about 25% of human-generated CO₂ annually. mCDR enhances this natural process, increasing carbon storage without accelerating ocean acidification.
- Diverse technological pathways for flexibility: Technologies like ocean alkalinity enhancement and direct ocean removal offer flexible solutions tailored to different environments and project needs.
- Global reach with a large surface area: Covering over two-thirds of the Earth’s surface, the ocean provides an expansive platform for mCDR technologies globally.
- Potential to mitigate ocean acidification: Some mCDR methods, such as ocean alkalinity enhancement, not only remove CO₂ but also help restore ocean pH levels, supporting marine ecosystem health.
Challenges of Marine Carbon Dioxide Removal
While mCDR holds significant promise, it also presents challenges that must be addressed for responsible deployment.
- Technical scalability and efficiency: Scaling mCDR technologies to achieve meaningful carbon removal while maintaining energy efficiency remains a significant hurdle.
- Potential environmental impacts: Altering ocean chemistry may pose risks to marine ecosystems, with long-term effects still not fully understood.
- Measurement, reporting, and verification (MRV) complexity: Accurately measuring CO₂ removal and ensuring its durability requires advanced monitoring systems, which are still evolving.
- Regulatory and governance gaps: Clear global policies are needed to oversee mCDR deployment, manage environmental risks, and ensure accountability.
- Public perception and ethical considerations: Concerns around geoengineering and potential unintended consequences may impact public acceptance and policy support.
Deploying Marine Carbon Dioxide Removal
As mCDR technologies evolve, effective deployment will rely on adaptive management practices to address technical, environmental, and regulatory challenges. This includes robust MRV systems for accurate CO₂ removal tracking and continuous ecosystem monitoring to mitigate potential risks to marine life.
Collaborative efforts between scientists, policymakers, and project developers are key to establishing clear regulatory frameworks, optimizing technologies for efficiency and scalability, and building public trust. These practices ensure mCDR can be scaled responsibly while safeguarding ocean health.
The Future of Marine Carbon Dioxide Removal
As technologies like ocean alkalinity enhancement and direct ocean removal advance, their potential to deliver large-scale, durable carbon removal is becoming increasingly evident. Realizing this potential requires more than technological innovation—it depends on rigorous environmental monitoring, transparent reporting, and strong collaboration among project developers, carbon buyers, and policymakers.
Establishing clear, consistent standards for high-quality mCDR is essential to ensure both climate effectiveness and environmental safety. To support this, Microsoft and Relae have partnered to develop the Criteria for High-Quality Carbon Dioxide Removal.
Frequently Asked Questions
What is marine carbon dioxide removal (mCDR)?
mCDR uses ocean-based processes, primarily ocean alkalinity enhancement and direct ocean removal, to capture and durably store atmospheric CO₂. It works by increasing the ocean's natural capacity to absorb CO₂ without increasing acidification.
How does marine carbon dioxide removal compare to land-based methods like direct air capture or reforestation?
Unlike land-based approaches, mCDR doesn't require large land areas or freshwater, and the ocean's size gives it significant scaling potential. It's earlier-stage than more established pathways, though, with measurement and environmental monitoring standards still maturing.
Is marine carbon dioxide removal proven and scalable today, or still emerging?
mCDR technologies have shown promising results in lab testing and early deployments, but confirming safety and effectiveness at a large real-world scale requires more monitoring data. It's best described as an emerging pathway with strong near-term momentum, not yet a mature, at-scale solution.
What should a company look for when evaluating a marine carbon dioxide removal project or credits?
Buyers should look for rigorous carbon MRV paired with equally rigorous monitoring of ocean ecosystem health (eMRV), transparent reporting, and adherence to established frameworks like the Criteria for High-Quality Carbon Dioxide Removal.
Scope 2 Emissions Explained: Tracking, Reporting, and Reducing Impact
Key Takeaways
- Scope 2 emissions (indirect emissions from energy use) are increasingly critical to address. With surging electricity demand, especially from data centers, scope 2 is a growing share of corporate emissions and a priority for decarbonization.
- Approaches to scope 2 accounting are evolving—and formal changes are now on the table. Both location-based and market-based methods remain accepted under the Greenhouse Gas Protocol. Still, the Protocol's recently closed public consultation proposes more granular approaches, including 24/7 power and carbon matching, that would better reflect the realities of modern power markets.
- Proven decarbonization levers, such as reducing energy use, entering power purchase agreements, procuring green tariffs, and buying high-quality renewable energy certificates, are already available and impactful. Decarbonization, not just measurement, must be the goal. Companies don’t need to wait to decarbonize.
Accounting for Indirect Emissions From Energy Use
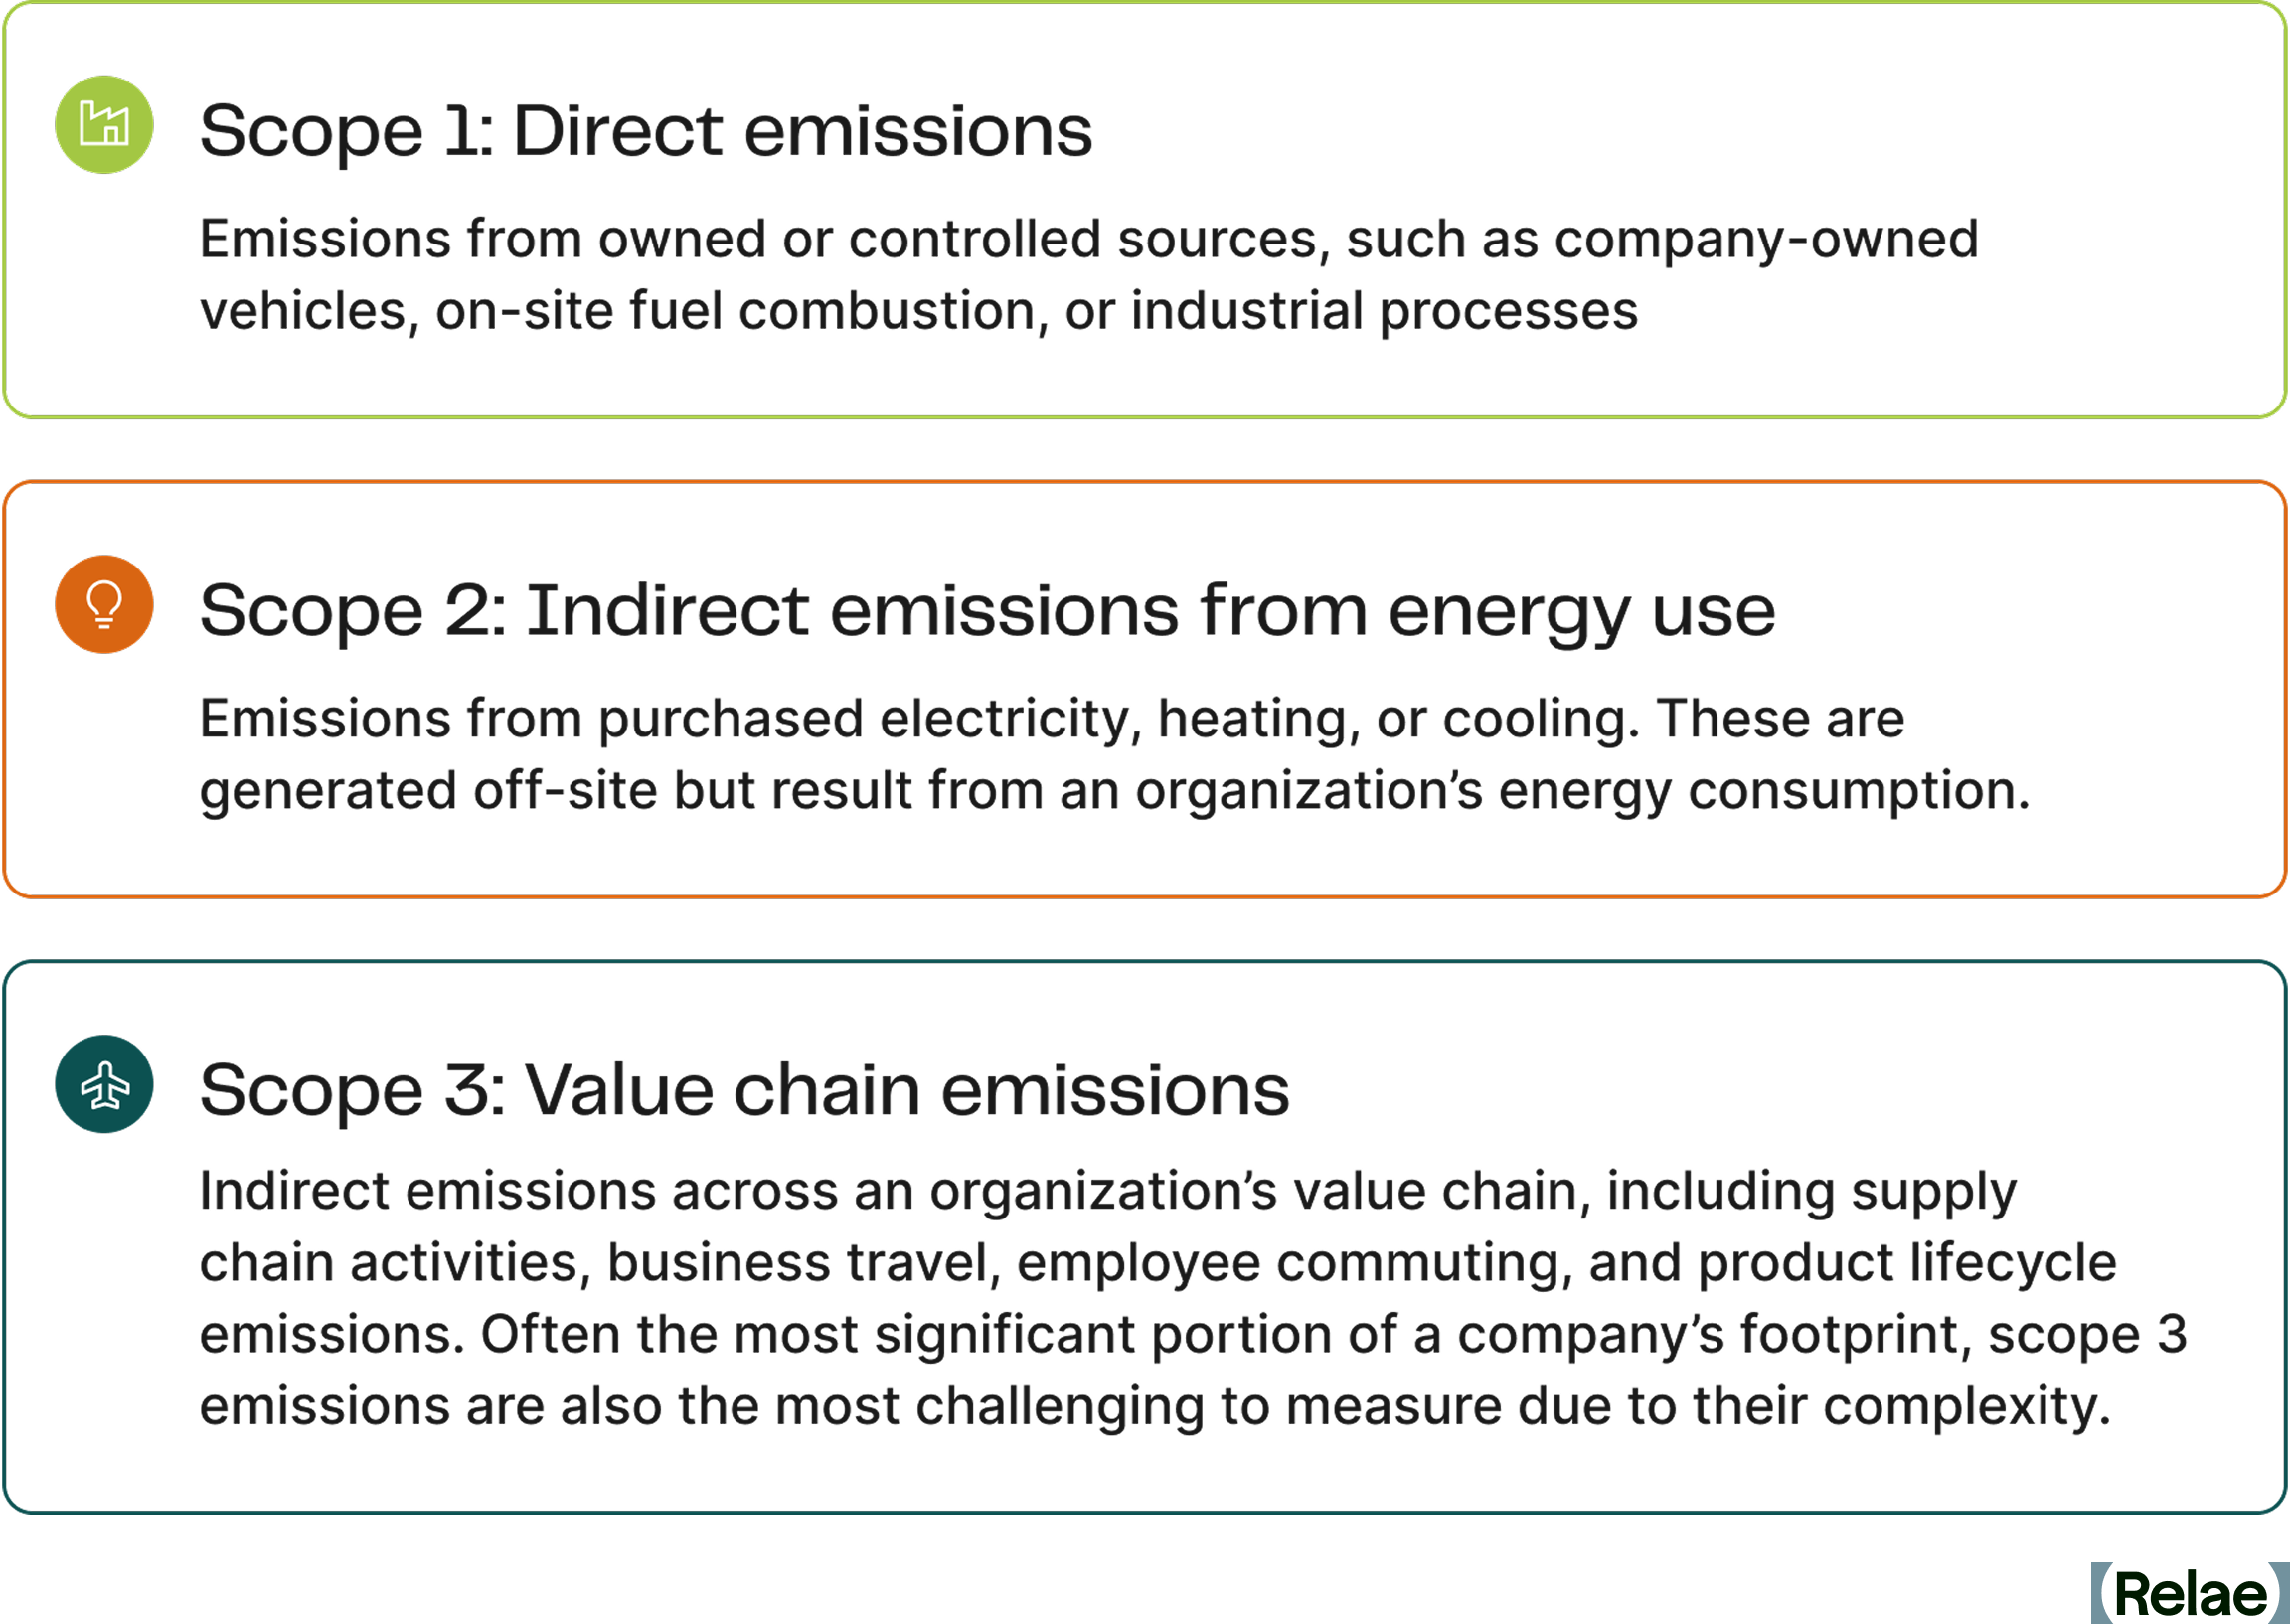
As businesses and organizations strive to reduce their environmental impact, carbon accounting has become an essential tool for tracking and managing greenhouse gas (GHG) emissions. Carbon accounting helps organizations measure, report, and mitigate their emissions across various activities. A key framework for categorizing these emissions is the Greenhouse Gas Protocol (GHG Protocol), which classifies emissions into three scopes:
Each scope presents unique challenges and opportunities for reduction. Among them, scope 2 emissions are particularly significant because they stem from purchased energy, which is often generated using fossil fuels. However, numerous reduction mechanisms exist today to help organizations eliminate these emissions, such as improving energy efficiency in order to use less energy, and transitioning to renewable energy sources through market-based mechanisms. Understanding scope 2 emissions is crucial for businesses looking to contribute meaningfully to the global energy transition and achieve sustainability goals.
What Are Scope 2 Emissions?
Scope 2 emissions refer to indirect GHG emissions associated with the consumption of purchased energy. Unlike scope 1 emissions, which result from direct fuel combustion, scope 2 emissions arise from the generation of electricity, steam, heat, or cooling that a company procures from external sources.
The primary sources of scope 2 emissions include:
Purchased electricity: When businesses buy electricity from a utility provider, the emissions from power plants that generate this electricity are classified under scope 2.
Purchased heat, steam, and cooling: Some companies purchase heat, steam, or cooling services instead of generating them on-site. These services often come from centralized facilities that may rely on fossil fuels, thereby contributing to scope 2 emissions.
What sets scope 2 emissions apart from other scopes is the presence of market-based mechanisms that offer multiple pathways for organizations to reduce their carbon footprint. Unlike scope 1, where emissions reductions often require technological shifts or operational changes, scope 2 reductions can be achieved through strategic procurement decisions. The transition to renewable energy sources is an essential component of sustainability strategies, setting the stage for a broader energy transition across industries and economies.
How Are Scope 2 Emissions Measured Today?
The GHG Protocol currently outlines two primary approaches for calculating scope 2 emissions: the location-based method and the market-based method.
Location-Based Method
The location-based method calculates emissions for electricity consumption based on the average emissions intensity of the grid where the energy consumption occurs. This approach is mandatory under various reporting frameworks and does not take into account a company’s procurement choices.
- Relies on grid averages: Emissions are calculated based on regional grid emissions factors rather than specific energy purchases.
- Time-delayed data: Since grid emissions factors are typically updated annually, this method may not reflect real-time energy sourcing changes.
- Limited control: Companies using this method have less direct influence over their reported emissions, as they depend on the overall energy mix of their region.
Market-Based Method
The market-based method, on the other hand, reflects an organization’s actual procurement decisions and energy-sourcing strategies. It accounts for specific contracts, such as power purchase agreements (PPAs), renewable energy credits (RECs), and green tariffs, which allow businesses to claim lower emissions from their purchased electricity.
- Reflects company choices: Emissions calculations take into account contractual agreements for renewable energy purchases.
- Mechanism for electricity transition: Encourages organizations to invest in low-carbon electricity options and actively support the transition to renewables.
- Multiple reduction options: Companies can reduce their scope 2 emissions through a portfolio of mechanisms like PPAs, RECs, and green tariffs, making this method a flexible and strategic tool for decarbonization.
While market-based mechanisms provide flexibility in reducing scope 2 emissions, they also highlight the need for more precise and updated carbon accounting methodologies. For example, some decarbonization strategies, such as time-shifting energy consumption to better match renewable generation, are not accounted for under these methods. This and other limitations mean that the traditional methods outlined in the GHG Protocol are increasingly seen as outdated in an era of rapid changes in energy generation and grid dynamics. As a result, the market is shifting toward more advanced power emission accounting methodologies that provide a more accurate reflection of emissions associated with electricity use.
Proposed Changes to the GHG Protocol Scope 2 Guidance
The current GHG Protocol Scope 2 Guidance provides a market-based instrument methodology, originally designed in the early 2000s, that allows US-based companies to procure renewable energy at any point within a year from anywhere in North America and apply it to any of its annual electricity consumption within that same year. This methodology, as written, allows for a potentially significant mismatch of “emissions caused” (by consuming electricity) versus “emissions avoided” (by generating renewable electricity) in that it does not account for any of the realities of electric grids and generators, which vary significantly over different regions, seasons, and time of day.
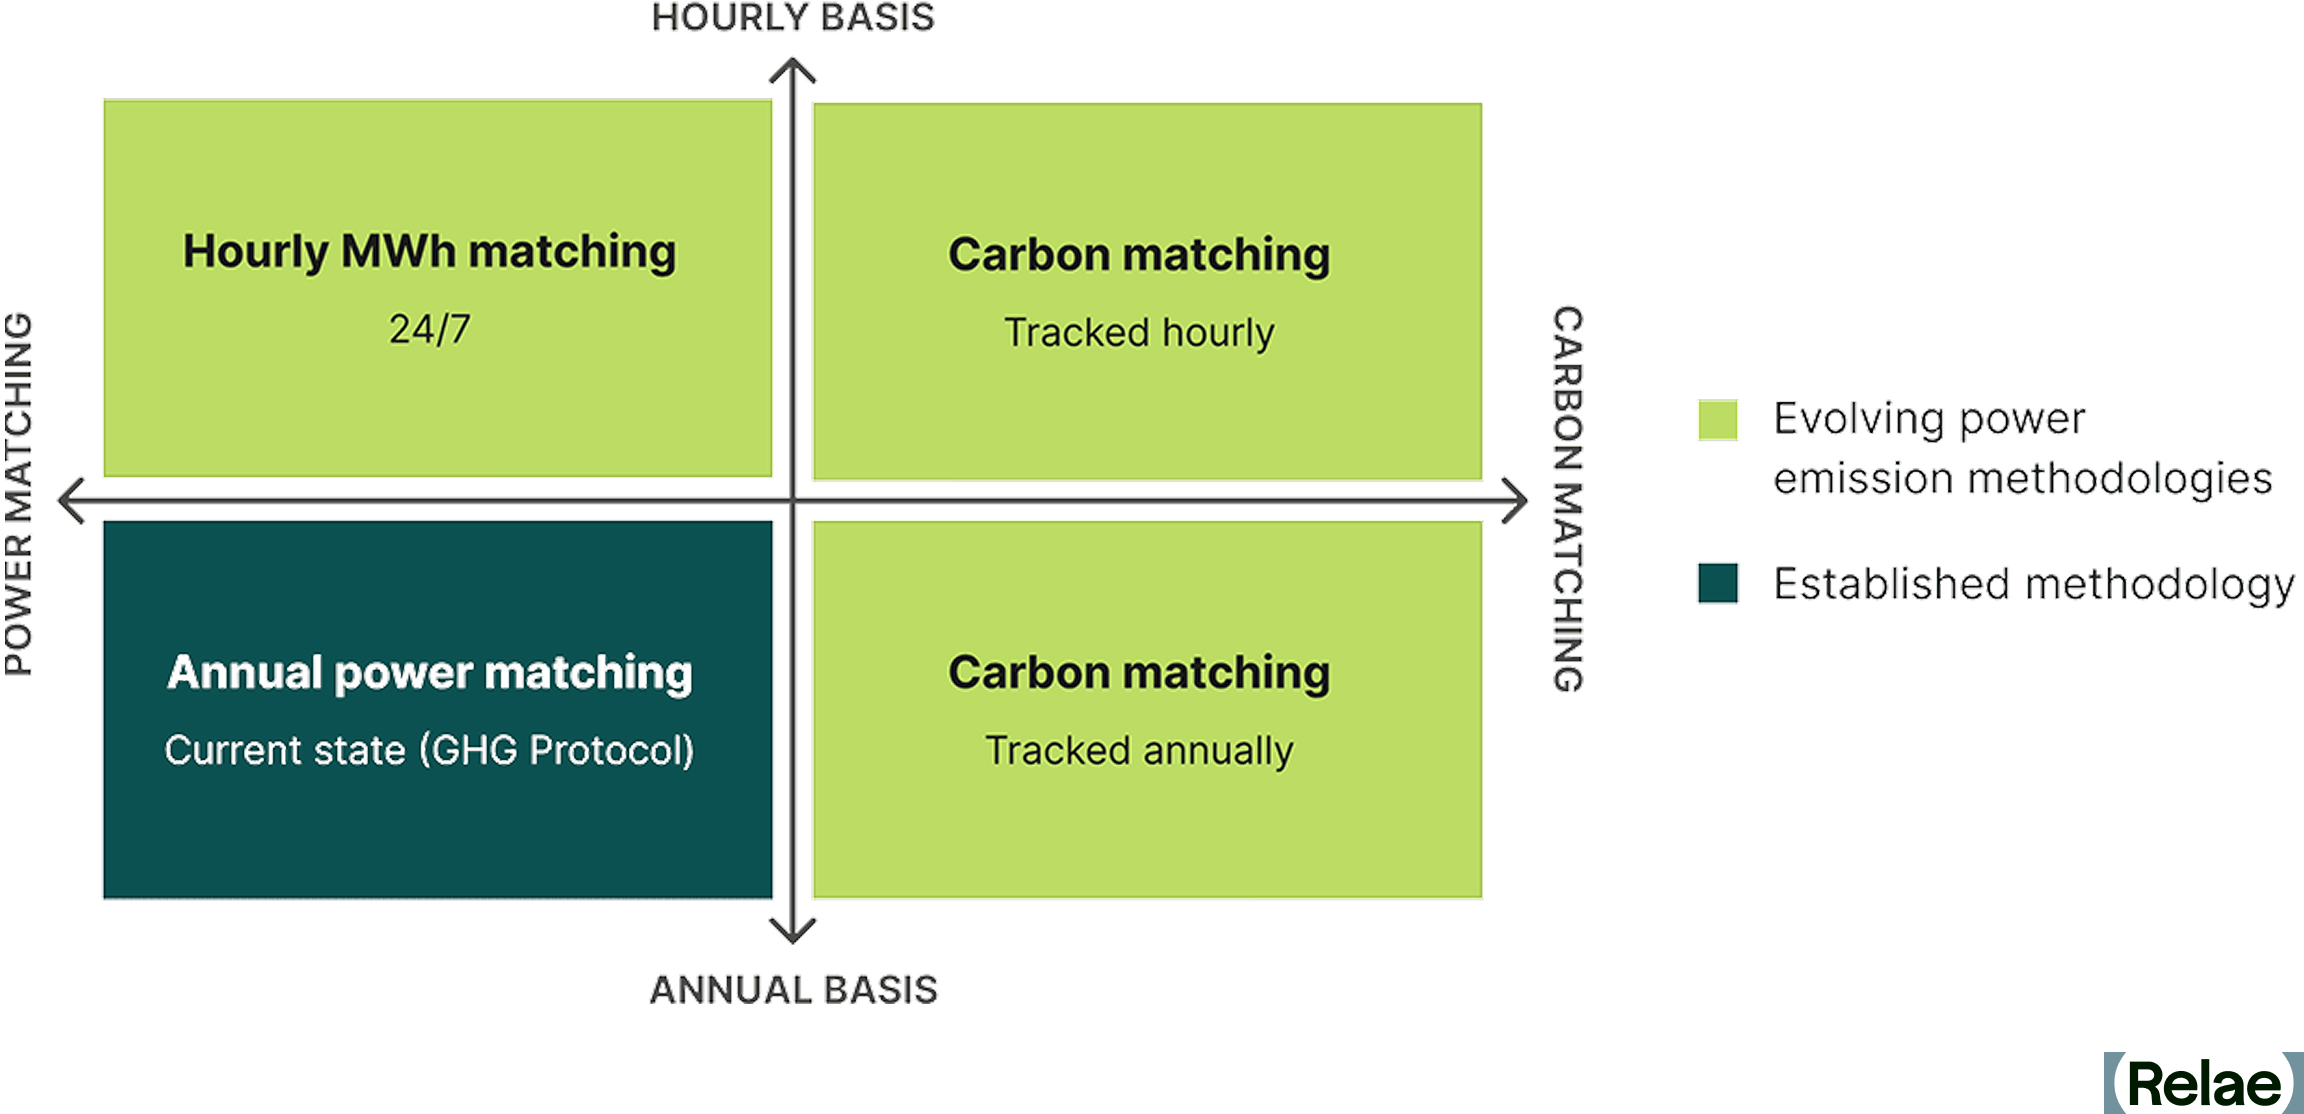
In response to this, the GHG Protocol Scope 2 Guidance is currently undergoing a revision process, which will include how emissions associated with electricity consumption are calculated. A focus of the revision process is on how to better account for the real emissions associated with a corporate’s electricity consumption, and more impactful ways of mitigating them through market-based instruments and other approaches. Advanced power emission accounting methodologies, such as 24/7 power matching and carbon matching, are being explored as ways to better represent the GHG emissions associated with electricity consumption.
- 24/7 power matching emphasizes matching electricity consumption with an equivalent amount of renewable energy production on an hourly basis.
- Carbon matching emphasizes measuring the emissions impact of incremental electricity consumption or production at a specific time.
These emerging methodologies propose a shift toward more granular temporal and region-specific matching, which could require companies to rethink their emissions reporting approach and explore more advanced tracking tools. They may also introduce new strategies beyond market-based instruments for reducing scope 2 emissions, such as time-shifting energy consumption.
As power grids continue to decarbonize and new digital tools emerge, businesses will need to adapt to these evolving methodologies to remain compliant, enhance sustainability strategies, and achieve meaningful reductions in emissions. Companies that proactively integrate advanced power emission tracking into their carbon accounting strategies will be better positioned to lead in the transition to a low-carbon economy.
How to Reduce Scope 2 Emissions
The GHG Protocol provides multiple mechanisms for reducing scope 2 emissions, allowing organizations to shift their energy consumption toward lower-carbon alternatives. These include:
- Reducing energy consumption: Improving energy efficiency in operations can significantly lower electricity use. In some cases, this involves capital investments in more energy-efficient equipment, but in other cases, it can be based on operational changes such as reducing unnecessary lighting, HVAC, and other services during non-working hours. (Electrification efforts, such as shifting from fossil fuel-powered systems to electric alternatives, may actually increase scope 2 emissions, but this can ultimately reduce overall emissions by correspondingly decreasing scope 1 emissions and allowing for renewable energy procurement.)
- RECs: Companies can purchase unbundled RECs (emissions “attributes” separated from the actual electricity product) to offset emissions associated with purchased electricity. While there has been criticism of RECs due to their significant range in quality, high-quality RECs are available, which may include ensuring regional matching, financial additionality, on-line date additionality, or tighter temporal generation to consumption matching. The use of high-quality unbundled RECs is the most accessible and realistic option for most smaller-scale companies to address scope 2 emissions.
- On-site generation and co-location: Installing on-site renewable energy generation, such as solar panels, allows companies to directly offset their electricity consumption from the grid. In some commercial settings, such as companies using leased real estate or co-located data centers, partnering with facilities that prioritize renewable energy procurement can help reduce scope 2 emissions for the facility owner while the facility occupant reduces scope 3 emissions.
- PPAs: Entering into long-term contracts with renewable energy providers ensures companies receive electricity from clean energy sources while supporting the expansion of renewable generation capacity. PPAs are available with standardized contract terms, and some service providers will aggregate demand from multiple smaller companies to reach the minimum required amount for typical PPA contracts. Hedging products are also available to reduce market risks.
- Green tariffs: Many utilities offer green tariffs that enable businesses to purchase renewable energy directly through their electricity provider, often at a premium but with lower emissions impact. For many smaller companies, this is a more viable approach than a PPA with a single renewable generator.
By adopting a combination of these strategies, businesses can significantly lower their scope 2 emissions while aligning with broader sustainability goals and regulatory requirements. The path to decarbonization requires proactive investment in cleaner energy sources, efficient consumption practices, and leveraging market-based instruments to drive the transition toward a low-carbon future.
Why Does Reducing Scope 2 Emissions Matter?
Reducing scope 2 emissions is the underpinning of decarbonizing the power sector and enabling the global energy transition. In 2025, S&P reported that corporate buyers added 15.2 GW of renewable capacity in the US, up from 9.1 GW in 2024, illustrating the growing impact of the corporate sector on the electricity grid. Cleaner grids translate to lower emissions for all energy users. Organizations that actively reduce their scope 2 emissions can contribute to decreasing demand for fossil fuel-based electricity and accelerate the deployment of renewable energy infrastructure.
For companies that own and operate data centers, this transition is especially important. AI data centers consume large amounts of electricity, and their reliance on purchased power makes them a significant source of scope 2 emissions. Since many businesses rely on third-party data center services, reducing emissions from these facilities also helps lower scope 3 emissions across industries. Corporates can influence data centers by requiring that they have a clear and explicit low-emission power strategy in place before procurement.
Beyond direct corporate benefits, reducing scope 2 emissions has a tangible long-term impact on power grids. Increased investment in renewable energy procurement sends a strong market signal, encouraging utilities and developers to expand clean energy projects. As more companies commit to sourcing renewable energy, the overall mix of grid power shifts, making low-carbon electricity more accessible and reducing reliance on fossil fuel-based generation. Ultimately, widespread corporate action in scope 2 emissions reduction supports the broader decarbonization of power markets and strengthens global climate commitments.
Frequently Asked Questions
Will RECs (renewable energy certificates) still count toward scope 2 reductions under the GHG Protocol's proposed changes?
Under the current Scope 2 Guidance, yes—RECs remain a valid market-based instrument. The proposals from the GHG Protocol's recent consultation range from retaining market-based accounting with stricter quality criteria to restructuring how instrument-based claims are reported altogether, and nothing is final until the revised standard is published. What's clear is that scrutiny is rising, particularly for unbundled RECs with weak temporal or geographic connection to a company's actual consumption, so prioritizing high-quality RECs now is the best way to future-proof a procurement strategy.
How would the proposed hourly and regional matching requirements affect companies that rely on unbundled RECs today?
Hourly (24/7) and regional matching would require renewable generation claims to line up much more closely with when and where a company actually consumes electricity. Companies relying on annually matched, unbundled RECs sourced from distant grids would likely see their reported market-based emissions rise under such requirements. The practical preparation is to start collecting more granular (ideally hourly) consumption data and shift toward RECs and contracts with tighter regional and temporal matching.
What's the practical difference between location-based and market-based scope 2 accounting, and will that distinction survive the GHG Protocol's revision?
The location-based method calculates emissions using the average emissions intensity of the local grid, regardless of procurement choices, while the market-based method reflects a company's actual contracts, such as PPAs, RECs, and green tariffs. The consultation explored options from strengthening the criteria for market-based claims to reporting emissions and market instruments in separate, complementary statements. Both concepts will exist in some form, but companies should expect the requirements behind market-based claims to tighten.
When is the new Scope 2 Guidance expected to take effect, and what should companies do now to prepare?
Per the GHG Protocol's July 2026 development plan, a draft of the revised consolidated Corporate Standard is expected for public consultation in 2027, with a final published standard currently estimated for late 2028, and adoption timelines will follow publication. Companies should take action now. Energy efficiency, PPAs, green tariffs, and high-quality RECs reduce real emissions under any accounting regime. Building hourly consumption tracking and auditing the quality of existing REC portfolios now will make any future transition smoother.
The Business Case for Carbon Accounting: What It Is and Why It Matters
Key Takeaways
- Carbon accounting is a regulatory and strategic necessity, with policies like the European Union’s Corporate Sustainability Reporting Directive (CSRD) and California’s SB 253 requiring emissions tracking.
- Many companies track emissions inconsistently, underscoring the need for structured, repeatable carbon accounting to ensure accuracy and impact.
- Accurate carbon data drives efficiency and risk management, helping organizations reduce costs, streamline supply chains, and comply with climate regulations.
- Scope 2 emissions are increasingly challenging to quantify, especially for data centers and power-intensive operations. Grid-average emissions factors mask location-specific and time-specific variations that drive real procurement and siting decisions. Precise scope 2 accounting requires understanding which generators actually serve the load, when, and under what grid conditions.
- Scope 3 emissions have historically been a complex challenge, requiring better supplier engagement, standardized reporting, and expert guidance to support accuracy.
Carbon Accounting: More Than Compliance, a Strategic Advantage
Companies increasingly recognize the business value of reporting carbon emissions: it reduces regulatory risks, attracts sustainability-focused investors, enhances market competitiveness, and drives cost savings through efficiency. Transparent emissions reporting strengthens brand trust and aligns companies with global sustainability standards, ultimately turning climate accountability into a strategic advantage.
Yet, many companies struggle with incomplete and inconsistent tracking. According to the State of Corporate Climate Commitment, 80% of corporate professionals surveyed have tracked emissions at least once, but only 52% do so annually. Without a structured process and reliable data, businesses face compliance risks, financial penalties, and missed cost-saving opportunities.
This guide provides a clear roadmap to effective carbon accounting, equipping businesses with the knowledge to navigate regulations, enhance data accuracy, and implement effective strategies for compliance and operational success.
[stat]
What Are the Benefits of Effective Carbon Accounting?
By embedding annual carbon accounting into operations, organizations can enhance sustainability efforts while achieving financial and strategic benefits. Key benefits include:
Enhancing Transparency and Accountability
By providing accurate and verifiable emissions data, companies can showcase corporate responsibility and build a foundation of transparency. Aligning with recognized standards like the GHG Protocol strengthens confidence among investors and regulators. As climate disclosure laws tighten globally, ensuring credible emissions reporting reduces regulatory risks and enhances stakeholder trust. This commitment to authenticity minimizes the risk of greenwashing and strengthens brand reputation.
Guiding Regulatory Compliance and Risk Mitigation
Businesses navigating evolving environmental regulations must proactively align with policies to avoid financial and legal risks. Mandated emissions reporting, under policies like the European Union’s Corporate Sustainability Reporting Directive (CSRD) and Carbon Border Adjustment Mechanism (CBAM) as well as California’s SB 253, ensures compliance and enhances corporate accountability. Staying ahead of these evolving requirements prepares businesses for future policy shifts and safeguards their long-term resilience.
Improving Operational Efficiency and Reducing Costs
By analyzing energy consumption patterns, organizations can identify operational inefficiencies, optimize supply chains, and implement cost-saving measures while reducing carbon emissions. For example, evo, an outdoor experiences company, collaborated with Relae (formerly Carbon Direct) to assess its carbon footprint. This analysis revealed opportunities to reduce emissions across facilities, products, and shipping. By promoting sustainable practices throughout their supply chain, evo enhanced both environmental performance and operational efficiency.
Building a Competitive Advantage in a Low-Carbon Economy
Building a competitive advantage in a low-carbon economy requires prioritizing emissions transparency and sustainability. Companies that integrate emissions transparency into their operations build stronger relationships with supply chain partners and meet consumer demand for responsible brands. Aligning corporate values with sustainability fosters long-term customer loyalty and enhances market positioning.
Driving Strategic Planning and Net-Zero Alignment
Setting and tracking net-zero commitments requires structured, data-driven carbon reduction roadmaps. Businesses that measure emissions annually are more likely to set public sustainability goals and take action. Carbon accounting supports clean energy transitions, fosters supply chain collaboration, and integrates carbon removal strategies to address residual emissions. By embedding emissions measurement into long-term planning, organizations facilitate resilience and profitability in an evolving business landscape.
Carbon emissions measurement correlates to climate action: 61% of companies that calculate their footprint annually have both set a public goal and begun working toward it.
What Is Carbon Accounting? The Basics You Need to Know
Carbon accounting is the systematic measurement, analysis, and reporting of an organization's greenhouse gas (GHG) emissions. Using standardized metrics like carbon dioxide equivalent (CO₂e), companies can assess emissions across operations and supply chains, identify high-impact areas, and set and track progress toward emissions reduction targets. When conducted annually, carbon accounting supports regulatory compliance, risk management, and decarbonization strategies essential for long-term sustainability.
The GHG Protocol is the most widely used framework for carbon accounting, setting the baseline for how organizations measure and report their emissions. It classifies emissions into three scopes:
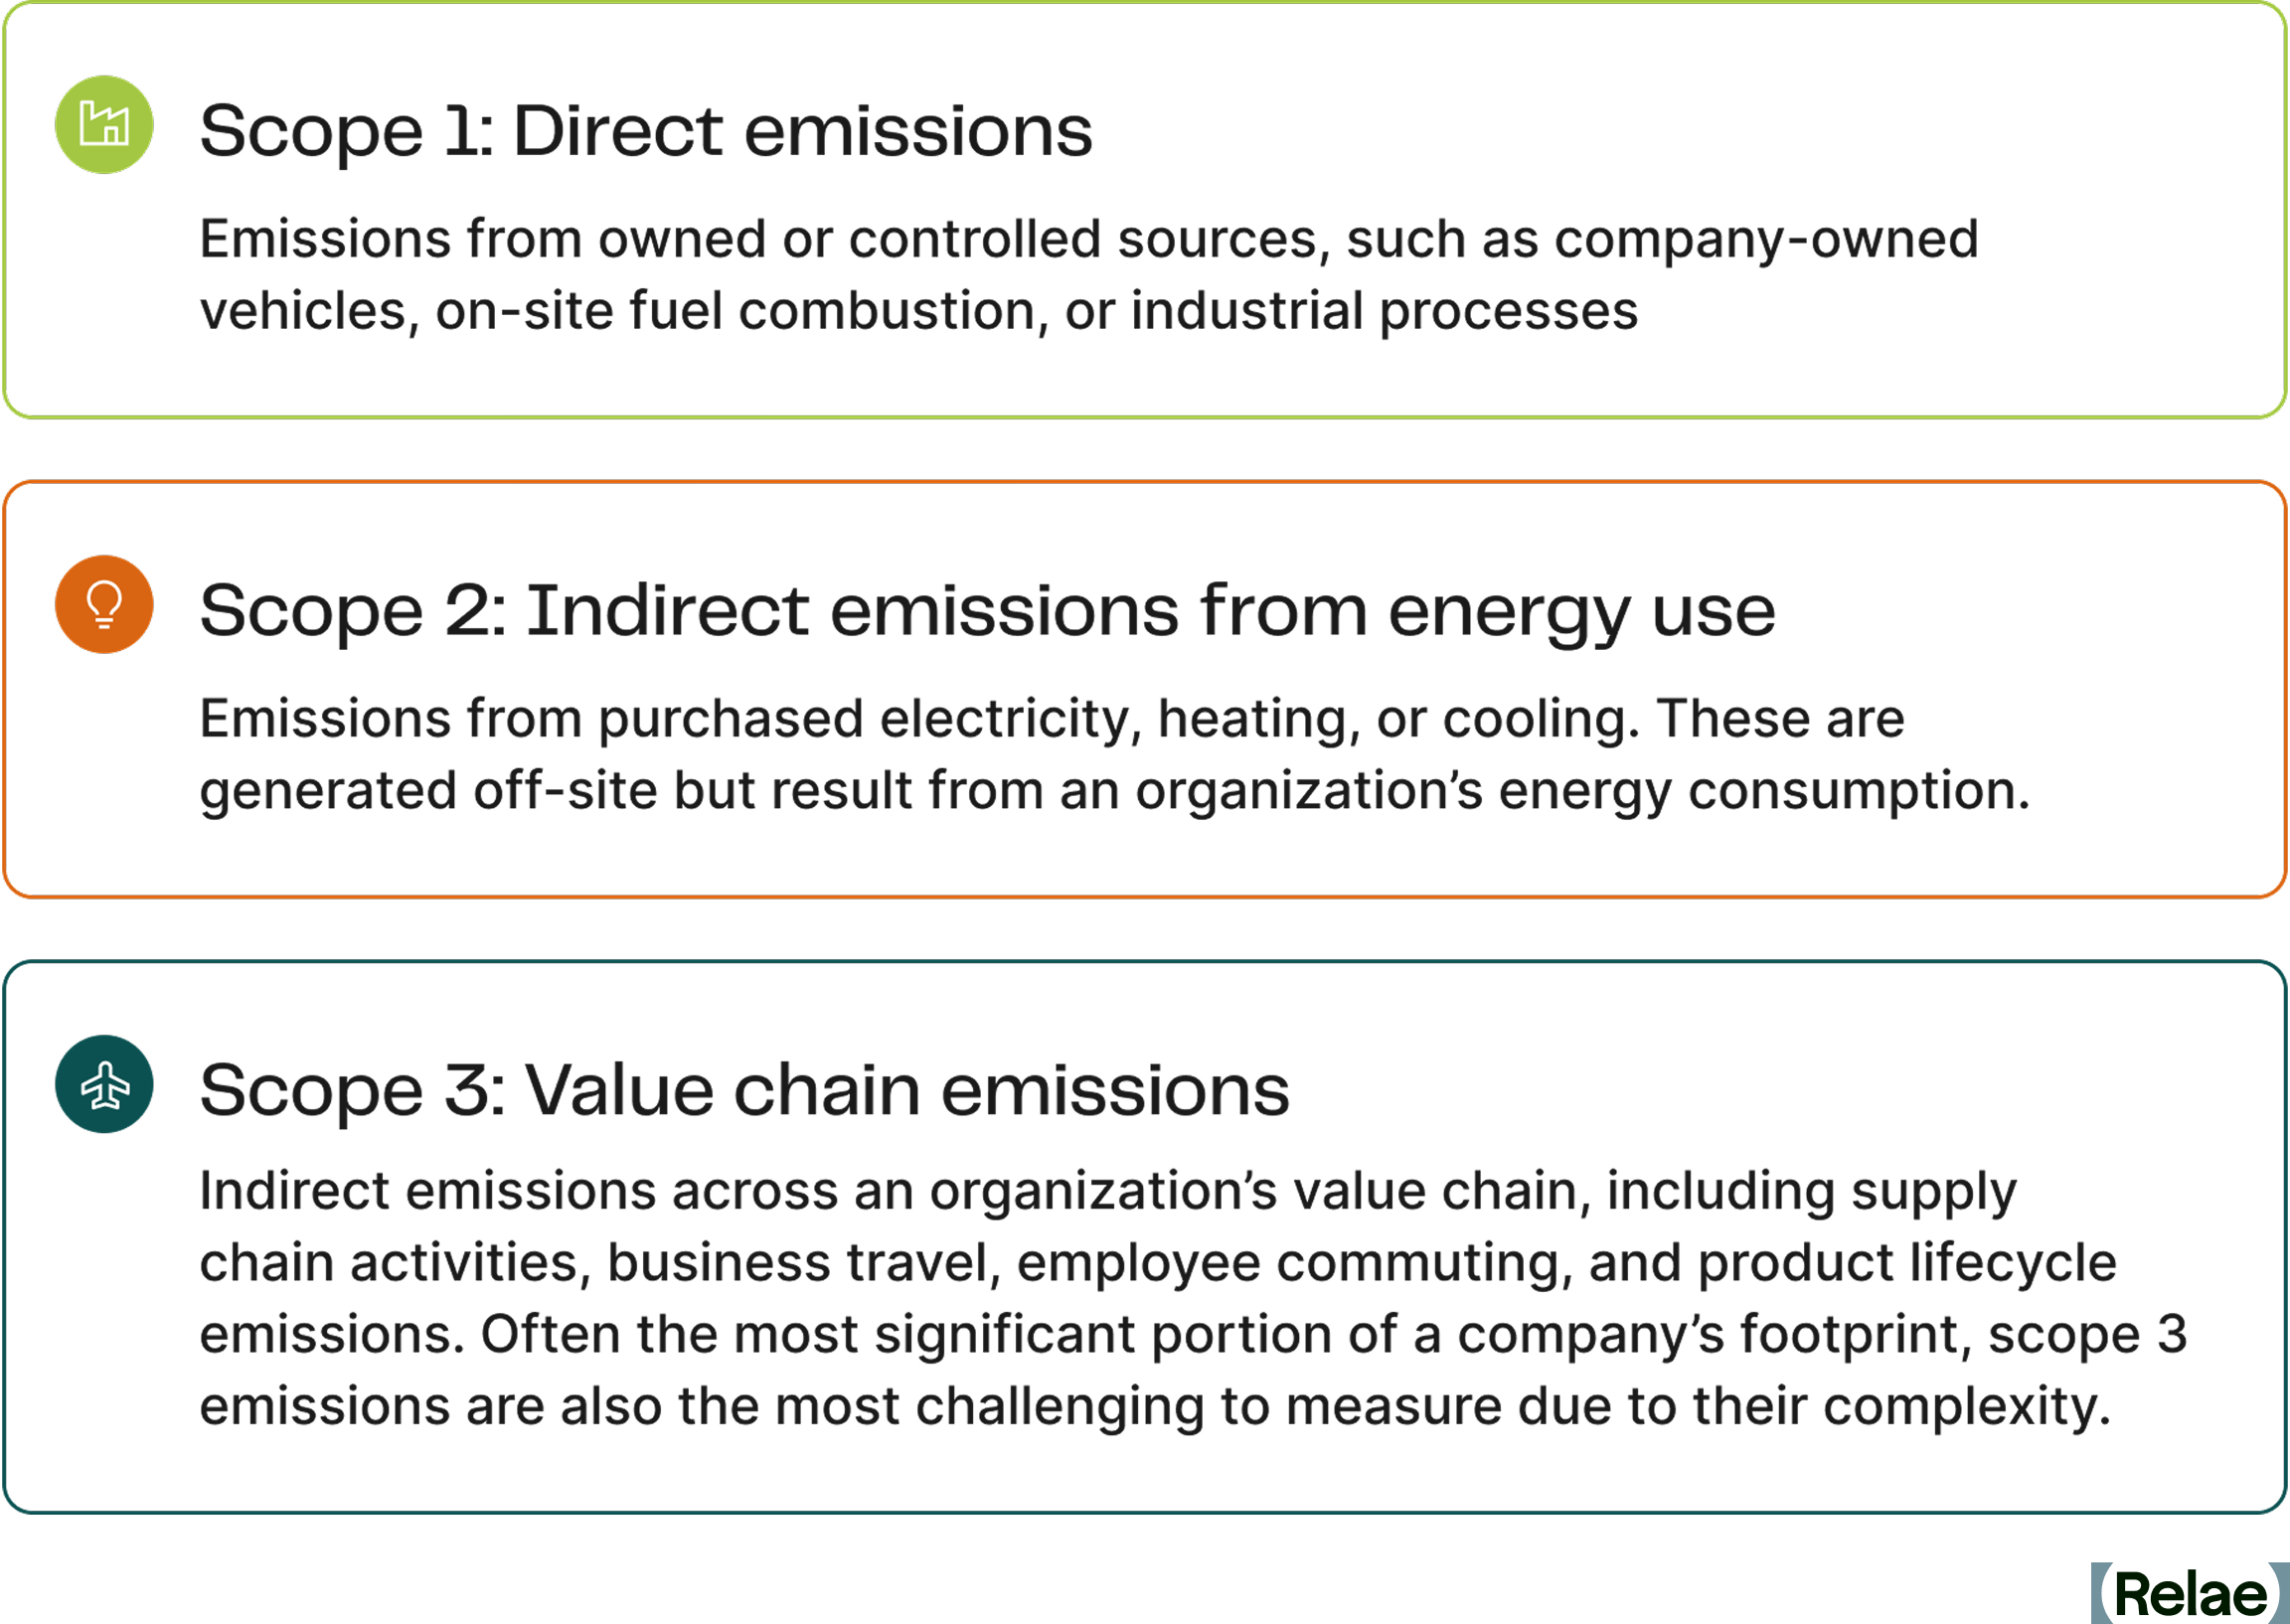
Keep in mind that scope 2 emissions are increasingly difficult to quantify using traditional methods, which fail to account for real-time grid fluctuations and locational energy variations. Cutting-edge, advanced carbon accounting methodologies now provide more precise tracking, particularly benefiting large power consumers like enterprise data centers and hyperscalers.
Scope 3 emissions also continue to pose a great challenge, requiring extensive data collection and supplier coordination, complexities that are difficult to navigate without expert guidance.
The Corporate Carbon Accounting Process: A Step-by-Step Guide
The carbon accounting process involves systematically measuring, analyzing, and managing an organization’s greenhouse gas emissions across its operations, supply chain, or product life cycle.
- Collect emissions data across all three scopes (scope 1, scope 2, and scope 3).
- Categorize and quantify emissions from each source to estimate the total impact.
- Verify data and report findings to promote compliance, accuracy, and transparency.
- Develop and implement reduction strategies based on insights from the data.
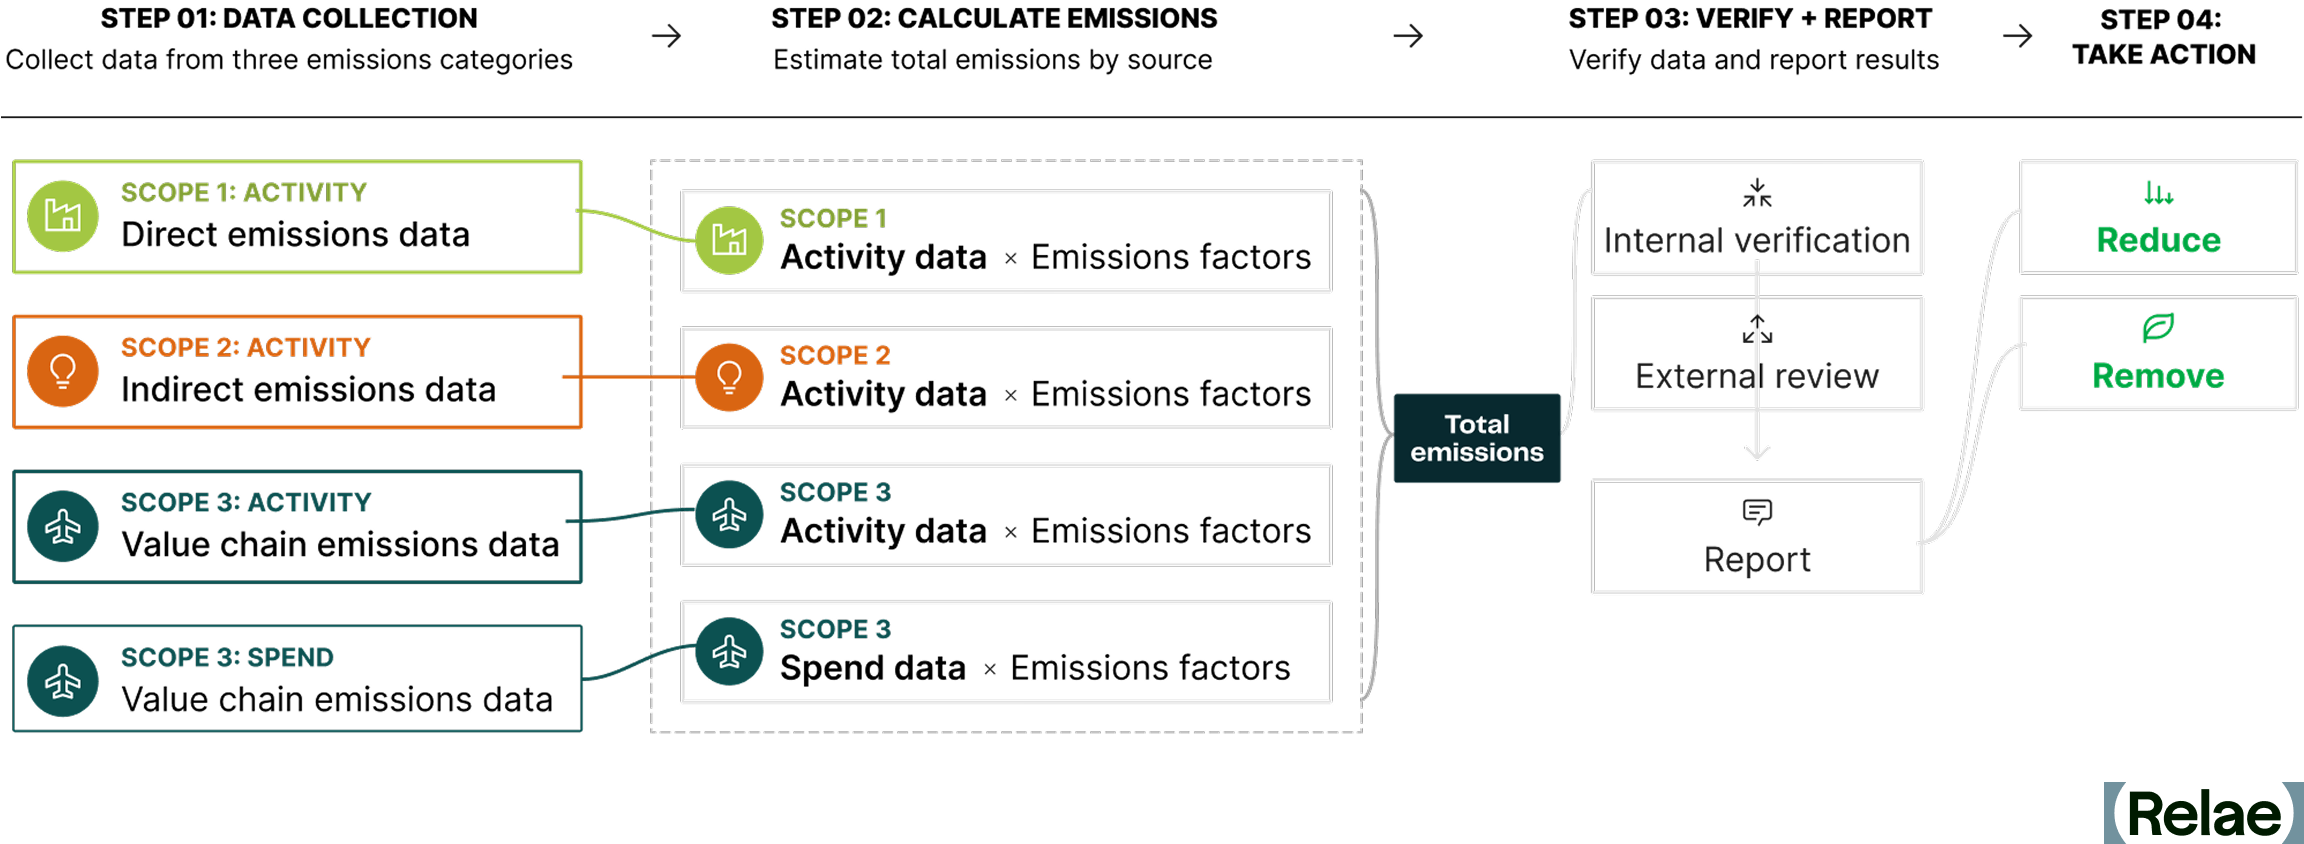
Activity Data Versus Spend Data
Carbon measurement primarily relies on two data types: activity data and spend data.
- Activity data includes direct measurements reflecting the physical amount of an emitting source, such as fuel consumption (in liters or gallons) or travel distance (in kilometers or miles). It accurately represents emissions from a particular operational emission source and allows for measurable decarbonization strategies.
- Spend data serves as an alternative when activity data is unavailable. It estimates emissions based on financial expenditures related to goods, services, or travel. While less precise, it is useful for approximating scope 3 emissions, where direct measurement is often challenging.
Tips for Accurate Data Collection
Effective carbon accounting relies on seamless collaboration across departments, suppliers, and external data sources. Key strategies include:
- Stakeholder engagement: Finance, operations, procurement, and sustainability teams must coordinate to track and validate emissions data. Engaging suppliers is essential for capturing and reducing scope 3 emissions.
- Addressing data gaps: When data is unavailable, proxy data can be used to estimate emissions, but it should be a temporary solution while organizations work toward obtaining accurate, real-world data.
- Standardization and verification: Implementing consistent methodologies and third-party audits enhances the credibility of carbon reporting, building stakeholder trust.
By leveraging precise data, understanding emission scopes, and adopting structured data collection methods, organizations can create a transparent, science-based approach to carbon accounting and lay the foundation for meaningful climate action.
Climate Standards Businesses Need to Know
Global standards and regulations define carbon accounting methodologies by establishing guidelines for how organizations set boundaries, measure, and disclose emissions. Several key frameworks and policies guide both the international and regulatory levels.
Guidance frameworks
GHG Protocol: The Foundation of Carbon Accounting
- The GHG Protocol is the most widely adopted framework for measuring and managing emissions across organizations globally.
- Developed by the World Resources Institute (WRI) and the World Business Council for Sustainable Development (WBCSD), it provides common standards for businesses, governments, and supply chains.
- Sector-specific guidance has been developed for industries such as energy, finance, manufacturing, and agriculture, which face stricter reporting requirements than service-based sectors.
- The GHG Protocol is currently undergoing its first major revision since its launch. Partnering with the International Organization for Standardization (ISO) to co-develop a consolidated corporate standard that merges the Corporate Standard, Scope 2 Guidance, Scope 3 Standard, and Actions and Market Instruments standard with ISO 14064-1. As of mid-2026, the effort is in active technical development, with a draft opening for public consultation targeted for mid-2027 and a final published standard expected by the end of 2028. Current standards stay in effect until that replacement is finalized, so nothing changes for reporting yet.
ISO 14064: Standardized Emissions Quantification and Reporting
- The ISO 14064 series, created by the International Organization for Standardization (ISO), offers detailed methodologies for greenhouse gas accounting.
- It includes guidelines for organization-level emissions quantification, reporting, and reduction projects.
- ISO 14064 serves as the foundation for independent verification and compliance with voluntary carbon markets, enhancing the credibility of emissions reduction projects.
Policies
EU CSRD: Expanding Mandatory Climate Disclosure
- The Corporate Sustainability Reporting Directive (CSRD) enforces detailed sustainability reporting requirements for companies operating in the EU.
- Following the EU's 2025 to 2026 Omnibus simplification package, CSRD's scope narrowed sharply. It now applies to roughly 5,000 large companies, with new thresholds of more than 1,000 employees and more than 450 million euros in net turnover (up from the original 250 employees and 50 million euros)
- In scope companies must still report scope 1, 2, and 3 emissions data aligned with the EU Taxonomy and European Sustainability Reporting Standards (ESRS).
California SB 253: State-Level Mandatory Emissions Disclosures
- California’s SB 253 Climate Corporate Data Accountability Act sets strict emissions reporting mandates within the US.
- It applies to companies with over US$1 billion in revenue doing business in California, requiring scope 1 and 2 emissions reporting by November 2026..
- CARB has said scope 3 reporting and third-party assurance requirements will be addressed in a subsequent rulemaking covering 2027 and beyond.
EU CBAM: Preventing Carbon Leakage and Promoting Decarbonization
- The Carbon Border Adjustment Mechanism Requirements (CBAM) requires importers of specific carbon-intensive goods to disclose embedded emissions to prevent carbon leakage and promote global decarbonization by ensuring that domestic and foreign producers face comparable carbon costs.
- During the transitional phase (2023–2025), importers were required to submit quarterly reports on embedded emissions.
- As of 2026, they must purchase CBAM certificates to compensate for the carbon footprint of imported goods.
Although carbon accounting requirements vary across regions and industries, they are all fundamentally rooted in the principles established by the GHG Protocol and ISO 14064. As global regulations like the EU CSRD and state-level legislation evolve, organizations must proactively align with these stricter standards to mitigate regulatory risks and support compliance with emerging sustainability expectations.
What Are the Industry-Specific Challenges of Carbon Accounting?
Carbon accounting presents unique challenges across industries due to varying operational structures, emissions sources, and reporting requirements. While the challenges outlined below focus on financial services, data centers, and philanthropies, similar complexities exist across manufacturing, transportation, healthcare, and other sectors. Tailored strategies are essential to effectively addressing these complexities.
Data Centers: Measuring and Reducing Scope 2 and 3 Emissions
Data center operators consume vast amounts of electricity making scope 2 emissions a major concern. In addition, data center developers and owners face significant scope 3 emissions from embodied carbon from the building materials and the IT hardware required to develop these assets. Effective strategies to reduce data center emissions include:
- Optimizing computing needs and power usage: Use real-time metering and AI-powered analytics to optimize electricity usage across time and locations.
- Procuring low-carbon electricity: Secure long-term access to compliant low-carbon electricity through power purchase agreements (PPAs) or high-impact renewable energy credits (RECs).
- Tracking life cycle emissions: To provide a comprehensive emissions assessment, account for embodied carbon in server manufacturing and end-of-life disposal.
Financial Services: Assessing Emissions From Investments and Portfolios
Financial institutions face significant challenges in evaluating scope 3 financed emissions from investments, loans, and asset portfolios. Key strategies to address these challenges include:
- Adopting industry standards: Frameworks like the Partnership for Carbon Accounting Financials (PCAF) can be used to standardize emissions calculations.
- Understanding asset level data: To accurately report on financed emissions, investors need visibility of emissions data, ideally at the company level.
- Prioritizing green investment strategies: Shift toward sustainable finance by integrating sustainability criteria and emphasizing green bonds or low-carbon funds or investments.
- Ensuring regulatory compliance: To enhance transparency, align with global disclosure frameworks like the International Sustainability Standards Board's (ISSB) IFRS S2 climate-related disclosure standard.
Philanthropies: Managing Emissions From Private Financing
Philanthropic organizations face challenges in tracking emissions across diverse funding activities, operational footprints, and investment portfolios. Effective strategies include:
- Assessing grantmaking impact: Many philanthropies support climate initiatives but may not track the carbon impact of grantees or funded projects. Establishing emissions metrics for grants can enhance transparency and effectiveness.
- Measuring operational emissions: While some philanthropies have relatively low direct emissions, travel, events, and office space still contribute to their carbon footprint. Implementing sustainable operations policies can help reduce emissions.
- Decarbonizing investment portfolios: Endowments and investment funds often hold assets with varying GHG emissions. Aligning investments with sustainability goals and engaging with asset managers on emissions reduction can drive impact.
Organizations across these sectors can enhance emissions transparency, improve sustainability efforts, and align with global climate goals by implementing industry-specific carbon accounting methods.
Navigating Evolving Standards and Scope 2 Complexity
Carbon accounting standards are actively evolving. In October 2025, the GHG Protocol released two proposals for scope 2 accounting revisions, with final standards expected by 2027. The proposals shift toward hourly and regional renewable energy matching, moving away from today's annual, region-agnostic approach. They also introduce consequential methodology that calculates actual emissions displaced by renewable projects, which varies significantly by region.
For organizations with 2030 climate targets, timing matters. Existing long-term contracts are expected to be grandfathered in under new rules. Meanwhile, new renewable projects face interconnection delays of 3 to 5 years, and the US power grid is experiencing sustained demand growth driven largely by data centers. These pressures converge: power demand is rising while new clean electricity supply is constrained.
Navigating these changes requires understanding emerging methodologies and their strategic implications. See our companion pieces on Navigating Scope 2 Accounting Changes and Scope 2 Emissions Explained for detailed context.
Frequently Asked Questions
How long does carbon accounting implementation take?
Initial measurement typically takes 3 to 6 months, depending on data availability and organizational coordination. Starting with data you already have (utility bills, fuel records) accelerates the process. Scope 2 and scope 3 require more extensive work than scope 1, so actual timelines vary based on which scopes are your focus.
What are the biggest obstacles to getting accurate emissions data?
Data siloes across departments (finance, operations, procurement track separately). For scope 2, grid-average factors mask location- and time-specific variations that actually drive emissions. For scope 3, extensive data collection and supplier coordination are required. Seamless collaboration across departments is essential.
Do we need to measure all three scopes to start?
Yes. Organizations should measure all three scopes. Start where your business is most materially affected, but eventually measure all three for compliance and complete visibility into your emissions sources.
Carbon Capture for Natural Gas-Fired Power Generation: An Opportunity for Hyperscalers
Key Takeaways
- AI-driven data center demand is outpacing grid capacity, and hyperscalers are bringing more natural gas, which already supplies about 40% of US electricity, online to meet their needs.
- Pairing carbon capture and sequestration (CCS) with natural gas lets data centers source firm power today while cutting plant-level emissions up to 95%—without waiting on multi-year renewable interconnection queues.
- The Google-Broadwing deal demonstrates real progress and commitment toward natural gas with CCS as the first major commercial deployment of this exact pathway
Meeting Electricity Demand and GHG Emission Reduction Targets
Rapid growth in electricity demand across the US, driven by AI data center expansion and increased industrial electrification, is placing significant pressure on power grids. After decades of stable electricity load, demand has increased significantly since 2022 and is expected to rapidly grow for the foreseeable future. Natural gas currently fuels around 40% of US electricity generation. Its share is expected to grow in the coming years. However, unabated natural gas generation is not compatible with stakeholder targets to reduce greenhouse gas (GHG) emissions. Combining CCS with natural gas-fired generation is one pathway to meet growing electricity demand and achieve GHG emission reduction targets.
[cta]
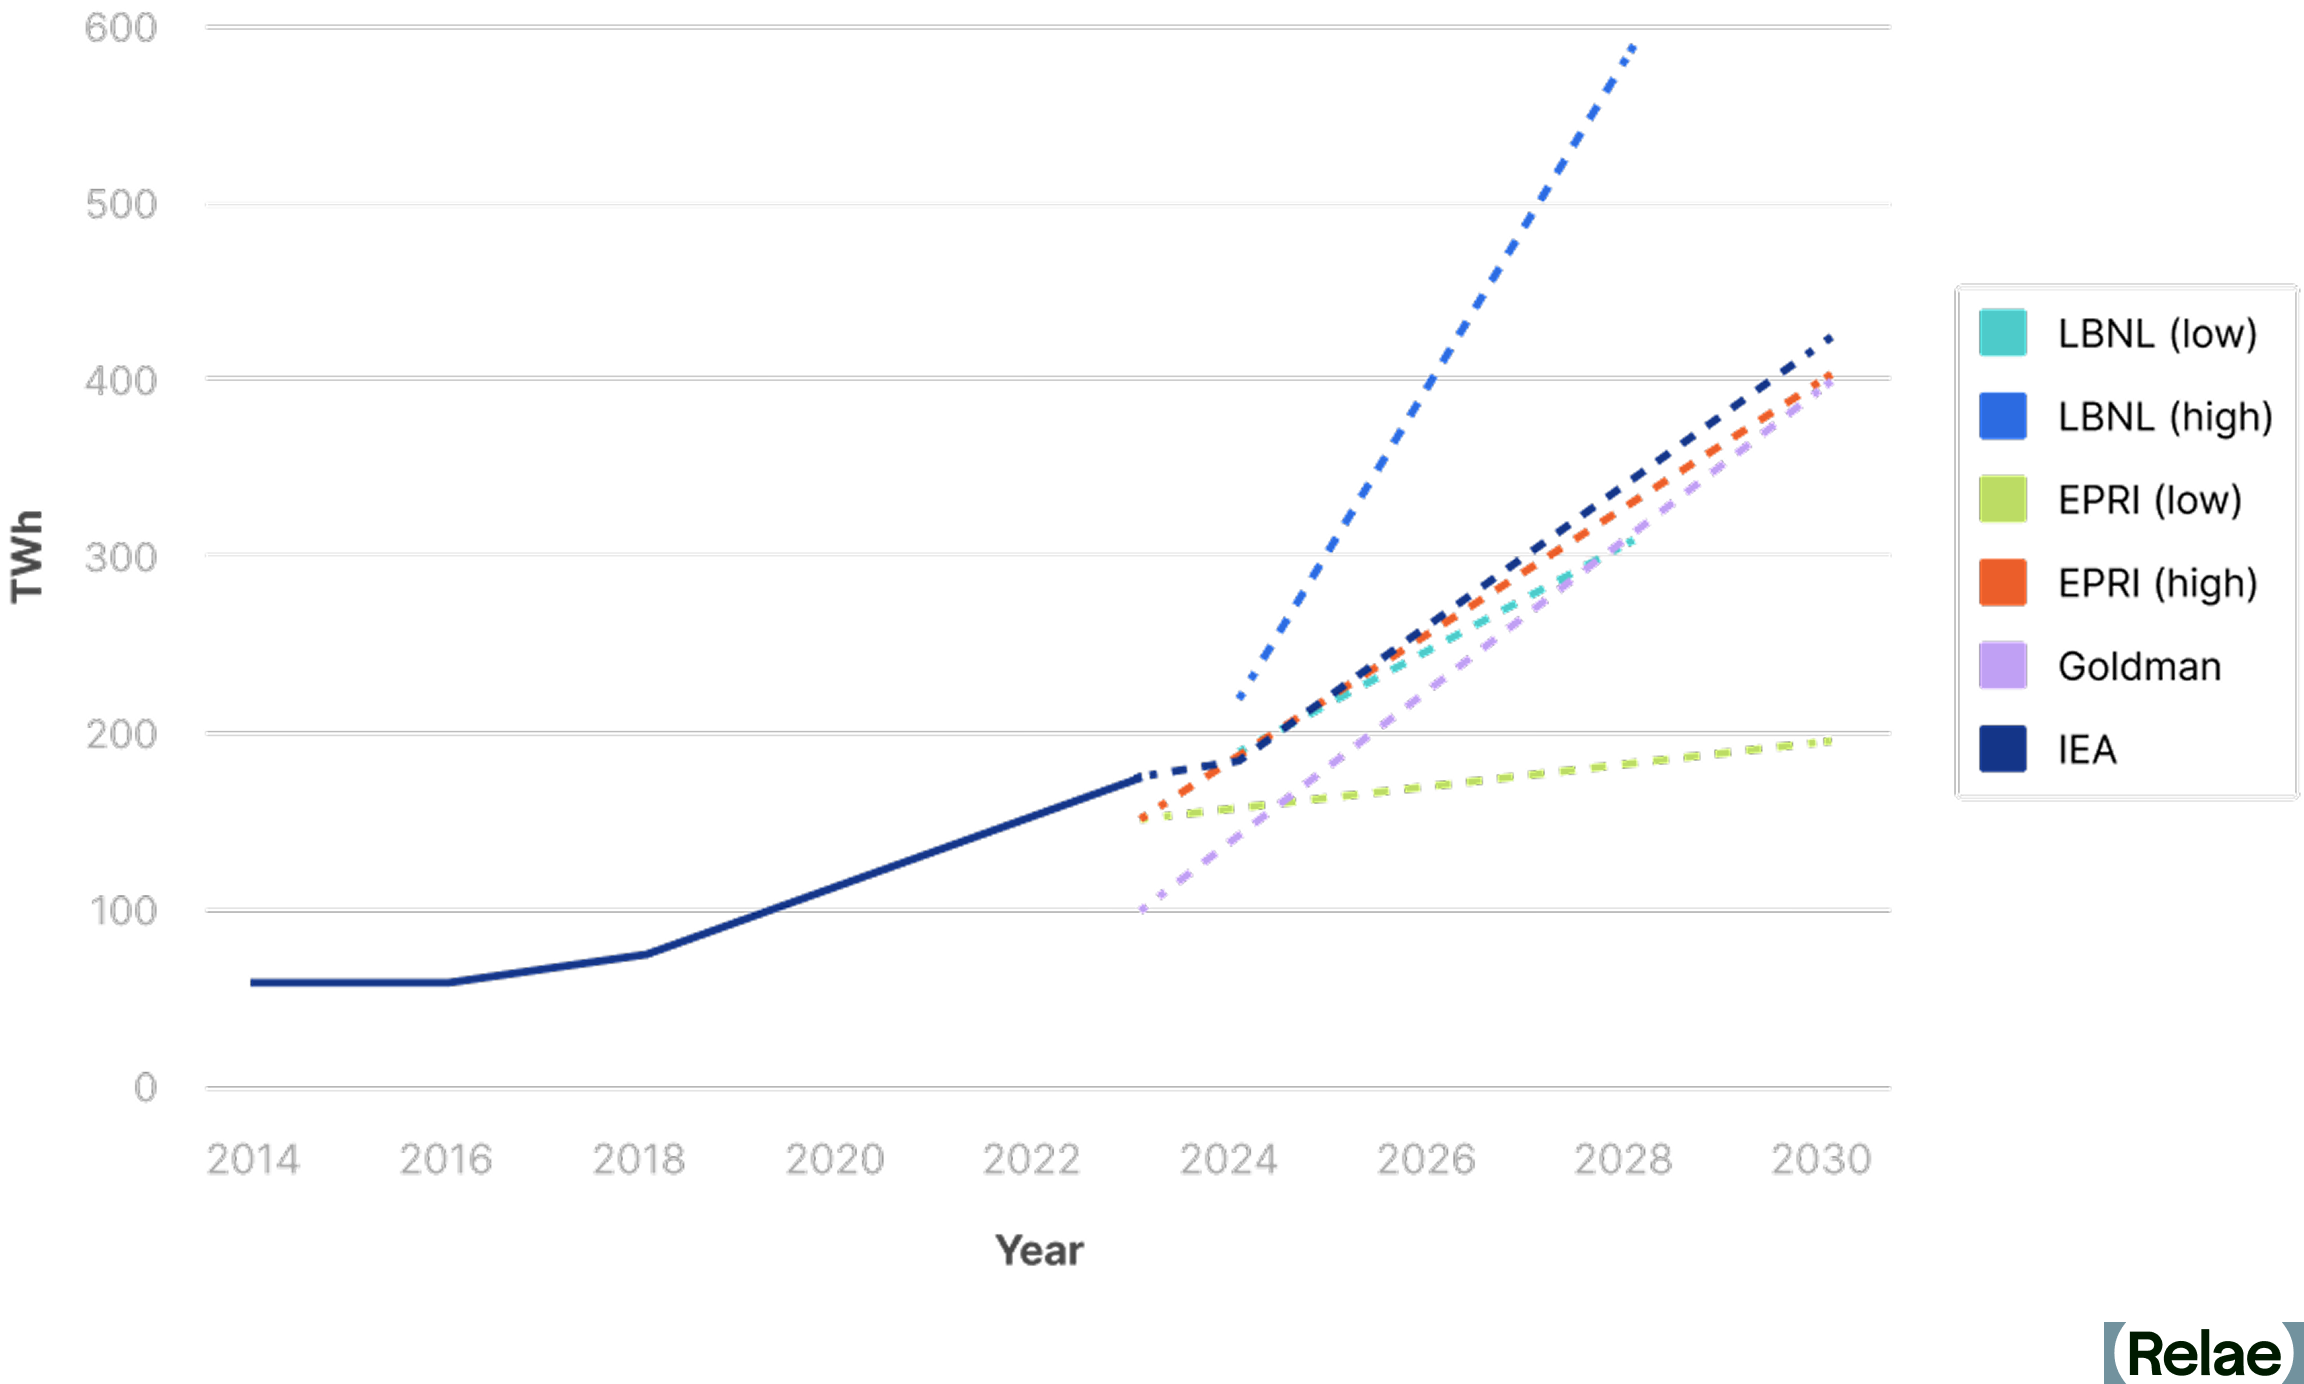
The Role of Natural Gas in Electricity Supply
Natural Gas Generation Versus Renewable Generation Deployment
Electricity generators can provide multiple products to regional grids, generally providing two services: energy (power production) and reliability (consistent availability). Natural gas-fired plants can provide both, whereas renewable energy sources like wind and solar generate energy but offer less reliability.
As electricity demand rapidly grows, grids will need both energy and reliability to function effectively. However, the interconnection queue for renewable energy assets has a years-long backlog which is delaying their deployment. Grids will need additional reliability assets to support the large amounts of renewables (usually in the form of storage). Some jurisdictions are creating an alternate pathway for natural gas plants to bypass the lengthy interconnection queue which may allow for the rapid development of natural gas generators. Hyperscalers are also pursuing development of large behind-the-meter (BTM) generation of electricity from renewable and fossil sources, but these must also meet high standards for reliability.
The Case for Carbon Capture Deployment
Electric utilities and developers of data center infrastructure are planning to build substantial new natural gas generation assets in addition to maximal deployment of renewable electricity. CCS technology enables natural gas plants to deliver stable, continuous power while significantly reducing emissions by capturing up to 95% of emitted CO₂. Natural gas plants with CCS are viable options to deliver the lower-emission, reliable power needed to respond to rapidly emerging AI data center power demand growth. The 45Q tax credit, a key government incentive for CCS, was preserved and effectively strengthened under 2025's One Big Beautiful Bill Act. The Google-Broadwing deal, the first major commercial deployment of this exact pathway, was signed in October 2025 and serves as a useful proof point.
Benefits of Integrating CCS into Natural Gas Power Generation
Integrating CCS into natural gas-fired power plants provides several advantages for data center stakeholders:
- Reduced carbon emissions: Achieve emission intensities of approximately 80–120 kg of CO₂ equivalent per megawatt-hour (CO₂e/MWh), significantly below the current US grid average of approximately 340–420 kg CO2e/MWh.
- Reliable baseload power: Continuous, predictable electricity delivery.
- Compact infrastructure: Requires less land compared to renewable energy projects, simplifying data center siting near existing infrastructure.
- Cost: CCS integrated with new natural gas-fired generation can deliver low-cost decarbonization. Relae estimates $75-150/MWh, which is competitive in many markets with other firm baseload options such as new nuclear power or wind and solar with battery backup.
Seven Key Considerations for Implementing CCS
Stakeholders considering CCS technology must carefully evaluate seven critical factors:
1. Meeting Rapid Deployment Timelines
Traditional natural gas plants can be operational within roughly 18 months, provided they bypass interconnection queues for reliability purposes and have access to key equipment. Integrating CCS technology extends this by an additional 18–36 months. Designing plants to be "capture-ready" allows for quicker initial deployment and smoother CCS integration in the future. However, deploying a capture-ready plant without a commitment to build the carbon capture portion is inconsistent with serious climate action.
2. Sizing Plants Optimally
CCS is most economically and environmentally optimal at natural gas plants with capacities of 100 MW or greater. It offers significant opportunities for emissions reductions for the forecasted new data center load. CCS is not suitable for smaller or highly variable natural gas plants.
3. Selecting Effective Carbon Capture Technology
CCS technologies such as solvents, sorbents, membranes, and oxyfiring vary significantly in maturity, efficiency, and cost. Choosing the right approach requires thorough evaluations aligned with specific project requirements. These will vary by setting and configuration (e.g., turbine class, reciprocating engines, number of units, water availability, etc.).
4. Navigating CO₂ Transportation Logistics
The safe and efficient transport of captured CO₂ via pipelines, rail, or barges is critical. Aligning infrastructure planning with overall project timelines prevents delays.
5. Ensuring Safe and Effective Sequestration
If there is no CO₂ storage, there is no project. Permanent CO₂ storage in Class VI injection wells requires detailed geological studies and regulatory permitting. Early collaboration with experienced sequestration operators is essential to success.
6. Conducting a Comprehensive Life Cycle Analysis
Full life cycle emissions analyses, including upstream methane leakage, construction impacts, and CO₂ transportation, are critical for accurate environmental assessments and ensuring low-carbon electricity supply. Prioritizing low-leakage, third-party verified natural gas supply enhances positive climate impacts.
7. Performing Siting Feasibility Early
An early and quick feasibility assessment is critical to identifying promising opportunities and key barriers at candidate CCS sites. Important factors include available transmission capacity, the potential to expedite approval of interconnection for thermal resources, regulatory barriers, state and local incentives, the sufficiency of natural gas infrastructure, and water supply.
Frequently Asked Questions
How much longer does adding carbon capture take compared to building a natural gas plant alone? Traditional natural gas plants can be operational within roughly 18 months, provided they bypass interconnection queues for reliability purposes and have access to key equipment. Integrating CCS technology extends this by an additional 18–36 months.
Is a "capture-ready" natural gas plant a legitimate climate strategy if the capture portion isn't committed yet? Designing plants to be "capture-ready" allows for quicker initial deployment and smoother CCS integration in the future. However, deploying a capture-ready plant without a commitment to build the carbon capture portion is inconsistent with serious climate action. “Capture committed” is a better stance than “capture ready”.
How does the cost of natural gas-fired power with CCS compare to nuclear or renewables with battery storage? CCS integrated with new natural gas-fired generation can deliver low-cost decarbonization. Relae estimates $75-150/MWh, which is competitive in many markets with other firm baseload options such as new nuclear power or wind and solar with battery backup.
Has any hyperscaler actually deployed natural gas-fired power with CCS at scale yet? The Google-Broadwing deal, the first major commercial commitment of this exact pathway, was signed in October 2025 and serves as a useful proof point. Others are in development.
[cta]
How Relae Supports Data Center Decarbonization
Natural gas-fired generation combined with CCS is a proven solution for meeting the urgent electricity demands of data centers while significantly reducing emissions. Relae helps stakeholders navigate the complexities of CCS deployment through deep, science-backed expertise and strategic advisory services. Our experienced team provides comprehensive support throughout CCS project planning and execution, including technology selection, life cycle emissions analysis, infrastructure assessment, project viability, regulatory compliance, and risk management.