Shaping Speed to Power: What the FERC Show Cause Responses Mean for Data Centers
Over the past week, five of the six regional transmission organizations (RTOs) and independent system operators (ISOs) under the Federal Energy Regulatory Commission’s (FERC) jurisdiction filed responses to its June show cause orders on large load interconnection. These submissions cap a year-long back-and-forth between FERC and grid operators that will define the future of large load interconnection in the US. This analysis reviews key findings from the grid operators’ responses, anticipates FERC’s likely responses to grid operators’ proposals, and outlines implications for large loads seeking to interconnect.
Key Takeaways
- Common building blocks, but alignment remains out of reach. Every filing offers some mix of interim or non-firm service, bring-your-own-capacity options, pro forma cost recovery agreements, and public disclosure of upgrade costs. How they fit together differs by region, and study timelines range from 90-day study clocks in the Southwest Power Pool (SPP) and ISO New England to an 18-24 month cycle in New York.
- Cost recovery becomes explicit. Each region’s filings spell out who pays for the upgrades large loads require, through cost recovery agreements, financial security and, in ISO New England, exit fees. All five filings also commit to publishing upgrade cost information.
- The price of speed is flexibility. The fastest routes to the grid run through non-firm or curtailable service. Most new tariffs would take effect in early 2027, but PJM’s first combined study cycle wouldn’t finish until 2029, MISO’s flexible service (GRITS) would not start until January 2029, and ISO-NE’s new services begin on June 1, 2028.
- FERC has drawn a line in the sand. Its October rejection of PJM’s Interim Resource Adequacy Service signaled that grid operators can offer non-firm service that large loads choose, but cannot set curtailment priorities or retail terms that belong to states.
Why FERC Ordered Grid Operators to Act on Large Loads
FERC has historically avoided regulating the interconnection of loads to interstate transmission. Concerns over cost shifting, reliability, and queue timelines have now prompted the Commission to direct grid operators to establish new service frameworks that connect large loads efficiently and fairly.
The push began on October 23, 2025, when Energy Secretary Chris Wright directed FERC to initiate a rulemaking to standardize how large loads interconnect to the transmission system. While that request was pending, FERC handled large load issues one docket at a time.
Instead of issuing a formal rulemaking, FERC issued six separate orders to show cause on June 18, 2026, one for each FERC-jurisdictional RTO and ISO: PJM Interconnection, the Midcontinent ISO (MISO), Southwest Power Pool (SPP), the California ISO (CAISO), the New York ISO (NYISO), and ISO New England (ISO-NE). These orders direct each operator and its transmission owners to either justify how existing tariffs already accommodate large and co-located loads or propose tariff revisions. FERC left the definition of “large load” to each operator, while suggesting that a threshold of 50 MW peak load for a direct transmission interconnection would be reasonable.

Writing the Rules for Speed to Power: The Five Reforms FERC Asked For
Data center and other large load developers are rightly focused on speed to power, but with generation backlogs across the country, grid operators must expand their tariff mechanisms to facilitate timely and fair interconnection without reducing reliability. The show cause orders identified the following five categories of reform for grid operators to address:
- Efficient study process: Development of efficient transmission service application and study processes, including consideration of the impact of alternative transmission technologies.
- Cost transparency: Preventing cost shifting and requiring transparency into transmission costs.
- Co-Location Rules: Clarifying the rates, terms, and conditions for co-location arrangements and behind-the-meter (BTM) generation.
- Flexible Load Service: Offering new transmission services for flexible large loads.
- Generation Studies: Developing a process to study generation facilities that serve electrically proximate large loads and co-located loads.
Four of the five categories aim to speed up interconnection. The fifth, cost transparency, reflects FERC’s concern that upgrades driven by large loads could shift to customers who don’t benefit. Early drafts largely sidestepped it. The final filings put it front and center.
SPP and PJM Set the Template for Faster Interconnection
Before the show cause orders, most grid operators did not offer a dedicated study track for large load interconnection. SPP is the most notable exception under FERC jurisdiction, and its High Impact Large Load (HILL) services, approved by FERC on January 14, 2026, have become the template for other grid operators. The host transmission owner runs the Load Connection Study while SPP runs the HILL delivery point study in parallel on a 90-day timeline. The HILL Generation Assessment (HILLGA) covers generation paired with the large load.
The trade-off for faster studies is less firm service. On June 5, 2026, FERC approved SPP’s Conditional High Impact Large Load Service (CHILLS), a bridge service of up to seven years while customers wait for permanent firm transmission upgrades and generation capacity. Under this non-firm service, HILLs can be curtailed or interrupted during grid emergencies, system constraints, or stress periods to ensure reliability.
In February 2026, in a separate co-location proceeding, PJM proposed a similar interim service, Interim Network Integration Transmission Service (Interim NITS), in response to FERC’s finding that PJM’s tariff was unjust and unreasonable because it lacked clear, consistent rates, terms, and conditions for serving co-located load. FERC generally accepted PJM’s Interim NITS terms in its June 2026 Co-Location Order, while requiring more flexibility in the Contract Demand services. PJM’s November filing would extend Interim NITS beyond co-located loads.
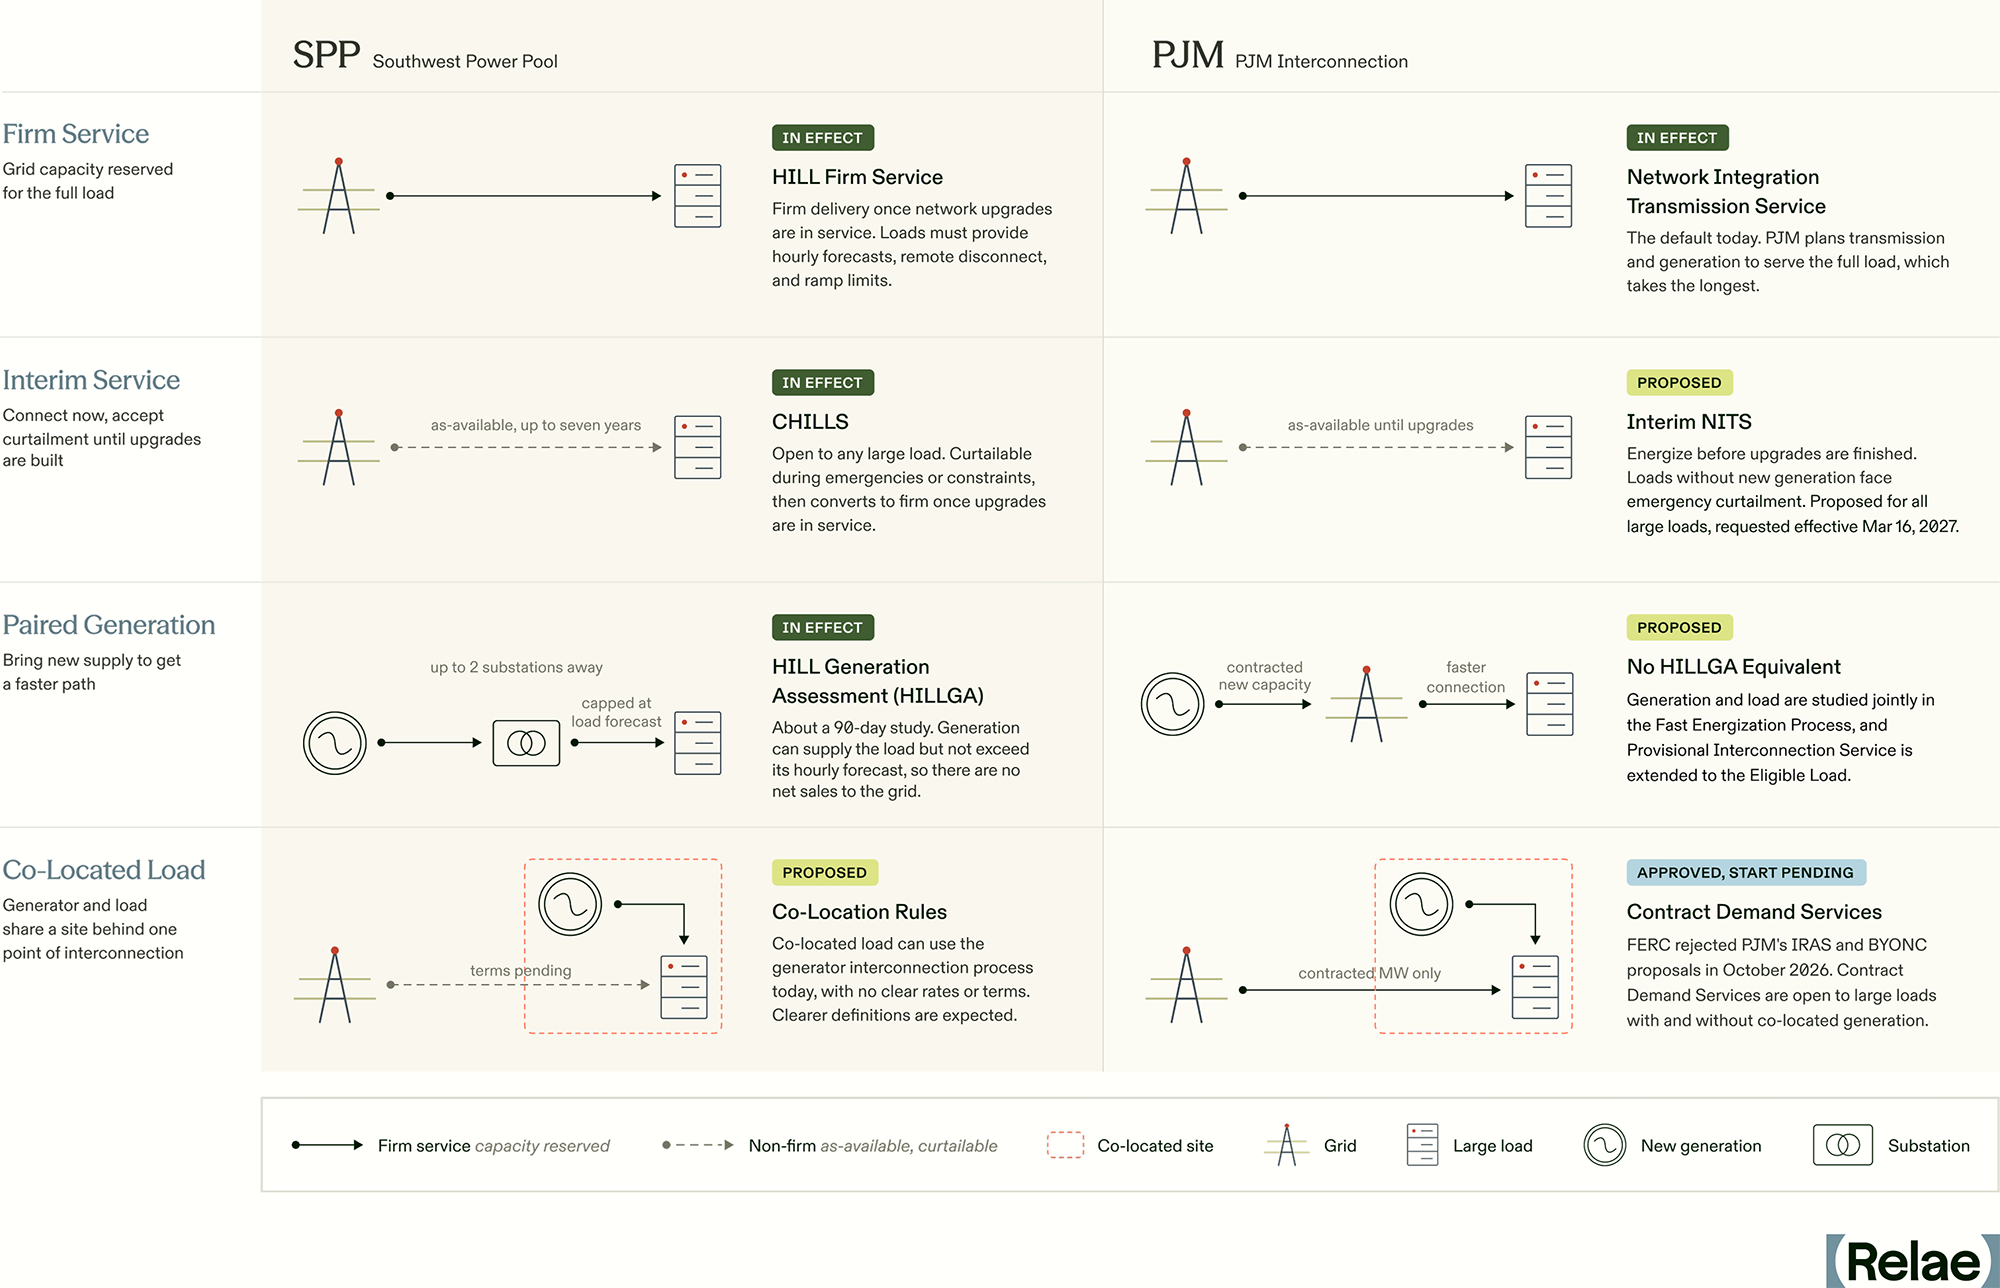
More recently, FERC rejected the majority of PJM’s Interim Resource Adequacy Service (IRAS) framework, which would have enabled new large loads to interconnect before sufficient capacity existed to serve them, under the condition that these loads be curtailed first. FERC found the tariff language appeared to intrude on state retail authority by dictating which retail customers would be curtailed and setting what amounted to a retail rate, and that it didn’t match PJM’s own description of the proposal. The message to other grid operators: non-firm service has to be something large loads choose, not a penalty imposed on them. Still, PJM’s service proposals for Interim NITS, Firm Contract Demand Service, and Non-Firm Contract Demand Service demonstrated the viability of permanent and temporary services for co-located and other large loads. Figure 1 compares SPP’s and PJM’s services side by side.
Five Conditions Data Center Developers Should Plan For
The grid operators’ proposals share several conditions for interconnection, each of which poses challenges for developers seeking fast interconnection.
- Faster, but conditional access: Faster access usually means non-firm service: ISO-NE would redispatch whenever local prices exceed $250/MWh, MISO would interrupt its non-firm flexible service above $100/MWh (still allowing service in more than 95% of hours, by MISO’s estimate), NYISO would curtail non-firm loads through a mandatory $200/MWh bid cap, and PJM requires customers to cut withdrawals within five minutes. Market models need to price that curtailment risk and the time it takes to convert to firm service.
- Bring your own new capacity or generation (BYONC/BYONG) is the new standard: ISO-NE’s requirement for Firm Contract Demand Service, MISO’s LARS and Zero-Injection Generator Interconnection Agreement (ZGIA), and NYISO’s Partner Resource Arrangement and Co-Located Arrangement options all reward projects that bring their own generation with faster connection. Contracting new generation at or near the site is likely to become a prerequisite for faster interconnection.
- Higher commitments, more transparency: Application fees, study deposits, pro forma cost recovery agreements, and collateral are likely to be steeper, especially for loads that do not bring new generation. ISO-NE proposes a $50,000 application fee, a $150,000 study deposit, and an exit fee if a load leaves early, and all five filings commit to publishing upgrade cost information, leaving less room to negotiate bespoke terms.
- Co-location rules are clearer, but not free: Rules governing gross load settlement and BTM netting will drive project economics, and details on the definitions of electrically proximate loads will determine project configurations. Grid operators diverged on netting, with PJM capping retail BTM netting at 50 MW, while ISO-NE proposed a zero-MW netting threshold, effectively barring large loads from netting BTM generation for wholesale settlement.
- Transition provides clarity, but also risk: Tariffs are likely to change between November 2026 and mid-2027. Projects with pending transmission service agreements will need to review proposals for grandfathering and transition provisions, and should consider submitting comments on grid operators' tariff filings to highlight relevant concerns.
What the Grid Operators Proposed
PJM proposes the biggest overhaul in its November 16 filing. Its Fast Energization Process would study generation and large load requests together in a single 12-month cycle. It would make Interim Network Integration Transmission Service, Firm Contract Demand, and Non-Firm Contract Demand service available to any large load, not only co-located ones. The filing also withdraws and replaces PJM’s August 17 co-location compliance filing, bringing co-located and other large loads under one framework. PJM also caps behind-the-meter generation netting at 50 MW and separately proposed ride-through requirements for large computational loads, and its transmission owners filed companion terms for rates, cost recovery, financial protections, and transparency. The 50 MW netting cap includes a three-year transition and exemptions for arrangements in place as of December 18, 2025. PJM asked FERC to rule within 120 days and requested a March 16, 2027 effective date for the new services and netting limit. The transmission owners would assign the large-load-driven share of upgrade costs to the zones hosting those loads for 15 years, after which regional allocation applies.
On October 2, 2026, MISO filed its Large Load Addition Resource Study (LARS) as a direct response to FERC’s show cause order. The transmittal letter specifies that LARS is restricted to loads of 200 MW or greater with a 15-year pairing commitment with a generation asset in the same local resource zone, and reduces the study timeline to 120 days. MISO also filed a Zero-Injection Generator Interconnection Agreement (ZGIA) on August 18, 2026, which would create a 90-day study process for generators serving large loads at the same substation and voltage level. MISO’s November 16 filing adds a Large Load Project Review process, new transmission service options, and pro forma cost recovery agreements. A companion filing proposes Grid Responsive Integration Transmission Service for loads that curtail under price and reliability conditions, though MISO says it cannot offer that service until January 2029. MISO’s Large Load Project Review runs three study cycles a year, each taking about five months. Applicants must lock in their requested service and MW when they apply. New services include Interim NITS and Firm Service Step Up, which lets loads move to firm service in increments as transmission capability becomes available. MISO requested a February 14, 2027 effective date.
CAISO fast-tracked its Large Loads Stakeholder Initiative. Its November 16 filing defines a large load as any single site with peak load of 50 MW or more, with no voltage threshold, and leaves load studies with the participating transmission owners (PTOs), which CAISO expects to complete within 60–90 days under their own tariffs. Similar to SPP’s CHILLS and PJM’s Interim NITS, the proposal includes a Flexible Interim Load Interconnection (FILI) service. FILI terms are negotiated case by case with the transmission owner, and CAISO plans a permanent version in 2027. CAISO will prioritize stand-alone and co-located interconnections and address proximate load and generation arrangements in a later stakeholder process. CAISO will also publicly post aggregate large load additions, planned upgrades, and their cost estimates. CAISO requested a February 16, 2027 effective date, and loads already operating, or with complete transmission owner requests before then, aren’t treated as large loads.
NYISO filed new Large Load Integration Procedures with two services in its November 16 filing, Firm and Non-Firm Withdrawal Service, plus a Zero Withdrawal designation for loads that take no energy from the grid. Projects identified by New York’s Department of Public Service can qualify for firm service without NYISO’s standard resource adequacy test, as long as their combined impact does not cause a resource adequacy violation; they still face transmission security review. NYISO’s study cycle is the longest proposed: an initial phase that includes a 90-day system impact study, followed by a year-long assessment of load integration, for roughly 18 months to two years in total. NYISO acknowledges this exceeds the 60–90 days FERC contemplated. Under NYISO’s proposal, non-firm loads are curtailed when their local price reaches $200/MWh, and all large loads pay fees on a gross load basis, and those with non-firm service also pay a System Reliability Benefit Fee. NYISO requested a February 1, 2027 effective date for the procedures, with related market rule changes effective June 1, 2028.
ISO-NE filed on November 13. Its proposal covers loads of 50 MW or more connected above 60 kV, and applications open June 1, 2027, with 90-day system impact studies, followed by additional analysis and a 90-day facilities study where needed. ISO-NE’s proposal sets out three services mirroring PJM’s services framework: Firm, Interim, and Non-Firm Contract Demand Service.
Interim and non-firm customers are re-dispatched whenever their local price exceeds $250/MWh, and interim service lasts up to seven years or until upgrades are complete, whichever is longer. Large loads must bring their own new capacity, and certain large loads will be excluded from the capacity market’s installed capacity requirement, with details to follow in a later filing. ISO-NE will post each large load’s network upgrades and cost estimates, and a load that leaves early pays the net book value of its upgrades plus decommissioning costs.
How to Position for FERC’s Next Move
The show cause responses make the terms of faster interconnection clear: large loads that accept curtailment, bring new generation, and post larger financial commitments will connect first. FERC’s orders on the filings will set how far those terms can go. Relae expects that FERC will accept SPP, MISO, and ISO-NE proposals largely as filed, while PJM, CAISO, and NYISO will be pressed for improvements, additional details, and potentially compliance directives. Here’s what we're anticipating:
- SPP: FERC has already approved HILL, HILLGA, and CHILLS approaches, and the show cause order nodded to these approaches as a template.
- MISO: The proposal addresses FERC’s areas for reform; however, FERC may request MISO to further justify or amend the 200 MW threshold for LARS and 2029 commencement for flexible service (GRITS).
- PJM: The three services are likely to be accepted following provisional approval under the Co-Location Order; however, FERC may push back on the 2029 commencement timeline, the 15-year zonal allocation, and the 80-100% minimum financial commitment requirement.
- CAISO: FERC is likely to take issue with the bespoke terms of FILI, which are negotiated on a case-by-case basis. FERC may require CAISO to establish a pro forma agreement for FILI, given the request for “clear and consistent” tariff provisions.
- ISO-NE: FERC is likely to accept the proposal largely as is; however, the BYONC requirements resemble those rejected by FERC in PJM’s IRAS proposal, and may similarly be rejected.
- NYISO: The proposal’s anticipated study timeline of 18-24 months exceeds FERC’s recommended 60-90 day timeline, and the decision to exclude “State Exempt Large Load Projects” from the operator’s Resource Adequacy Impact Standard and provide these loads with Firm Withdrawal Service is likely to draw scrutiny for undue discrimination.
Tariffs will continue to change through mid-2027 and beyond, so developers with projects in the queue should review each region’s transition and grandfathering provisions now and consider filing comments while the record is open. When selecting sites, developers should weigh not only available capacity but how long a project can operate on non-firm service, what it will cost to reach firm service, and opportunities to bring their own new capacity.
Relae helps developers, hyperscalers, power producers, and investors work through each of these conditions, from region to energized site. We screen regions by queue conditions, transmission constraints, and the services each grid operator offers, weighing how long a site might run on non-firm service and what it will cost to reach firm service. We model curtailment exposure and size load flexibility, storage, and new generation to meet bring-your-own-capacity requirements, and test co-location configurations against gross load settlement and netting rules. We build deposits, collateral, and upgrade costs into project financial models, using new registries and cost disclosures as benchmarks. And we track filings and transition provisions through mid-2027 so clients can comment while the record is open. For investors and lenders, our technology diligence and resource adequacy assessments test whether a project’s power strategy holds up under curtailment and changing tariffs.
Frequently Asked Questions
What is FERC’s show cause order on large loads?
On June 18, 2026, FERC ordered each of the six RTOs and ISOs under its jurisdiction to either justify its existing tariff or propose revisions in five areas: study processes, cost transparency, co-location, flexible load service, and generation serving nearby large loads. FERC suggested 50 MW as a reasonable threshold for defining a large load.
How long does it take to connect a data center to the grid?
Under the proposals filed, large load study clocks run from 90 days in SPP and ISO New England to a 12-month cycle in PJM and up to two years in NYISO. Faster access usually comes through interim or non-firm service. Firm service follows once network upgrades and, in some regions, new generation is in place, which can take several years. In several regions, including SPP, MISO, and ISO New England, bringing your own new generation, on site or nearby, offers a faster path to interconnection or to firm service.
What is a non-firm transmission service for data centers?
Non-firm service lets a large load connect before network upgrades are complete, on the condition that it can be curtailed during emergencies or constrained periods. SPP’s CHILLS, for example, offers it for up to seven years while upgrades are built.
Policy
Relae helps companies, investors, power providers, and project developers navigate the rules, regulations, incentives, and policy frameworks shaping energy and climate decisions. We combine policy intelligence, market analysis, and technical expertise to help you understand regulatory risk, identify commercial opportunities, and align strategy across US state, federal, and international markets.
A Grid Question: Federal Data Center Policy in the United States 2026



Douglas Bryan

Douglas Bryan
,

Douglas Bryan is an energy economist with a decade of experience across global energy markets, including the US, Canada, Europe and Australia. He specializes in evaluating the impacts of policy and investment decisions through advanced energy system modeling.
Douglas has led a diverse range of analyses on utility integrated resource planning, electricity decarbonization policy, and market advisory due diligence. He has extensive experience evaluating the business case for power sector investments, including battery and long-duration energy storage, and advising utilities on the greenhouse gas implications of load and resource planning scenarios. He also leads Relae’s battery storage modeling Beyond electricity, he has simulated deployment of Carbon Dioxide Removal technologies, including Direct Air Capture, BECCS and Ocean Alkalinity Enhancement, via energy-economy modeling.
A trusted expert in energy system and economic analysis, Douglas previously served as a Senior Project Manager at Navius Research, where he presented at regulatory tribunals and led technical workshops. At Relae, he leverages this background to help clients navigate complex decarbonization efforts. He provides the rigorous analysis needed to quantify the carbon impact of operations and identifies the most effective strategies for integrating low-carbon energy solutions into power portfolios.

Rory Jacobson

Rory Jacobson
Rory Jacobson is the Head of Policy at Relae. Previously, he served as the Director of the Carbon Dioxide Removal program within the Office of Fossil Energy and Carbon Management (FECM) at the U.S. Department of Energy (DOE). In previous roles at DOE, Jacobson has supported and coordinated FECM’s carbon removal and management programs and projects.
Prior to joining DOE, Jacobson was a Deputy Director of Policy at Carbon180, where he managed the federal policy portfolio for engineered carbon removal pathways. He has led carbon management research and analysis in multiple roles, including with the Natural Resources Defense Council and the World Resources Institute, and Relae. Jacobson received his master’s in environmental management from the Yale School of Forestry, where he was a Kerry Fellow.
Kerry Fellowship (2021-2022)
Yale Jackson School of Global Affairs
Secretary’s Honor Award (2023)
U.S. Department of Energy
What to Read Next
How Does Geothermal Compare to Other Clean Firm Power Options?
Key Takeaways
- Geothermal shares the clean firm category with only three other technologies: nuclear, natural gas with carbon capture and storage (CCS), and solar or wind paired with long-duration energy storage (LDES).
- Buyers comparing geothermal to solar or unabated natural gas power contracts are comparing different products: one isn’t firm, the other isn’t clean, and both remain cheaper options because they satisfy less of what buyers currently need.
- Geothermal’s cost premium is real, but so is the value it delivers. Geothermal can reach 90%+ capacity factor, delivering dispatchable clean power around the clock, and it sidesteps the gas turbine manufacturing backlogs and pipeline infrastructure delays slowing other firm power technologies.
- Geothermal is closer to commercial readiness than most buyers realize. As demand for firm, low-carbon power intensifies, geothermal warrants a serious look alongside nuclear and gas with CCS.
Geothermal is Gaining Traction Despite Its Cost Premium
Hyperscalers, corporate energy buyers, and data center developers face unprecedented pressure to procure clean power. Wind and solar have played a major role in meeting this need, but they are intermittent, and load growth is accelerating and changing. This market pressure is creating bottlenecks that cannot be solved without new grid infrastructure and/or substantial additions of energy storage. Geothermal, which does not suffer from intermittency, has gained tremendous momentum as a challenger to wind and solar, yet it carries one seemingly glaring disadvantage: its cost.
Yet, major utilities and hyperscalers alike are lining up for geothermal offtake anyway: Southern California Edison and Google have signed separate contracts with Fervo, and Meta has two 150 MW agreements in place with Sage and XGS. These contracts are signaling a growing shift in power markets: not all megawatt-hours are created equal, and the cheapest contracts may no longer contain what buyers truly need.
Fast, Clean Firm Power: What Buyers Need Today
In the clean firm power evolution, clean came first. Buyers signed solar and wind power purchase agreements (PPAs) and matched their annual consumption with renewable energy contracts, or offset them with renewable energy certificates (RECs). With lax carbon accounting, solar and wind remain unbeatable on price. But annual emissions tallies conceal something important—a buyer can procure as much renewable electricity as it consumes over a year while still depending on the rest of the grid during the hours when those resources are unavailable. To close that gap, buyers need a source that delivers clean power around the clock, firmly in every hour, on demand.
Two unforgiving demands have followed since: speed and location. With today’s rapid buildout of new load, a power source needs to come online in time to deliver power when the customer needs it. It is also important to connect near a customer’s location because existing transmission assets are often fully subscribed. Failure on either axis can disqualify a project. However, a contract that can meet all attributes: clean in every hour, firm on demand, quick to deliver, and able to reach the load, might be the best (or only) option available. It is also likely to be considerably more expensive than those annual solar benchmarks that only met the clean condition.
Four Technologies Make the Clean Firm Power Shortlist
Given this strict set of constraints, what power options should buyers consider? The right set of technologies should aim to solve as many of the aforementioned conditions as possible, and that leaves a fairly tight shortlist:
- Solar or Wind paired with Long-Duration Energy Storage (LDES): To achieve the level of reliability that many buyers, including data centers, require, solar or wind would have to be paired with LDES, beyond 4–8 hours, to be able to cover evening hours and remain online during increasingly common extreme weather events. While there are promising LDES technologies on the horizon, most remain expensive and not yet widely commercial. Costs rise significantly compared to a standard solar or wind PPA, and viability varies by location. This will be increasingly competitive as storage costs fall, but not yet a mature firm-power solution at scale.
- Natural Gas with CCS: With large amounts of unabated natural gas generation coming online, CCS is an attractive option to mitigate a large portion of these emissions while retaining time to power (by building gas first and adding CCS later) and the dispatchability of gas-fired power. On the flip side, CCS is operationally complex, geographically restricted, and - unlike other options here - failure at any point in the CCS chain directly impacts the carbon intensity of power delivered. Gas-fired generation is also reliant on the gas delivery pipeline infrastructure, which may face capacity constraints. Finally, natural gas with CCS is 50% more costly per MWh than unabated firm gas.
- Nuclear: Nuclear is seeing renewed interest from a wide range of corporate buyers and investors. Conventional nuclear and small modular reactors (SMRs) are attracting funding and offtake deals. While nuclear power holds high potential, long development timelines, high capital costs, and technology risk remain barriers to commercializing the next wave of nuclear technologies.
- Geothermal: Geothermal can provide firm, dispatchable, and low-carbon power with capacity factors typically above 90%. Development timelines can be faster than nuclear in regions where resources are already proven, with some projects approaching commercial readiness now. Geothermal technology is still geographically constrained, but enhanced geothermal systems (EGS) are poised to expand their geographical flexibility by reducing the number of siting variables.
How to Evaluate the Right Clean Firm Power Technology for Your Project
How do these various options stack up? We compared them across six dimensions:
- Firmness: how reliably a resource can deliver power on the hour, on demand
- Carbon: the lifecycle emissions intensity when considering the operational emissions of the generating facility and the broader system carbon impacts required to meet any reliability gaps
- Time to power: a measure of how long it takes to get from “we need power” to delivery, including interconnection and schedule risk
- Cost (current): the likely cost of a PPA if signed today
- Execution risk: a measure of how likely a project’s claims regarding price, timing, and performance will hold
- Siting flexibility: a measure of how constrained a resource is to a specific geography
This frame is ultimately something the buyer should score themselves; below you will find our current read. Red (unfavorable) represents a weakness that can end an evaluation on its own, green (favorable) means the dimension won’t constrain the decision, and yellow (moderate) sits somewhere in between.
Comparing the clean firm power options is, perhaps ironically, challenging along the “clean” and “firm” lines. Every serious contender delivers low-carbon power around the clock, because that is the price of admission. Not one technology earns an unfavorable rating in those categories. And that is the catch: every weakness in the comparison table sits somewhere else. The dimensions that ultimately win (or end) these contracts may be the ones that the “clean firm” label can obscure or oversimplify.
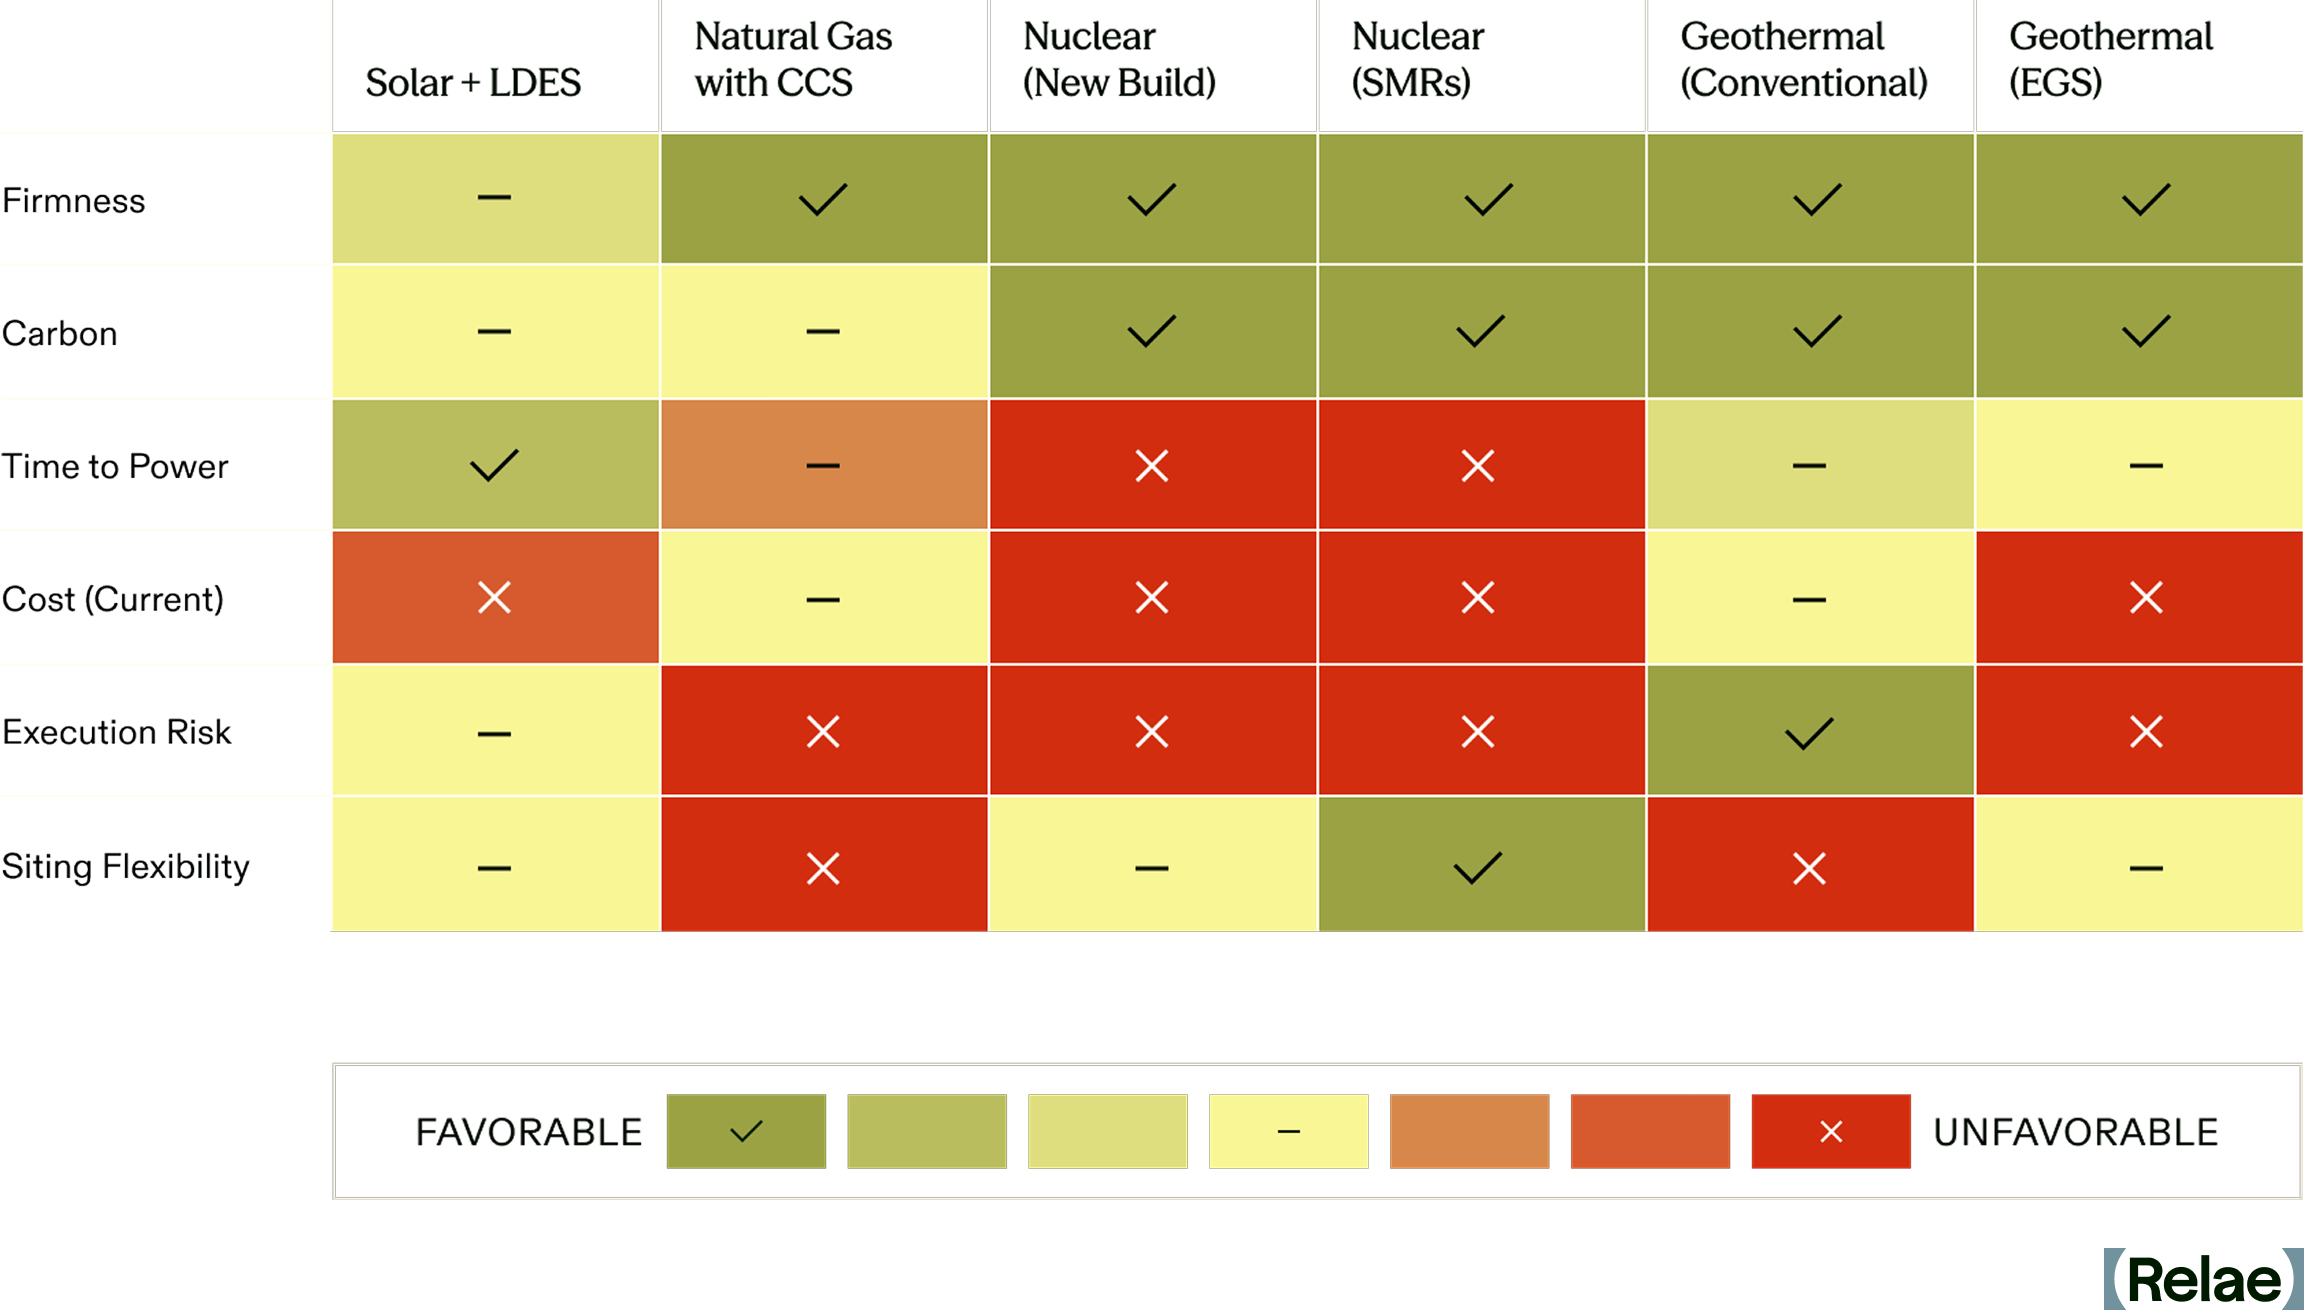
A resource that cannot be energized for a decade, or sited near load, or delivered at a price a buyer cannot defend internally, may be infeasible regardless of what else it offers. None of the four clean firm generation technology groupings clear every hurdle today, but they can satisfy different buyer priorities.
Solar or wind with LDES offers more buyer flexibility, at a price. Enough generation, storage, and other firming can deliver the reliability required, and the buyer sets that target. But the increments get expensive quickly, especially when reliability gaps remain long or unpredictable. Covering more hours means more storage and more generation to fill it, so each step toward firmness parity costs more than the one before it. Firming shortfalls also carry carbon consequences, depending on what gets called to compensate. Those emissions may be absent from GHG accounting ledgers, but that doesn’t stop them from hitting the atmosphere.
Gas with CCS is challenged by execution and siting because the product depends on a chain: gas generation, capture, transport, and a permitted storage site capable of permanent CO2 disposal at scale. Each piece can be developed and tested, but low-carbon electricity requires all of them to work together, which can only be demonstrated once all are built. A buyer cannot substitute a link, and cannot observe the whole chain before committing. Clean, in this sense, is conditional, and the delivered power could end up being far more carbon-intensive than advertised.
Nuclear ranks poorly on time, cost, and execution, but full-scale reactors and small modular reactors carry those weaknesses differently. A large reactor arrives in one piece, and its schedule and final cost come into focus as construction advances. By then, years and billions are committed; a buyer cannot learn from a fraction of a reactor before deciding whether to finish it. Small modular reactors are designed to break that capacity into increments a buyer could add as demand grows, which would ease the one-piece problem. But none are operating commercially in the US yet, and the signed deals target first power in the 2030s, so the modular promise is still years out.
Geothermal’s weaknesses work somewhat differently. Conventional hydrothermal is tightly constrained by location, which buyers can screen before choosing where to procure, or co-locate where possible. Next-generation geothermal, including EGS, could widen that geography considerably.
For EGS, the largest remaining uncertainty is execution: whether the developers can replicate successful drilling and reservoir performance at commercial scale. Part of that risk belongs to the rock, and no contract can make a reservoir perform. But drilling also produces information before the entire project has been built, and geothermal capacity can often be developed incrementally as needed. A buyer can require resource evidence before committing, tie later commitments to demonstrated performance, or spread procurement across projects rather than depend on a single field.
Geothermal’s flexibility has limits. A buyer who needs full capacity by a fixed date may have little room to wait for wells to perform before committing to the next phase. And successful wells do not eliminate risk in project expansion or guarantee performance in other locations. Execution risk stays with the resource. What geothermal offers is more opportunity to learn about that risk while a buyer can still do something about it.
Revisiting the Geothermal Premium
Geothermal contracts, especially EGS, remain expensive. But that premium looks different on this side of the comparison. Clean has a cost, but so does firmness, speed, reach, and execution. Every clean firm option pays for those attributes somewhere. Solar and wind contracts will remain cheap by comparison, but it’s the wrong comparison: the market signing geothermal contracts is pricing a much larger product.
That still leaves a hard decision. Geothermal and gas with CCS carry execution risk and siting constraints. Nuclear asks more of the buyer on cost and time. Firmed solar asks more as reliability requirements rise. The best option will change with each buyer, location, and project. Geothermal’s place in that choice is changing quickly. EGS is expanding where projects can be developed, drilling costs are falling, and commercial experience is growing. Those advances are bringing geothermal into consideration for buyers who previously had little reason to look its way.
And that may be the more revealing aspect of the geothermal market today: buyers are signing those contracts with the alternatives in full view. Their decisions offer an early indication of what clean firm power delivered in the right place and at the right time is worth, and which risks buyers are willing to carry to get it.
Frequently Asked Questions
Is Geothermal Cheaper Than a Solar PPA?
No, a geothermal power contract can be significantly more expensive than a solar PPA. But they're not the same product: solar meets annual clean-energy targets, while geothermal delivers firm, dispatchable power around the clock, which is why buyers are increasingly comparing it to nuclear and gas with CCS instead.
Is Geothermal Cheaper Than Solar with LDES?
Not necessarily on a per-contract basis, but the cost structures behave differently. Solar with LDES gets more expensive with every additional hour of reliability a buyer needs, since covering more hours means adding both more storage and more generation to fill it. Geothermal's premium, by contrast, is priced into the contract upfront as a firm, dispatchable product from day one.
How Does Geothermal's Risk Compare to Gas with CCS?
Differently, in a way that matters to buyers. Gas with CCS depends on a chain (generation, capture, transport, and storage) that can only be verified once the whole system is built, so a buyer can't test it piece by piece. Geothermal generates performance data incrementally through drilling, letting buyers require resource evidence or tie commitments to demonstrated results before committing further, though this data does not come free.
Which Deploys Faster, Geothermal or Nuclear?
Geothermal, in regions with already-proven resources. Fervo's Cape Station, for example, broke ground in 2023 and is on track for first power in late 2026 and 500 MW by 2028: a fraction of a typical new-nuclear large reactor timeline.
Carbon Capture for Natural Gas-Fired Power Generation: An Opportunity for Hyperscalers
Key Takeaways
- AI-driven data center demand is outpacing grid capacity, and hyperscalers are bringing more natural gas, which already supplies about 40% of US electricity, online to meet their needs.
- Pairing carbon capture and sequestration (CCS) with natural gas lets data centers source firm power today while cutting plant-level emissions up to 95%—without waiting on multi-year renewable interconnection queues.
- The Google-Broadwing deal demonstrates real progress and commitment toward natural gas with CCS as the first major commercial deployment of this exact pathway
Meeting Electricity Demand and GHG Emission Reduction Targets
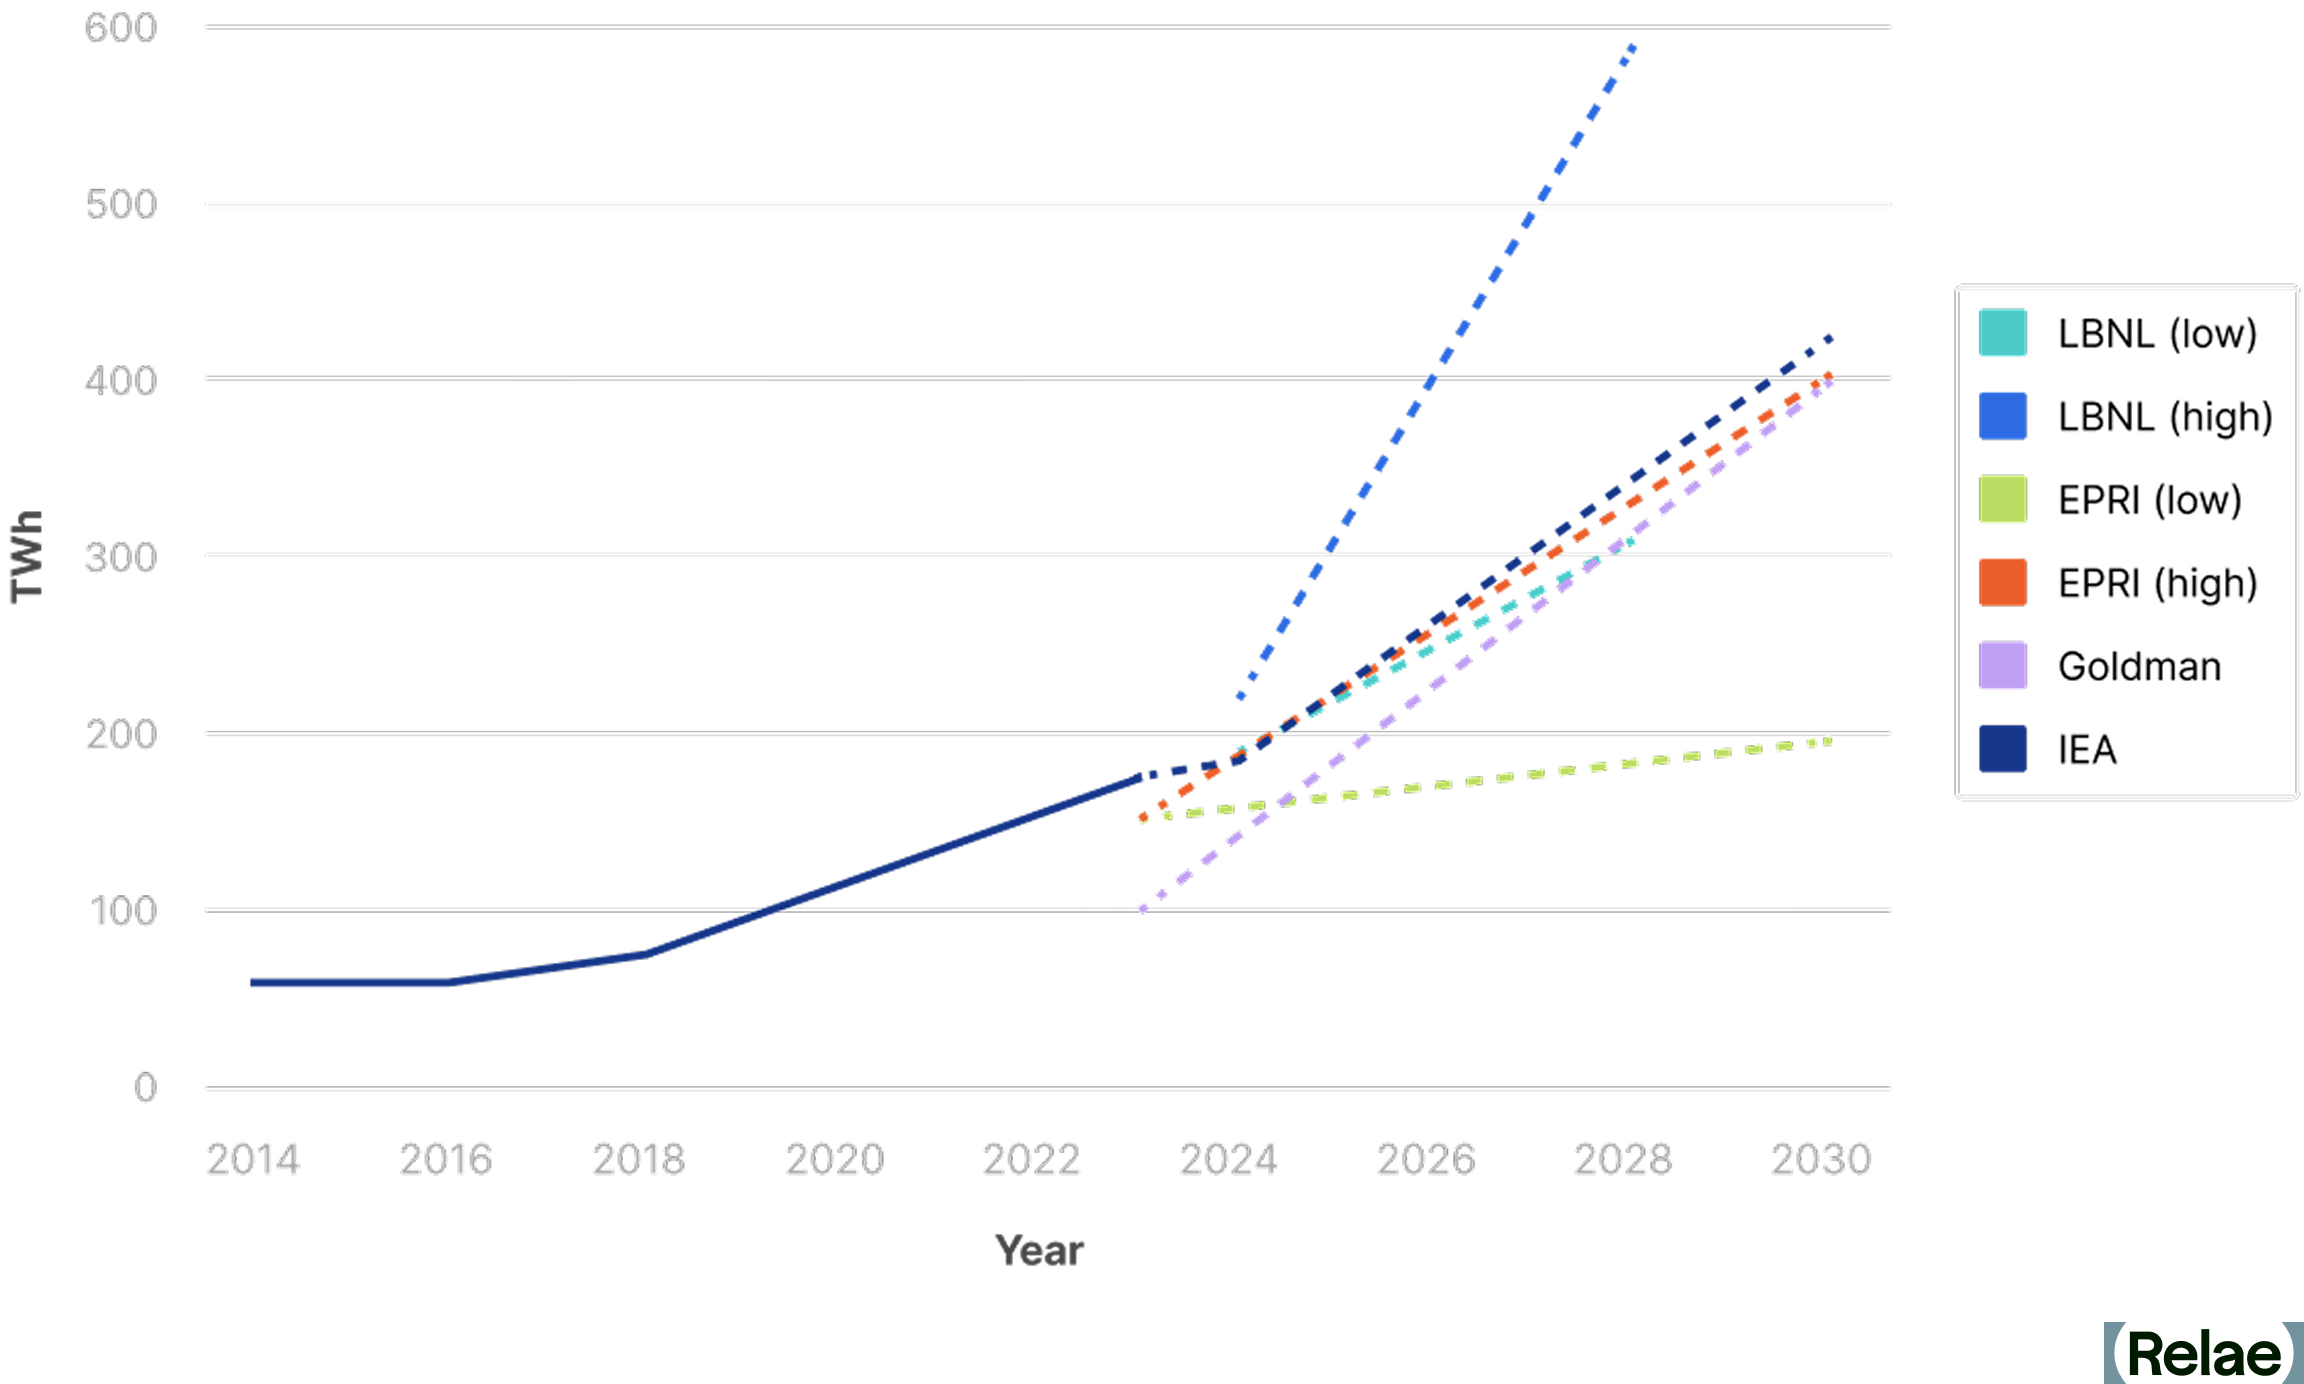
Rapid growth in electricity demand across the US, driven by AI data center expansion and increased industrial electrification, is placing significant pressure on power grids. After decades of stable electricity load, demand has increased significantly since 2022 and is expected to rapidly grow for the foreseeable future. Natural gas currently fuels around 40% of US electricity generation. Its share is expected to grow in the coming years. However, unabated natural gas generation is not compatible with stakeholder targets to reduce greenhouse gas (GHG) emissions. Combining CCS with natural gas-fired generation is one pathway to meet growing electricity demand and achieve GHG emission reduction targets.
[cta]
The Role of Natural Gas in Electricity Supply
Natural Gas Generation Versus Renewable Generation Deployment
Electricity generators can provide multiple products to regional grids, generally providing two services: energy (power production) and reliability (consistent availability). Natural gas-fired plants can provide both, whereas renewable energy sources like wind and solar generate energy but offer less reliability.
As electricity demand rapidly grows, grids will need both energy and reliability to function effectively. However, the interconnection queue for renewable energy assets has a years-long backlog which is delaying their deployment. Grids will need additional reliability assets to support the large amounts of renewables (usually in the form of storage). Some jurisdictions are creating an alternate pathway for natural gas plants to bypass the lengthy interconnection queue which may allow for the rapid development of natural gas generators. Hyperscalers are also pursuing development of large behind-the-meter (BTM) generation of electricity from renewable and fossil sources, but these must also meet high standards for reliability.
The Case for Carbon Capture Deployment
Electric utilities and developers of data center infrastructure are planning to build substantial new natural gas generation assets in addition to maximal deployment of renewable electricity. CCS technology enables natural gas plants to deliver stable, continuous power while significantly reducing emissions by capturing up to 95% of emitted CO₂. Natural gas plants with CCS are viable options to deliver the lower-emission, reliable power needed to respond to rapidly emerging AI data center power demand growth. The 45Q tax credit, a key government incentive for CCS, was preserved and effectively strengthened under 2025's One Big Beautiful Bill Act. The Google-Broadwing deal, the first major commercial deployment of this exact pathway, was signed in October 2025 and serves as a useful proof point.
Benefits of Integrating CCS into Natural Gas Power Generation
Integrating CCS into natural gas-fired power plants provides several advantages for data center stakeholders:
- Reduced carbon emissions: Achieve emission intensities of approximately 80–120 kg of CO₂ equivalent per megawatt-hour (CO₂e/MWh), significantly below the current US grid average of approximately 340–420 kg CO2e/MWh.
- Reliable baseload power: Continuous, predictable electricity delivery.
- Compact infrastructure: Requires less land compared to renewable energy projects, simplifying data center siting near existing infrastructure.
- Cost: CCS integrated with new natural gas-fired generation can deliver low-cost decarbonization. Relae estimates $75-150/MWh, which is competitive in many markets with other firm baseload options such as new nuclear power or wind and solar with battery backup.
Seven Key Considerations for Implementing CCS
Stakeholders considering CCS technology must carefully evaluate seven critical factors:
1. Meeting Rapid Deployment Timelines
Traditional natural gas plants can be operational within roughly 18 months, provided they bypass interconnection queues for reliability purposes and have access to key equipment. Integrating CCS technology extends this by an additional 18–36 months. Designing plants to be "capture-ready" allows for quicker initial deployment and smoother CCS integration in the future. However, deploying a capture-ready plant without a commitment to build the carbon capture portion is inconsistent with serious climate action.
2. Sizing Plants Optimally
CCS is most economically and environmentally optimal at natural gas plants with capacities of 100 MW or greater. It offers significant opportunities for emissions reductions for the forecasted new data center load. CCS is not suitable for smaller or highly variable natural gas plants.
3. Selecting Effective Carbon Capture Technology
CCS technologies such as solvents, sorbents, membranes, and oxyfiring vary significantly in maturity, efficiency, and cost. Choosing the right approach requires thorough evaluations aligned with specific project requirements. These will vary by setting and configuration (e.g., turbine class, reciprocating engines, number of units, water availability, etc.).
4. Navigating CO₂ Transportation Logistics
The safe and efficient transport of captured CO₂ via pipelines, rail, or barges is critical. Aligning infrastructure planning with overall project timelines prevents delays.
5. Ensuring Safe and Effective Sequestration
If there is no CO₂ storage, there is no project. Permanent CO₂ storage in Class VI injection wells requires detailed geological studies and regulatory permitting. Early collaboration with experienced sequestration operators is essential to success.
6. Conducting a Comprehensive Life Cycle Analysis
Full life cycle emissions analyses, including upstream methane leakage, construction impacts, and CO₂ transportation, are critical for accurate environmental assessments and ensuring low-carbon electricity supply. Prioritizing low-leakage, third-party verified natural gas supply enhances positive climate impacts.
7. Performing Siting Feasibility Early
An early and quick feasibility assessment is critical to identifying promising opportunities and key barriers at candidate CCS sites. Important factors include available transmission capacity, the potential to expedite approval of interconnection for thermal resources, regulatory barriers, state and local incentives, the sufficiency of natural gas infrastructure, and water supply.
Frequently Asked Questions
How much longer does adding carbon capture take compared to building a natural gas plant alone? Traditional natural gas plants can be operational within roughly 18 months, provided they bypass interconnection queues for reliability purposes and have access to key equipment. Integrating CCS technology extends this by an additional 18–36 months.
Is a "capture-ready" natural gas plant a legitimate climate strategy if the capture portion isn't committed yet? Designing plants to be "capture-ready" allows for quicker initial deployment and smoother CCS integration in the future. However, deploying a capture-ready plant without a commitment to build the carbon capture portion is inconsistent with serious climate action. “Capture committed” is a better stance than “capture ready”.
How does the cost of natural gas-fired power with CCS compare to nuclear or renewables with battery storage? CCS integrated with new natural gas-fired generation can deliver low-cost decarbonization. Relae estimates $75-150/MWh, which is competitive in many markets with other firm baseload options such as new nuclear power or wind and solar with battery backup.
Has any hyperscaler actually deployed natural gas-fired power with CCS at scale yet? The Google-Broadwing deal, the first major commercial commitment of this exact pathway, was signed in October 2025 and serves as a useful proof point. Others are in development.
[cta]
How Relae Supports Data Center Decarbonization
Natural gas-fired generation combined with CCS is a proven solution for meeting the urgent electricity demands of data centers while significantly reducing emissions. Relae helps stakeholders navigate the complexities of CCS deployment through deep, science-backed expertise and strategic advisory services. Our experienced team provides comprehensive support throughout CCS project planning and execution, including technology selection, life cycle emissions analysis, infrastructure assessment, project viability, regulatory compliance, and risk management.
Navigating Scope 2 Accounting Changes
Key Takeaways
- Voice your opinion: The Greenhouse Gas (GHG) Protocol is updating its scope 2 guidance with final standards expected in 2027, which may require hourly and regional matching of renewable energy certificates (RECs), potentially changing how companies claim their electricity-related emission reductions.
- Act now to secure renewable energy contracts: Companies should move forward with their scope 2 climate commitments today. The GHG Protocol is expected to grandfather in contracts entered into under existing rules.
- Beyond the megawatt hour (MWh): High-impact forward REC contracts measure impact beyond the current annual MWh match requirement, maximizing near-term carbon abatement and social impact for every dollar invested.
Why 2027 Rule Changes Matter for 2030 Targets
Companies racing to meet 2030 climate targets face converging pressures: surging electricity demand, constrained renewable energy supply, and scope 2 accounting rules that could undergo significant changes by 2027.
In a recent webinar, power market experts from Relae (formerly Carbon Direct) and Ever.green explored these changes. Patti Smith, former Electricity Decarbonization Lead at Relae; Julia Millot, Senior Power Decarbonization Manager at Relae; and Liz Pearce, Chief Revenue Officer at Ever.green, unpacked what's changing and how companies can respond.
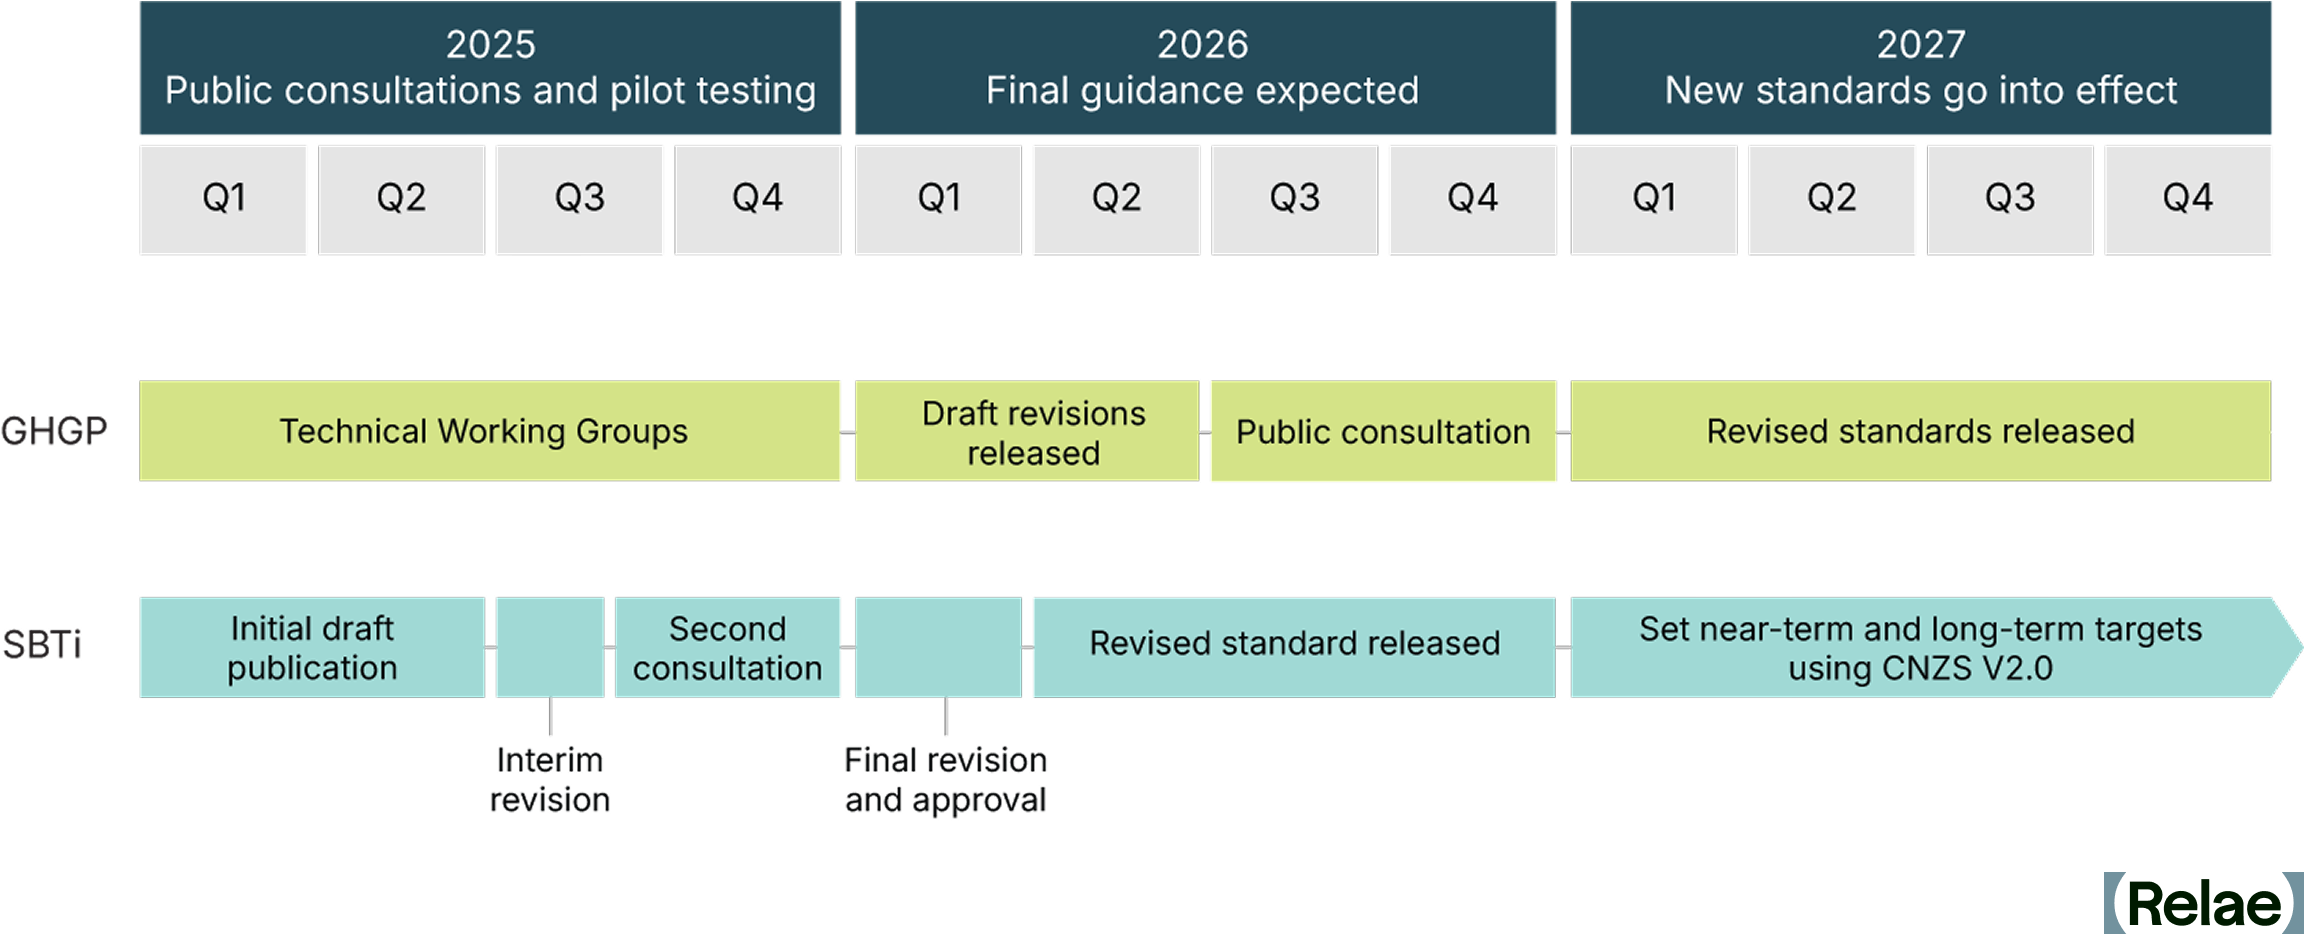
The stakes are high. Based on GHG Protocol Scope 2 Public Consultation materials, companies may need to match RECs to electricity consumption on an hourly and locational basis as early as 2028. However, we expect the GHG Protocol to grandfather forward REC contracts signed before new rules take effect, enabling companies to continue advancing toward 2030 targets amid rule uncertainty.
Big Changes to the Power Grid
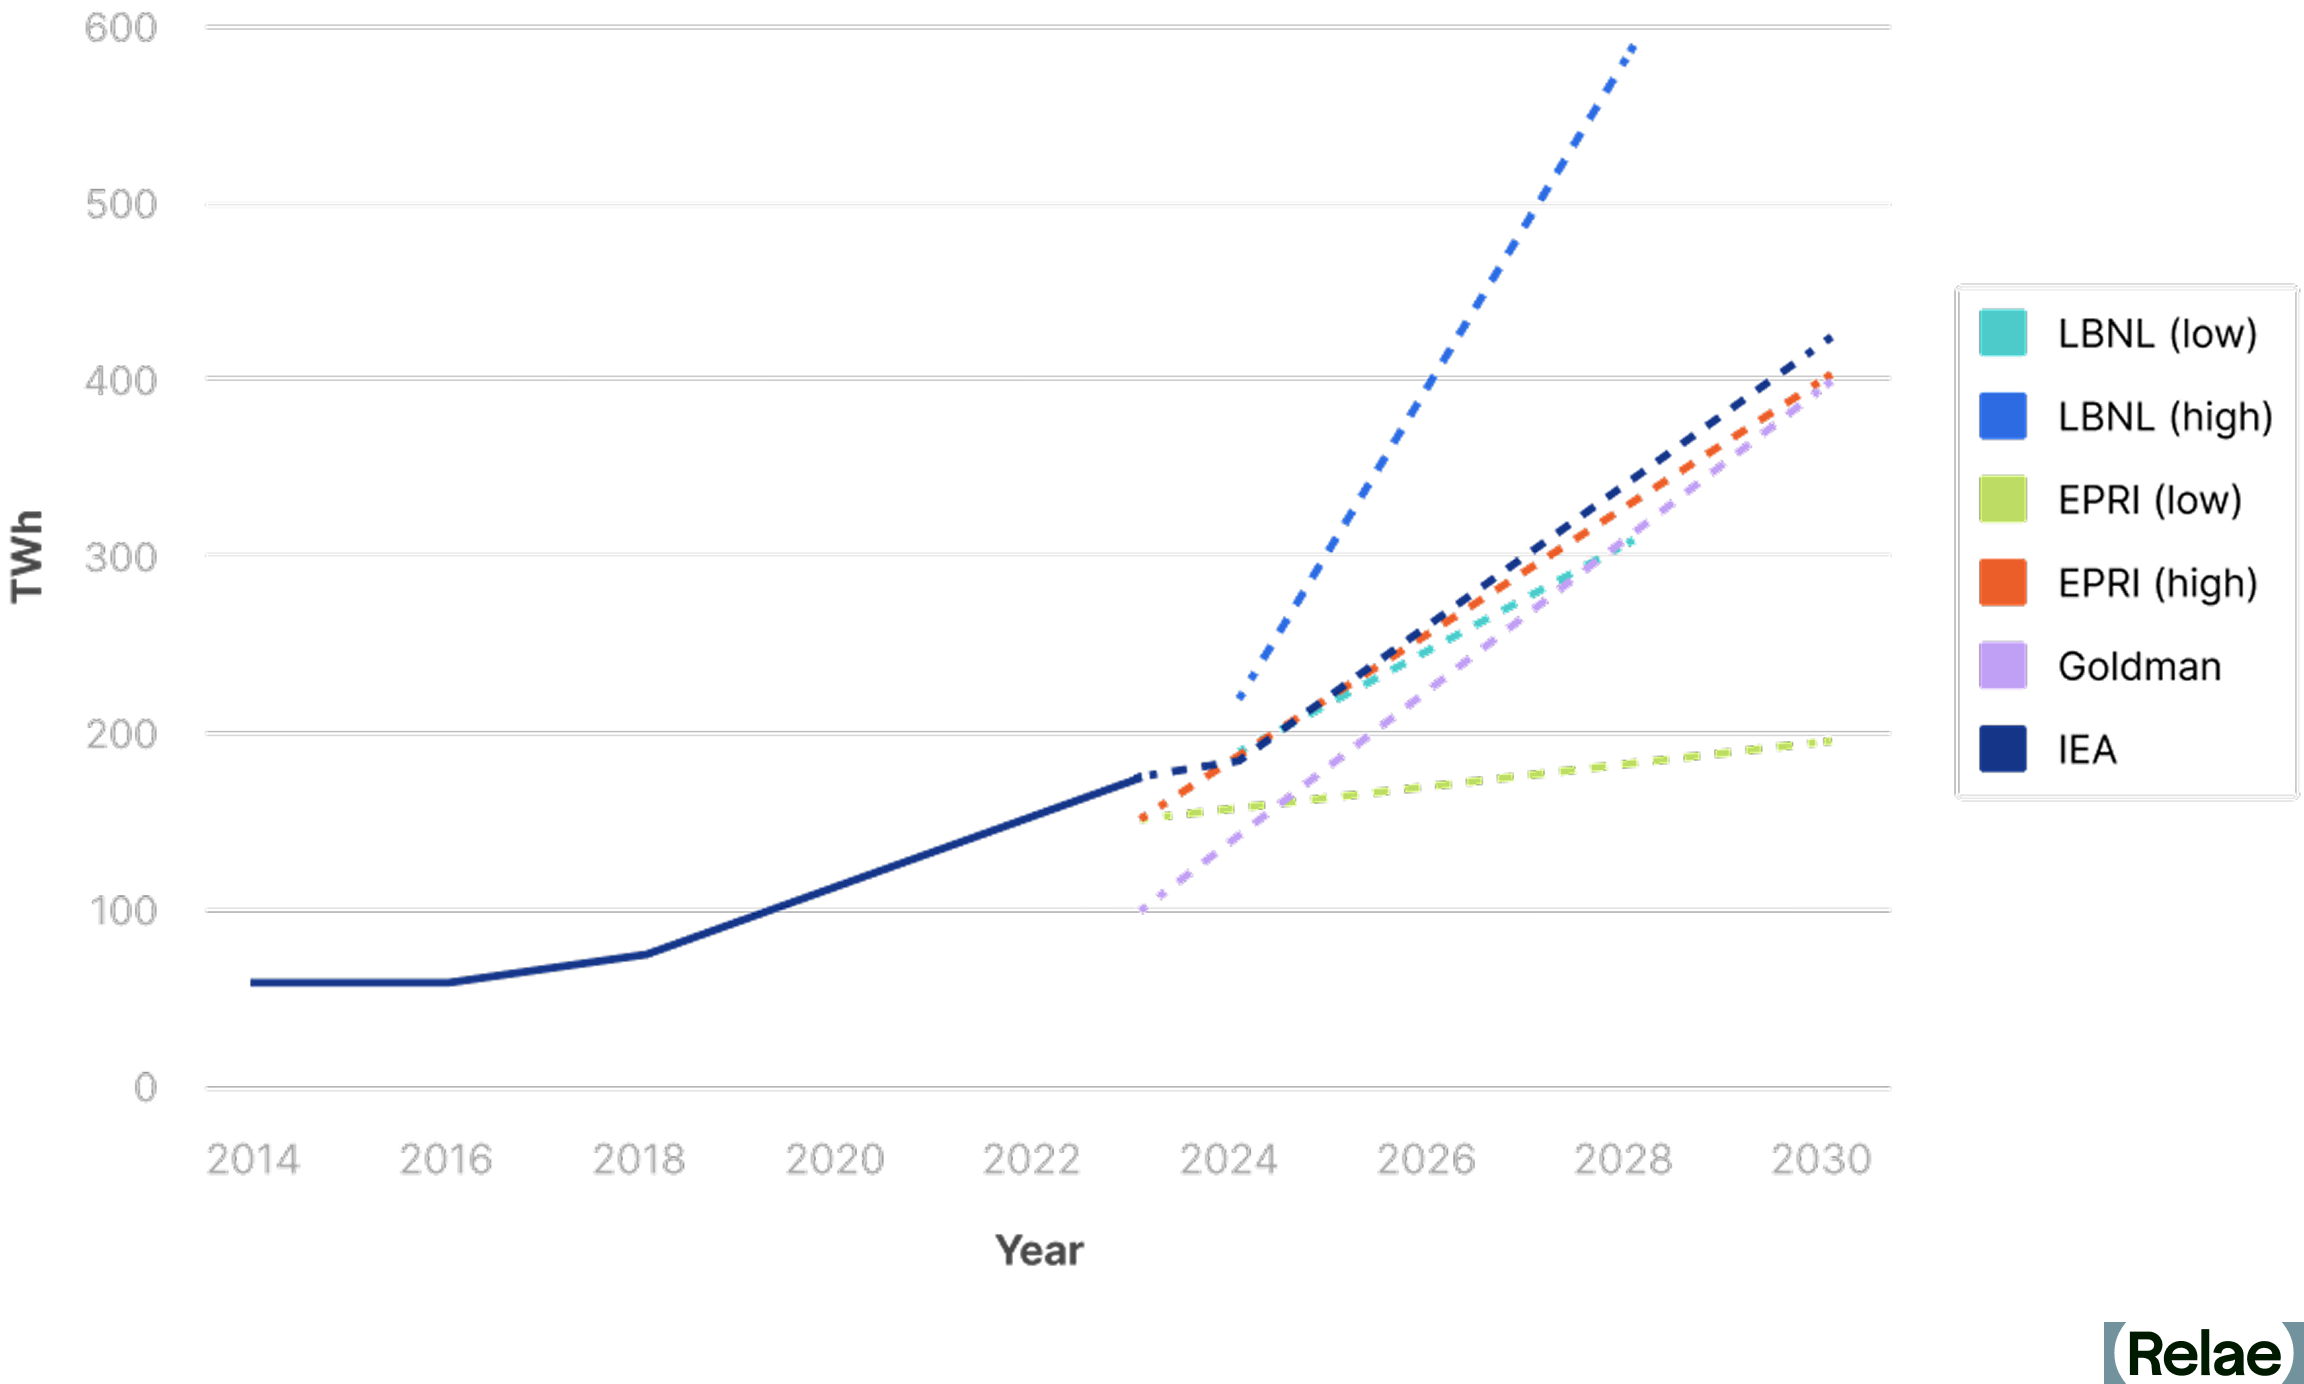
The US power grid is entering sustained demand growth for the first time in decades. "Over the next five years, data centers alone are going to put [the equivalent] of four New York Cities onto the grid," Smith explains, citing forecasts that project around 200 terawatt hours of new data center load through 2030 (i.e. cumulative energy consumption). That demand growth also shows up in near-term grid planning. NERC's January 2026 Long-Term Reliability Assessment forecasts North American summer peak demand rising by 224 gigawatts—a 24% increase—over the next decade, with new data centers cited as the primary driver. These figures highlight that peak capacity and total energy consumption are directly impacted by the data center boom.
Meanwhile, new renewable projects face headwinds. Smith points to interconnection queue delays: "Solar and battery projects are taking three to five years from initial request to operation." At the same time, clean energy tax credits, which were driving wind and solar expansion, have been curtailed. New restrictions on foreign supply chain materials, which are critical to renewable project development, are further hampering the development of new clean electricity projects.
The result: Power demand is rising while new renewable electricity supply is getting throttled.
The Messy Reality of Electricity Emissions Accounting
Quantifying the emissions from an individual power plant is straightforward. Allocating those emissions to the companies that consume power is far more complicated.
Grid-supplied electricity comes from many generators that shift constantly, sometimes even second to second. Companies can’t directly measure emissions from a grid-connected load because the generators serving it continuously change.
Without direct measurement, companies need rules to estimate the emissions they are responsible for. The GHG Protocol’s Scope 2 Guidance provides that framework, establishing how companies estimate electricity-related emissions and how to reduce them through renewable energy purchases.
How Companies Currently Claim Renewable Energy
For the past decade, companies have used renewable energy purchases to achieve their scope 2 emission reduction goals. The most widely used mechanism is the REC, each representing clean energy attributes for one MWh of renewable electricity generated and added to the grid. Currently, when a company buys RECs equal to its annual electricity consumption, it can claim 100% renewable electricity. Under current rules, companies can use purchased renewable energy from anywhere in North America and apply it to any load in North America at any time during the year.
Importantly, emissions from different power grids vary widely across North America depending on time of day, time of year, and the power grid makeup.
This flexibility allows companies to match a REC from a clean grid against electricity consumption from a dirtier one, creating a potential mismatch between emissions claimed and actual emissions avoided. This gap has drawn scrutiny, contributing to the motivations for the scope 2 rules rewrite.
What's Changing in GHG Protocol Scope 2 Accounting?
On October 19, 2025, after years of consultation, the GHG Protocol released two separate proposals for public consultation:
1. Scope 2 changes: Moving away from annual REC matching to an ‘hourly and regional’ REC matching requirement.
2. New consequential methodology: A new approach to estimating emissions caused by a company’s consumption and avoided by its renewable energy contracts.
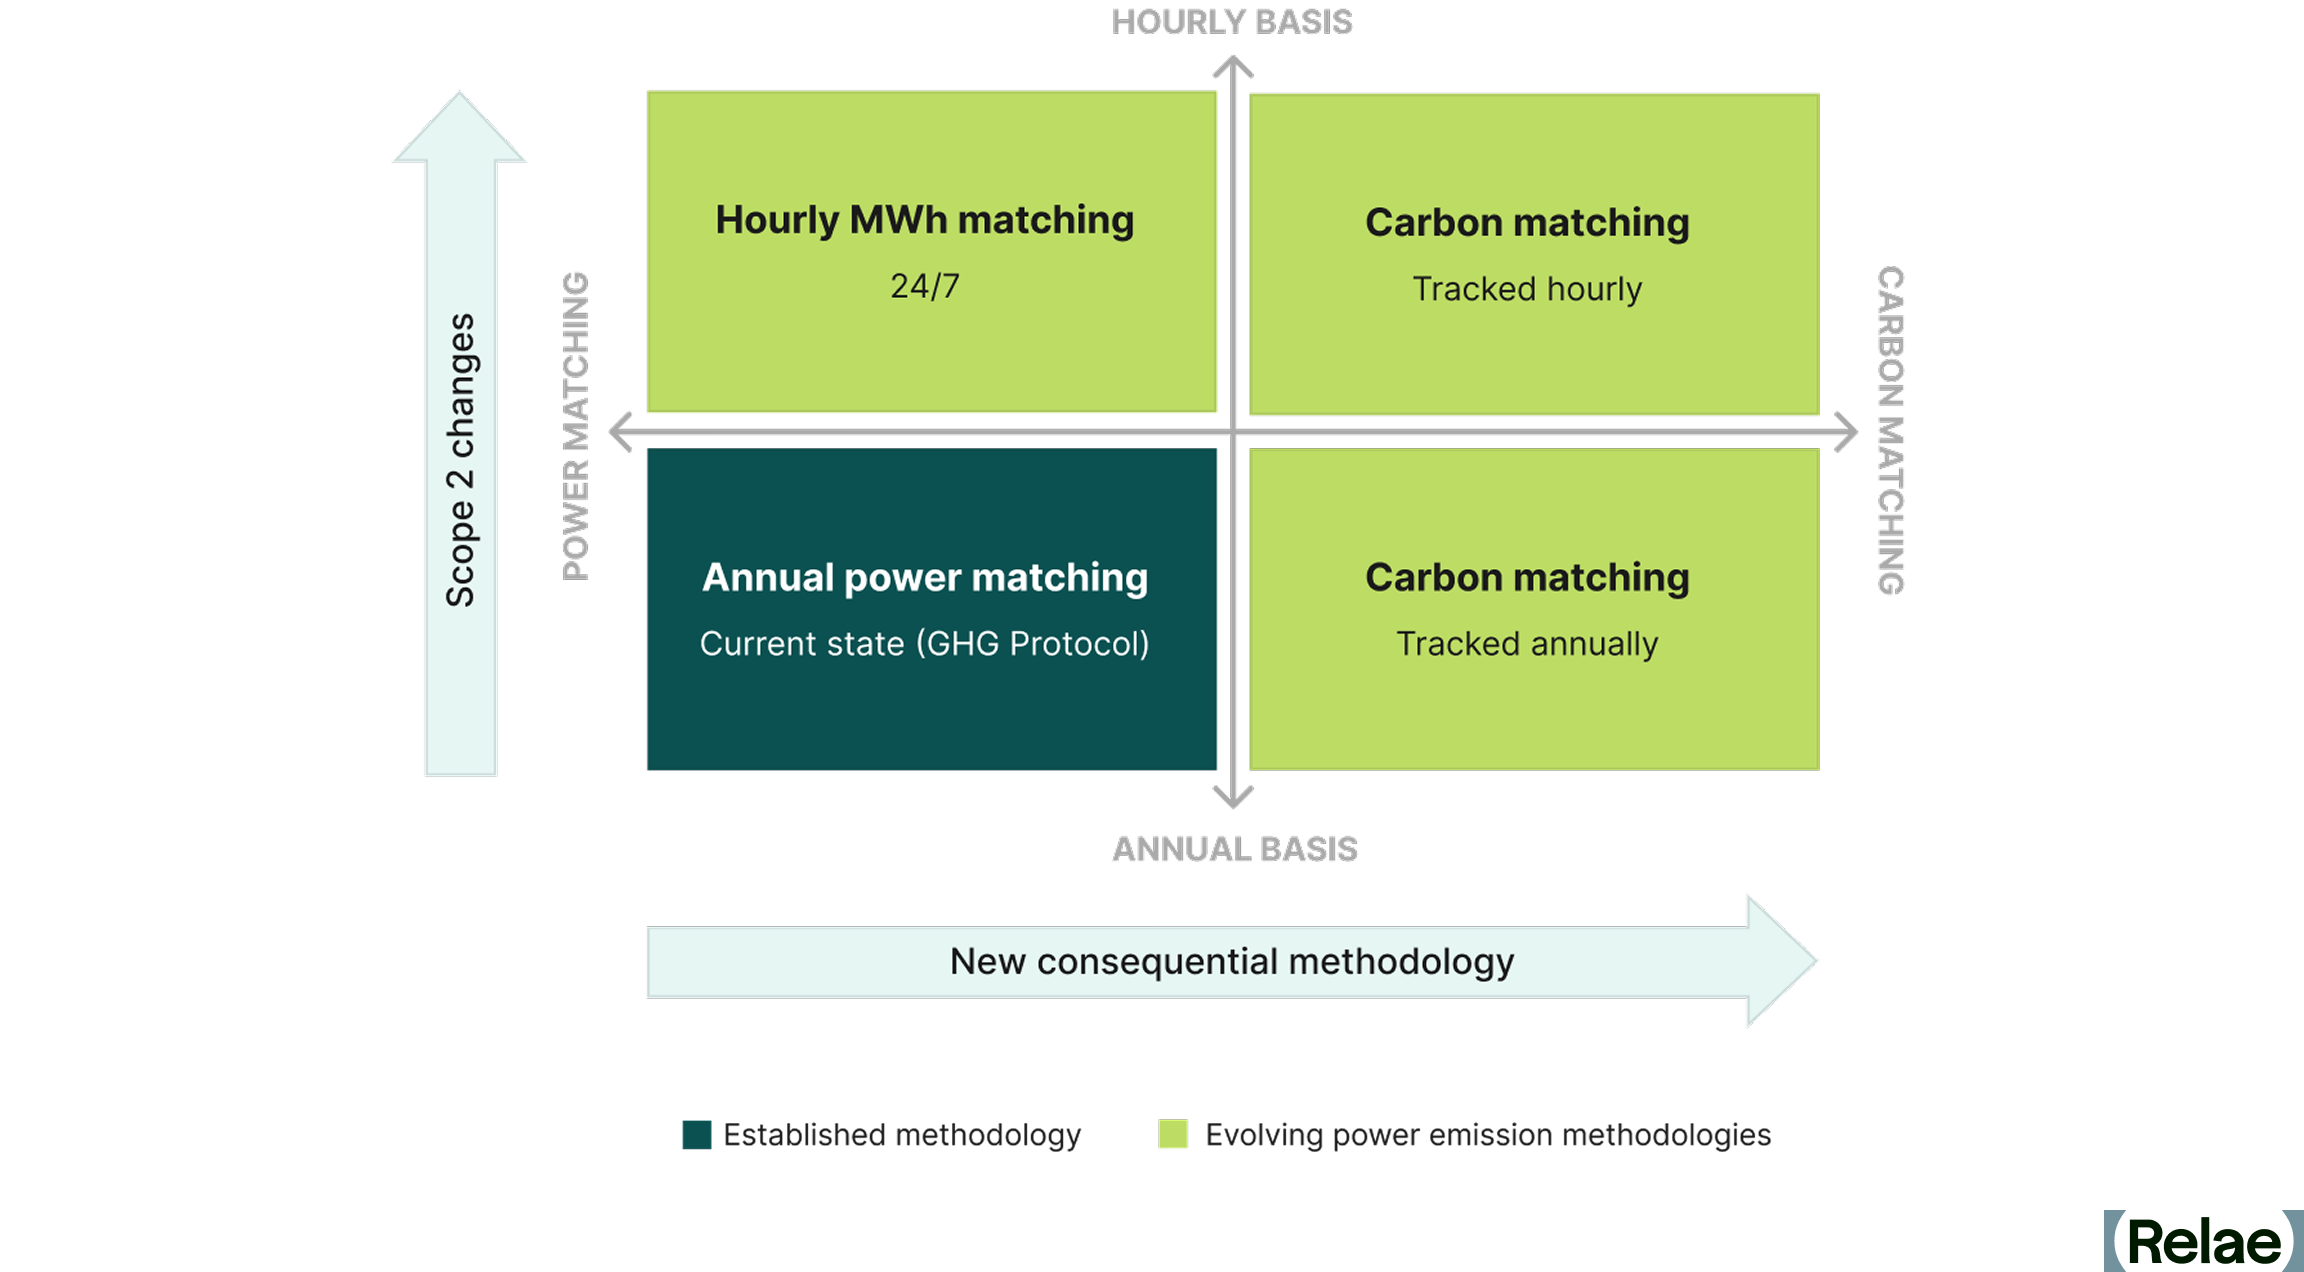
The hourly matching proposal (24/7): Companies would match RECs to consumption hour by hour within the same grid region, rather than annually across any North American grid.
"A REC generated on a Texas wind farm would not be able to be used for electricity consumed in New York," Millot explains.
The consequential approach: This proposes a carbon matching methodology, which estimates emissions caused by a load and estimates the emissions a renewable project displaces.
"Projects in the Carolinas are avoiding 0.6 or 0.7 tons of CO2 per megawatt hour, whereas a California project is probably closer to 0.2 or 0.3," Smith explains.
Projects in the Carolinas deliver more than double the climate impact per REC under the consequential rules. In this methodology, the load and generator do not need to be located in the same region.
While the proposed rules and new methodologies work through the public consultation process, it will be important for companies to start to anticipate the potential impacts on their climate goals and strategies.
Timeline for Scope 2 Accounting Changes
Both the Scope 2 and Consequential Electricity-Sector Emissions consultations closed January 31, 2026, after GHG Protocol extended the original deadline. The GHG Protocol is analyzing feedback with a second consultation and final standards expected by 2027, though the exact timeline is still being finalized.
Companies are encouraged to participate in the public consultation. The GHG Protocol is asking for comments on critical questions, such as:
- Should proposed rules apply to energy consumers of all sizes?
- Which geographical boundaries should be used for locational matching?
- Should existing contracts be grandfathered in?
The public consultation period is an opportunity to shape the standards that will govern electricity-related emission accounting for years to come.
Why Act Now Instead of Waiting
With final rules still in development, companies with scope 2 emission reduction goals or science-based targets face a decision: Wait for clarity or act now.
Several factors favor early action:
- Inclusion of legacy contracts. "There are a lot of indications from the committees that existing long-term contracts will be grandfathered in," Pearce notes. The draft considers a legacy clause that would allow organizations to apply pre-existing contractual agreements, even if they don’t comply with new rules.
- Throttled renewable project development. Interconnection delays for new renewable energy projects, elimination of clean energy tax credits by 2028, and limitations on foreign materials needed to develop renewable energy project components mean that new REC supply may be harder to access in future years.
- Renewable project development timelines. "There's generally a lag, sometimes six to 18 months" between contract signing and project operation, Pearce explains. That means even if you sign today, the RECs won’t be generated for up to 18 months from the signing date.
- High-impact opportunity. Through careful project selection, renewable energy investment can go beyond the annual energy match requirement and incorporate additional impactful metrics, such as higher avoided emissions and positive social impacts.
Renewable Energy Buying Options for Companies
Previously, companies have been able to buy renewable energy through the following three paths; however, they all come with their own tradeoffs.
Traditional REC Buying Options
- REC spot markets make up most corporate renewable procurement. However, they mainly come from existing projects rather than financing new development, which is critical to expanding renewable energy supply to meet rising decarbonization needs.
- Virtual power purchase agreements (VPPAs) are highly impactful but require large power loads and the ability to manage long-term financial risks. Unavailable to most companies.
- Utility green tariffs have limited availability throughout the US (depending on the utility(s) that serve your load) and vary in quality.
Alternative REC Procurement Approach
For companies that want to go beyond the REC spot market and are not large enough to pursue a VPPA, there’s an alternative procurement option available: a high-impact forward REC contract. These multi-year contracts commit to purchasing RECs from specific new projects before they're built, providing the upfront revenue certainty developers need to secure financing at a fraction of the scale and complexity of a VPPA.
Comparing Renewable Energy Procurement Options
The Path Forward
Despite rapidly increasing grid demand, renewable project headwinds, and changing accounting rules, companies can still meet 2030 scope 2 goals.
What companies should do now:
- Watch for the next round of GHG Protocol consultation on Scope 2 revisions
- Evaluate forward REC contracts to lock in terms before rule changes
- Prioritize high-impact RECs that deliver measurable climate and social benefits
Battery Storage Economics: Do the Numbers Still Pencil in Today’s Market?
Key Takeaways
- Batteries have competed away the revenue that financed their first wave. In Texas, ancillary prices have fallen about 90% since 2023, and price spikes driving arbitrage revenue are becoming ever less frequent.
- The business has moved from trading energy to selling capacity. In Texas, tolls work as private capacity contracts, and resource adequacy payments make up roughly 70% of battery revenue in California. Project economics increasingly pencil on a fixed $/kW-month basis rather than price spikes.
- Long-term contracts help shift the risk, but they don’t fully close the gap. Under a 15-year toll, a new battery needs about 22% less revenue, but that is still nearly three times what Texas batteries earned in the market in 2025.
- Buildout now depends on who will pay for capacity. Merchant revenue alone no longer covers a new battery, so growth hinges on how many buyers will sign capacity contracts worth nearly three times what Texas batteries earn in the market.
Battery Revenues Are Falling While Deployments Keep Rising
US developers are expected to install about 24 GW of utility-scale battery storage energy systems (BESS) in 2026, about 60% more than the record 15 GW added in 2025, according to the EIA. Yet in Texas, where batteries earn most of their money in the market, a typical battery earned roughly 85% less in 2025 than in 2023.
Is this unjustified overbuilding by an industry that has grown too fast? Some battery executives argue this is not overbuilding, because merchant revenue earned in wholesale markets is no longer the business. In their view, falling merchant revenue matters less because longer-term offtake contracts, such as 15-year tolls with utilities and large power buyers, make lower revenue financeable. As a result, today’s installations bank on batteries being paid as capacity assets rather than as pure energy arbitrageurs.
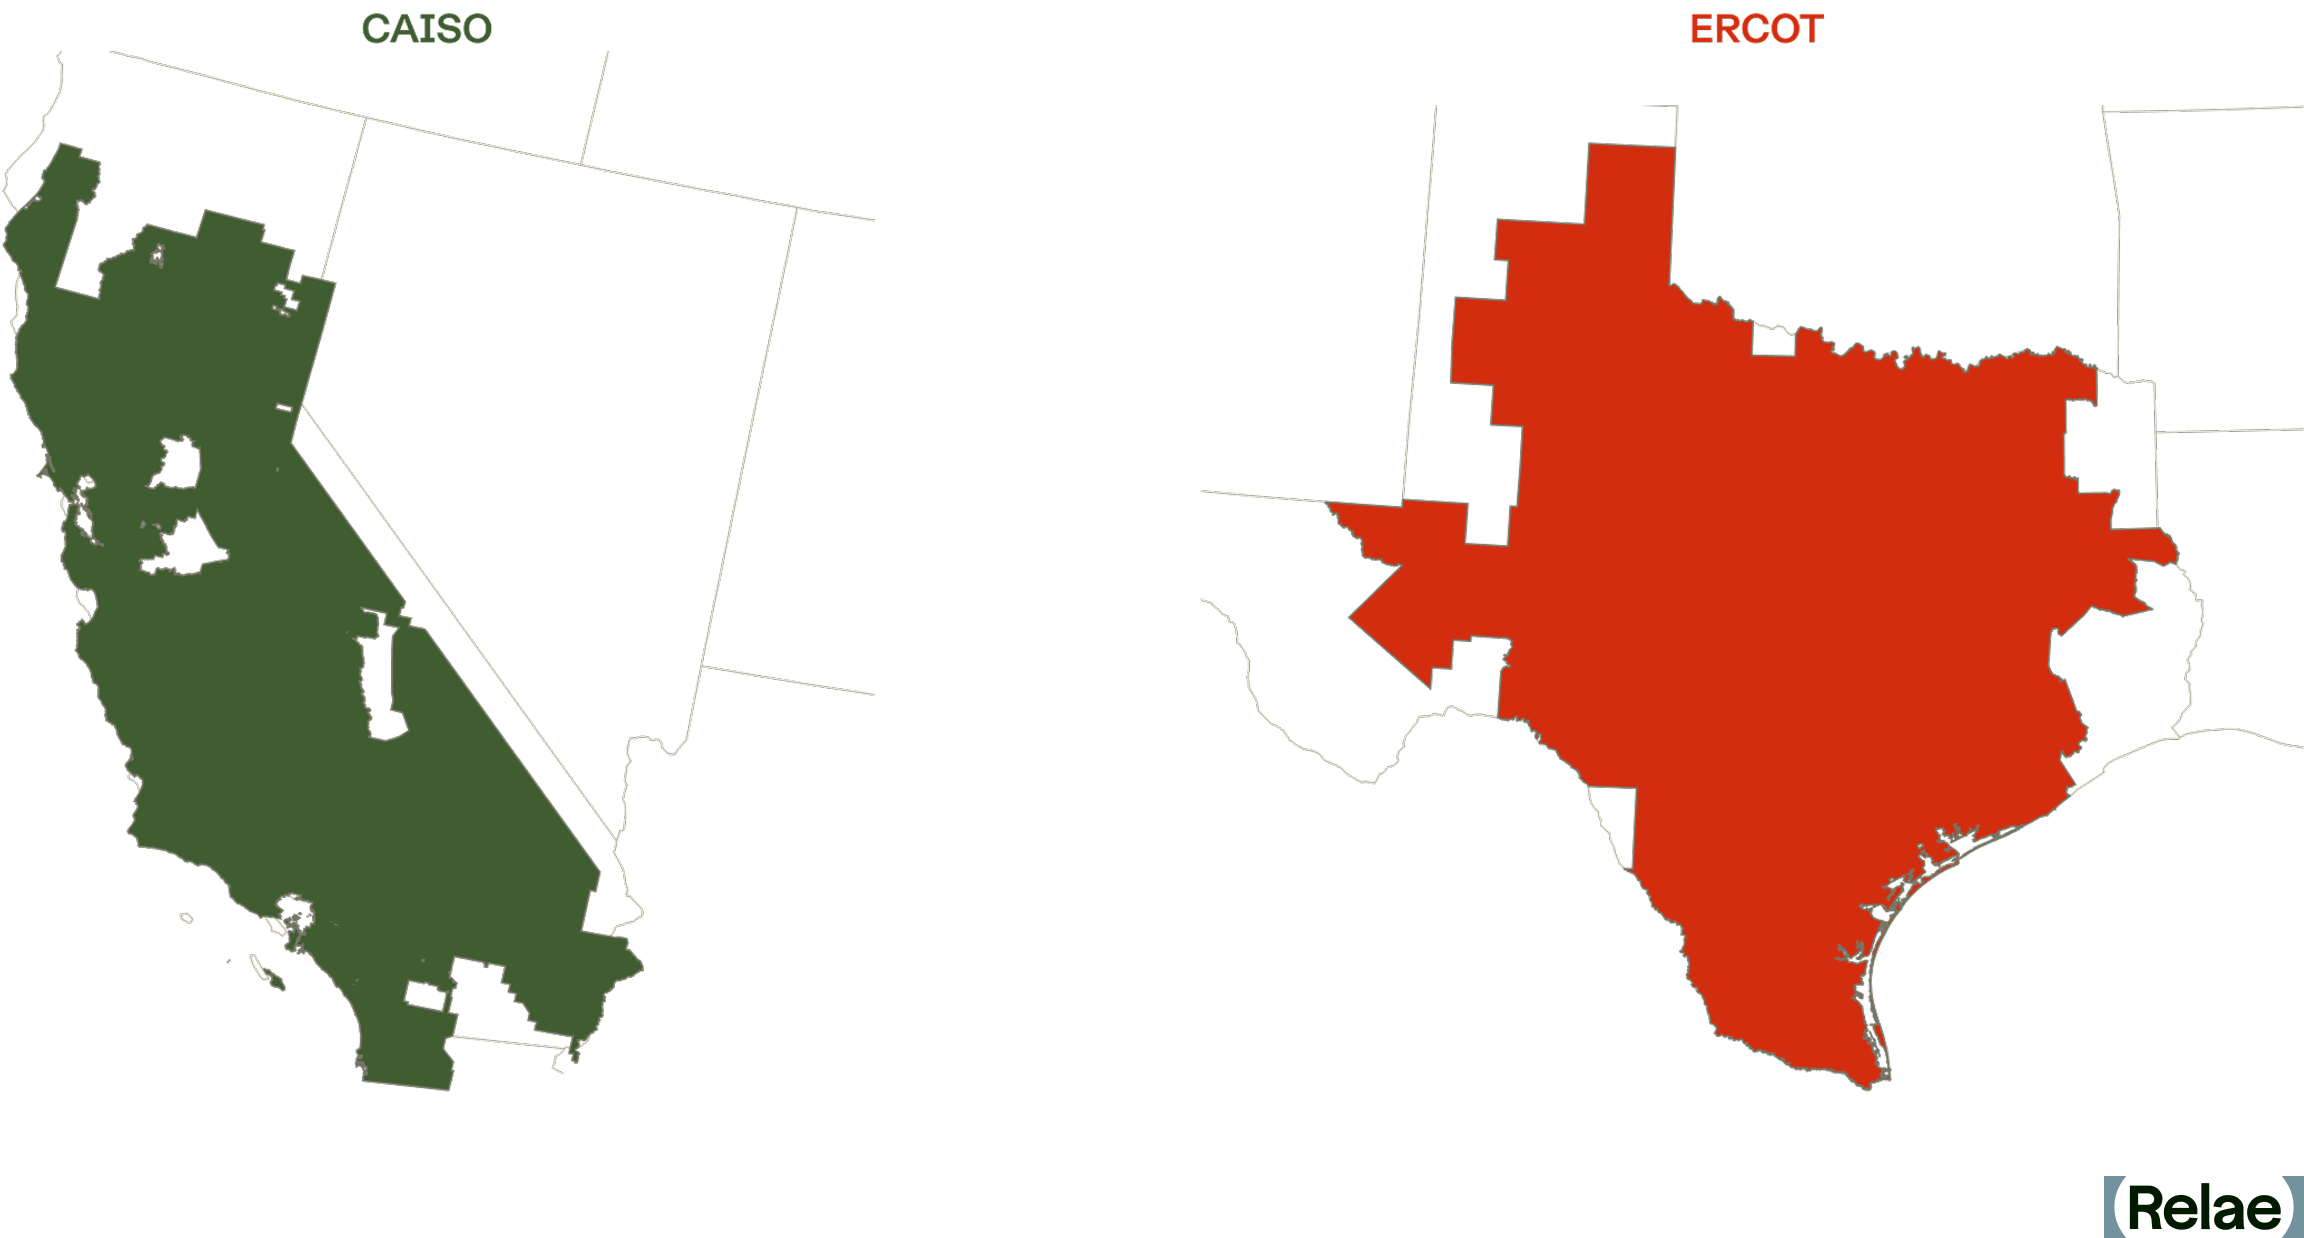
We tested those claims against market data from Texas (ERCOT) and California (CAISO) between 2022 and 2026. Our core finding is that project economics in both markets are increasingly reliant on fixed $/kW-month earnings rather than arbitrage revenue.
How Does a Grid Battery Make Money?
A battery has three ways to earn:
- Energy arbitrage (merchant: paid per MWh traded, hour-by-hour): charging when power is cheap and discharging when it is expensive. Its value depends on the daily spread between the highest- and lowest- priced hours.
- Ancillary services (merchant: paid per MW held in reserve, bought a day ahead): payments for standing ready to keep the grid stable, such as frequency regulation and reserves, whether or not the battery is called on to deliver energy.
- Capacity contracts (contracted: fixed $/kW-month for many years): a utility or large buyer pays a fixed monthly fee, often called a toll, for the right to use the battery, and takes on the market risk itself. It is the most stable of the three.
Texas batteries earned almost entirely from the first two. California batteries have earned from all three, and as market revenue has fallen, resource adequacy (RA) contracts–the mechanism through which load-serving entities meet the state’s capacity requirements–have become their main source of income.
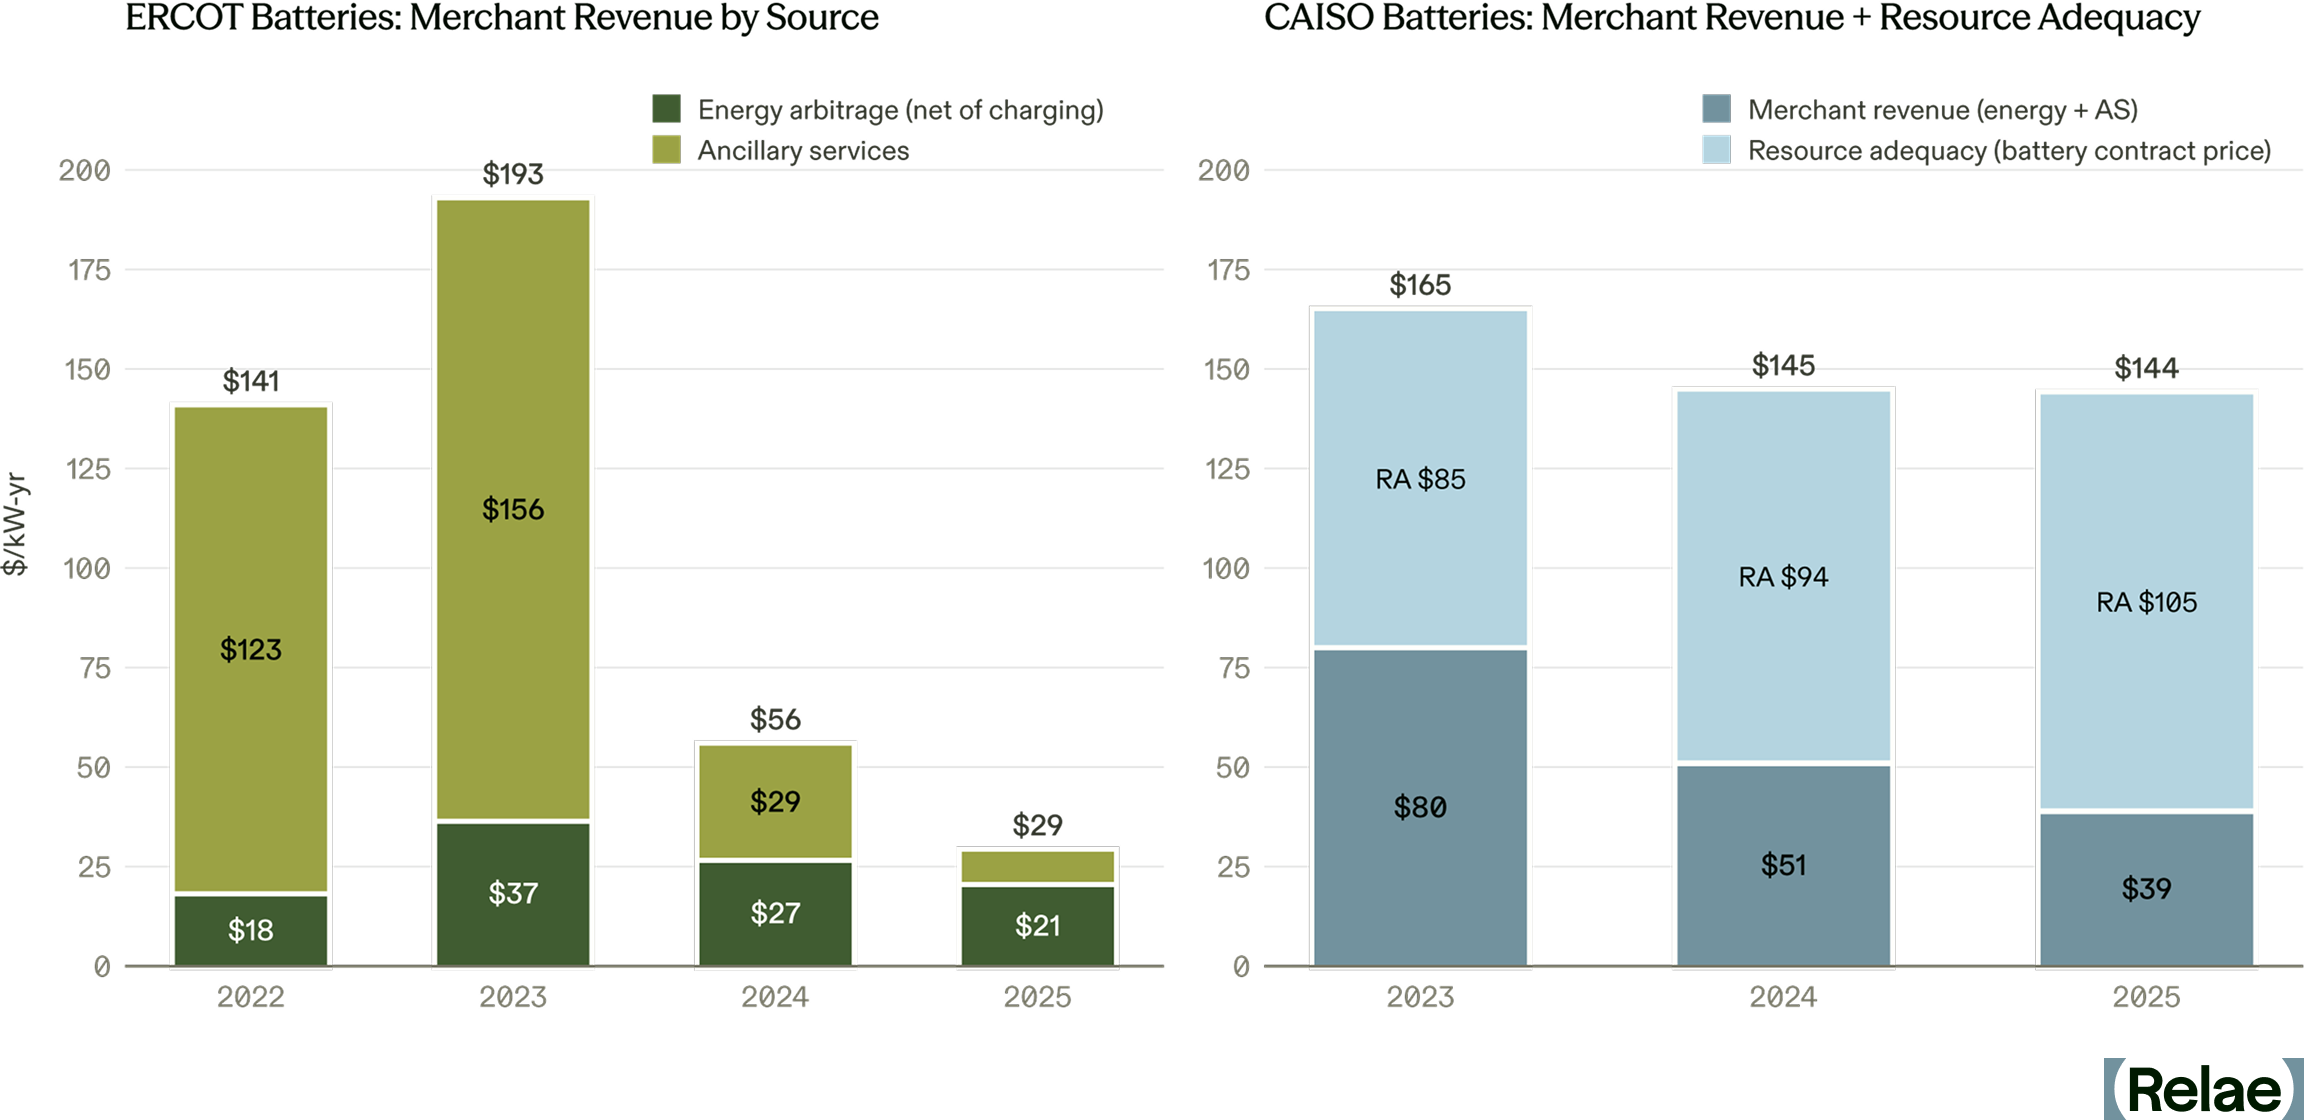
That additional revenue stream is crucial in CAISO, making up roughly 70% of battery revenue by 2025, as net market revenue declined from $103/kW-year in 2022 to under $40/kW-year in 2025. Outcomes differ, too: California still curtails large amounts of midday solar despite its growing battery fleet, while ERCOT’s batteries have flattened price peaks.
How Texas Batteries Lost Their Merchant Revenue
Ancillary services filled up first. In 2022-23, ancillary services supplied more than 80% of Texas batteries’ revenue. But these markets are small and fixed in size. ERCOT buys about 3 GW of the fast reserves batteries excel at, and 6–8 GW of ancillary services in total.
The battery fleet passed the first mark in mid-2023 and the second in spring 2024; it is now about 19 GW of registered capacity. Average ancillary services prices fell 85-95% between 2023 and 2025, and ERCOT's day-ahead ancillary services spending fell from about $1.5 billion to $174 million. California’s ancillary markets saturated even earlier: batteries already won about 70% of its regulation-up procurement in 2022, and about 90% since 2024. Its ancillary services spending, much smaller than ERCOT’s to begin with, fell by about 60%, from $237 million in 2022 to $95 million in 2025.
Price spikes disappeared, too. ERCOT's average daily spread between its four highest- and four lowest-priced hours fell from $163/MWh in 2023 to $48/MWh in 2025, even as natural gas prices rose. Yet the typical day, adjusted for gas prices, looks much as it did in 2022. What vanished is scarcity: hours when real-time prices topped $1,000/MWh fell from about 60 in 2023 to 2 in 2025.
Batteries discharge into exactly those hours, and there are now enough of them to flatten the peaks. Controlling for gas prices, renewables, and demand, each additional gigawatt of batteries is associated with a 9% narrower daily spread.
Merchant revenue collapsed. Texas batteries earned about $193 per kW-year in 2023 and only about $29 in 2025, according to Modo Energy’s fleet index. California batteries’ market revenue fell from about $80 to under $40 per kW-year, before resource adequacy payments. Merchant revenue alone is no longer enough to finance a new battery in either market.
Costs fell too, but not by as much: NLR’s benchmark installed cost for a four-hour system fell about a third from its 2022 peak to 2024, from roughly $517 to $334 per kWh in 2024 dollars. Costs then turned up again: Lazard’s levelized cost of storage rose in 2026, to near the top of its range since 2020, as tariffs cut access to cheaper Chinese cells and new foreign-entity-of-concern (FEOC) rules pushed buyers toward other suppliers.
The Battery Business Has Moved From Energy to Capacity
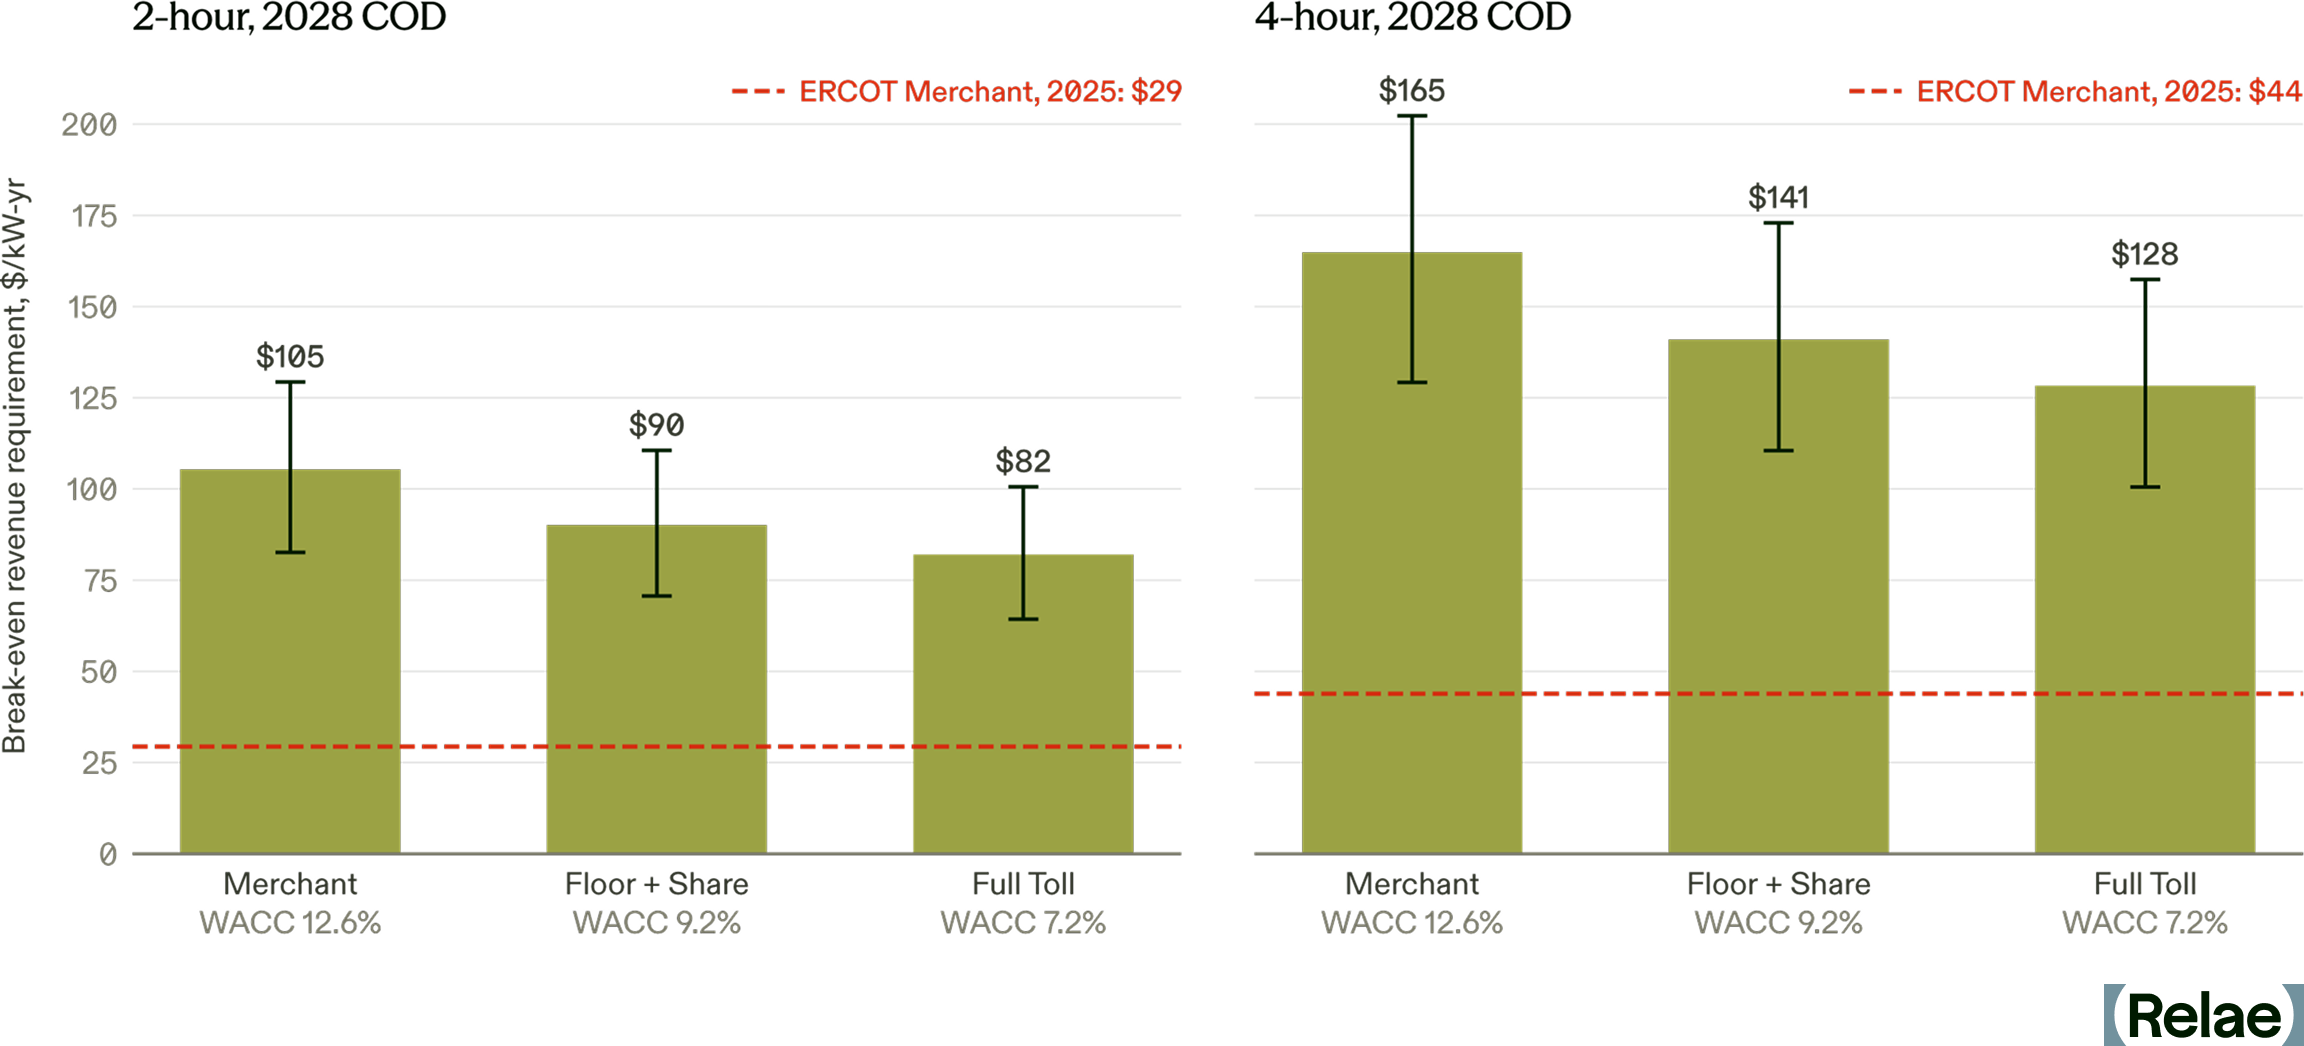
As merchant revenue declines, storage developers are increasingly turning to capacity contracts to support revenue requirements. This has an important advantage: contracted cash flow can carry more debt at a lower cost. Under illustrative financing assumptions, moving a battery coming online in 2028 from merchant to a 15-year toll lowers its cost of capital from about 12.6% to 7.2%.
Using NLR’s projected installed capital costs for 2028, that cuts the annual revenue a two-hour system needs to break even by about 22%, from $105 to $82 per kW-year ($64-101 across NLR’s low- and high- cost cases). However, that is still nearly three times what Texas batteries earned in the market in 2025. Given this gap, new BESS installations might appear to be uneconomic.
Why Are Developers Still Building BESS?
However, new BESS installations continue to be built. This is partly because many battery storage projects coming online now were financed on 2022-23 revenue (the average project can take over four years from entering the interconnection queue to operation), and partly because new contracts, such as tolls, are priced on capacity, not energy: the supplier is obligated to keep certain amounts of capacity available over a given time period, independent of energy delivery.
In Texas (which has no capacity market), such tolls are, in effect, private capacity contracts. In California, resource adequacy already plays that role: batteries’ RA contracts averaged about $9 per kW-month in early 2025.
An owner needs roughly $7 per kW-month for a two-hour battery (about $11 for four hours) to break even, in line with the roughly $7 per kW-month cap on a 20-year battery storage agreement Austin Energy approved in May 2026. By contrast, the energy and ancillary revenue an offtaker could capture by dispatching it is about $2.50–3.50 per kW-month. The difference is what buyers pay for firm capacity: insurance against scarcity events like Winter Storm Uri, capacity to meet their own load obligations, or a hedge against scarcity returning as demand grows.
The Next Battery Wave Depends on Who Pays for Reliability
Batteries have done what they were built to do: absorb volatility and steady the grid. In doing so, they competed away the revenue that financed the first wave. At today’s prices, merchant revenue no longer covers a new battery. The build continues on projects financed in 2022–23 and on capacity contracts worth nearly three times what Texas batteries earn in the market. Whether the buildout continues depends on how many buyers will pay that premium.
Deployment continues to grow in both markets. ERCOT registered about 4.2 GW of new batteries in January to July 2026, against 2.8 GW a year earlier. But the pace is slowing: Texas’s fleet grew about 50% in 2025 after nearly doubling in 2024, and interconnection queues are thinning: ERCOT battery applications fell by half in the second half of 2025.
Wholesale markets financed the first boom. The next wave depends on buyers who value reliability, including utilities, retailers, and large loads such as data centers, and on how cheaply that risk can be priced and capitalized. Data centers in particular put a high value on firm power: research inferring their willingness to pay from cloud computing prices puts it at up to $13,600 per MWh for frontier AI chips on guaranteed service, far above ERCOT’s $5,000 per MWh price cap.
For developers and investors, the question is no longer how much the market will pay, but who will sign, and for how long. For more on how interconnection queues shape how many storage projects get built and how queue wait times vary by technology, see Relae’s interconnection research.
Relae’s Power & Energy advisory team helps developers, investors, and large energy buyers understand and price the value of storage. This includes behind-the-meter modeling, resource portfolio optimization, and interconnection queue analysis.
Frequently Asked Questions
Why are battery storage revenues falling if deployment keeps growing?
Batteries have become victims of their own success. They earned most of their early revenue from two sources: ancillary services and high wholesale market prices. Texas now has more batteries than ancillary services the grid needs, so those prices have collapsed. And because batteries discharge during the most expensive hours, there are now enough of them to flatten the price spikes that used to pay the most.
What is a battery tolling agreement?
A toll is a long-term contract in which a utility or large buyer pays a battery owner a fixed monthly fee for the right to direct how the battery is used. The buyer keeps whatever the battery earns in the market and takes on the risk if that falls short. The owner gets a steady income it can borrow against.
Who is signing these contracts?
Mostly utilities, retailers and power traders, who need capacity to serve their customers or want protection against price spikes. In California, utilities sign capacity contracts with batteries to meet the state’s resource adequacy requirements. Large loads such as data centers place a high value on reliable power, but few have signed contracts with grid batteries so far; most of their battery deals are for on-site power.
Will battery storage buildout slow down?
Not yet. Texas is still adding more batteries each year, largely projects that were planned and financed when revenues were higher. But the pipeline behind them is thinning: new battery applications in ERCOT’s interconnection queue halved in the second half of 2025. Whether buildout holds up depends on how many buyers will pay for capacity at a premium to what the market pays today.
How to Reduce Grid-Wide Emissions for Carbon Capture and Storage
Key Takeaways
- The opportunity: Clean, firm power is a strategic priority for large electricity buyers. Natural gas-fired generation equipped with carbon capture and storage (CCS) is emerging as a key tool in meeting this demand. The existing gas-fired power fleet in the US should be assessed to identify plants well-positioned for carbon capture retrofits that would benefit grid decarbonization.
- The challenge: The climate benefits of CCS-equipped natural gas plants depend entirely on how often they actually run. Adding carbon capture technology increases the cost to operate the equipment. These higher running costs can make the plant less competitive in auctions where the grid operator picks the cheapest power first. Without mechanisms to keep these plants running continuously, they may be outbid by cheaper, higher-polluting plants, causing grid-wide emissions to stay the same or even increase.
- The solution: Hyperscalers and other large energy buyers are creating a robust market for clean, firm power. By paying a "clean, firm premium" through long-term offtake agreements, these buyers can offset the higher operational costs of CCS, ensuring these plants are continuously utilized. This corporate leadership not only maximizes the grid-wide climate impact of each retrofit but also provides an important hedge against policy volatility, securing the investment case for clean innovation even when the future of subsidies like the 45Q tax credit is uncertain.
We Need Clean, Firm Power Now
The market signals for clean, firm power are clear. Meta’s nuclear energy projects and Microsoft’s Crane Clean Energy Center demonstrate growing interest in reliable, low-carbon electricity to support the rapid expansion of AI. Similar commitments by Google and Meta to advanced geothermal power also illustrate this trend.
One of the near-term options to meet this demand is natural gas with carbon capture and storage (CCS). As explored by Relae (formerly Carbon Direct), retrofitting existing gas facilities offers a path to reliable baseload power with low direct emissions, leveraging existing infrastructure to bypass the years-long delays typical of new grid interconnections.
Recent initiatives from Google and Calpine are already working to prove this concept at scale. This type of corporate leadership is driving the market; over the last decade, voluntary corporate procurement led to more than 40% of new clean energy capacity in the US. Further, recent procurement decisions illustrate that these players are willing to pay a “clean, firm premium” to secure round-the-clock, low-emissions sources of power.
Why Systems-Level Analysis Matters for CCS
While news of corporate procurements often makes headlines, recent analysis finds the number of supply contracts for natural gas power with CCS may outpace the number of secured offtake agreements. Without a power purchase agreement (PPA) to ensure competitive operation, or strong policy support, a generator may need to operate as a “merchant plant” in power markets, competing solely on cost.
A power plant’s ultimate climate impact is determined primarily by how it is positioned in the market, not just its facility-level technology.
How Power Markets Determine Which Plants Run
Understanding the potential of CCS to deliver clean, firm power and grid-wide decarbonization requires looking beyond the technology performance at a single facility. A retrofitted plant does not operate in isolation; its impact depends on how it interacts with the broader power market’s merit order.
The merit order is the ranking system in competitive power markets where the grid operator dispatches the cheapest offers first. Since carbon capture units are energy-intensive, the retrofitted natural gas plant incurs higher operating costs. This cost increase can inadvertently price the lower-emitting plant out of the market. Without mechanisms to ensure continuous utilization, the CCS plant is potentially outbid by cheaper, more carbon-intensive resources. This creates a risk of increased overall grid emissions.
To illustrate this dynamic, we’re sharing the results of our detailed grid modeling analyses of the Electric Reliability Council of Texas (ERCOT), which serves most of Texas, and the Southwest Power Pool (SPP), which covers parts of 14 states across the central US. Our analysis highlights the value of corporate “clean, firm premiums” in achieving maximum climate benefit and mitigating policy risk present in government subsidy support.
This type of systems-level grid modeling is necessary in understanding how facility-level reductions translate into real climate benefits. Support to incentivize continuous operation, such as corporate offtake agreements or the 45Q tax credit, is key to ensuring that retrofitting a gas power plant with CCS reduces overall grid emissions.
Offtake Agreements and Policy Support as Solutions
Power offtake from CCS retrofitted gas plants can meaningfully reduce system-level emissions. By directly matching electricity demand with the supply of power, large energy buyers – the offtakers – ensure the power plant is effectively utilized. This type of arrangement helps ensure any changes to reduce emissions intensity at the facility level translate into broader emissions reductions on the grid.
For these offtakers, the decision to pay a premium for clean power is driven by the goal of additionality – ensuring their procurement has a measurable, additional emissions reduction impact. Beyond physical energy, buyers secure Energy Attribute Certificates (EACs) for CCS, which serve as the verified proof of low-carbon generation required to satisfy corporate zero-emissions targets. As seen in the recent Google and Calpine agreement, these certificates allow buyers to claim the specific climate benefit of the CCS retrofit, justifying a premium over standard wholesale market rates to secure firm, clean delivery.
In the absence of offtake agreements, policy frameworks like the 45Q tax credit (up to $85 per ton of CO2 sequestered) serve a similar function by offsetting production costs.
However, access to this credit is not a guarantee and carries operational hurdles. To unlock the full credit value, facilities must meet stringent prevailing wage and apprenticeship requirements. Furthermore, the credit is limited to a 12-year window once the facility is placed in service, and requires construction to commence by 2033.
Beyond these eligibility requirements, the long-term outlook for 45Q involves inherent uncertainty. Recent regulatory shifts, including potential changes to the Greenhouse Gas Reporting Program (GHGRP), pose risks to the verification mechanisms required to substantiate captured tons.
Corporate offtake agreements offer a crucial private-sector complement to this landscape; they provide a stable revenue model independent of policy cycles, ensuring the investment case remains robust over the full life of the asset.
Understanding the Merit Order in Power Markets
Most US power plants operate in competitive deregulated markets, where grid operators dispatch generators based on their marginal cost of production – the cost of generating one additional unit of electricity. The operator ranks these offers from lowest to highest price, creating the "merit order.”
In these auctions, the cheapest resources (typically renewables and base load) are dispatched first. Progressively more expensive units (gas and peaking plants) are called upon until demand is met. The price of the final, most expensive unit required sets the market-clearing price received by all generators in that period.
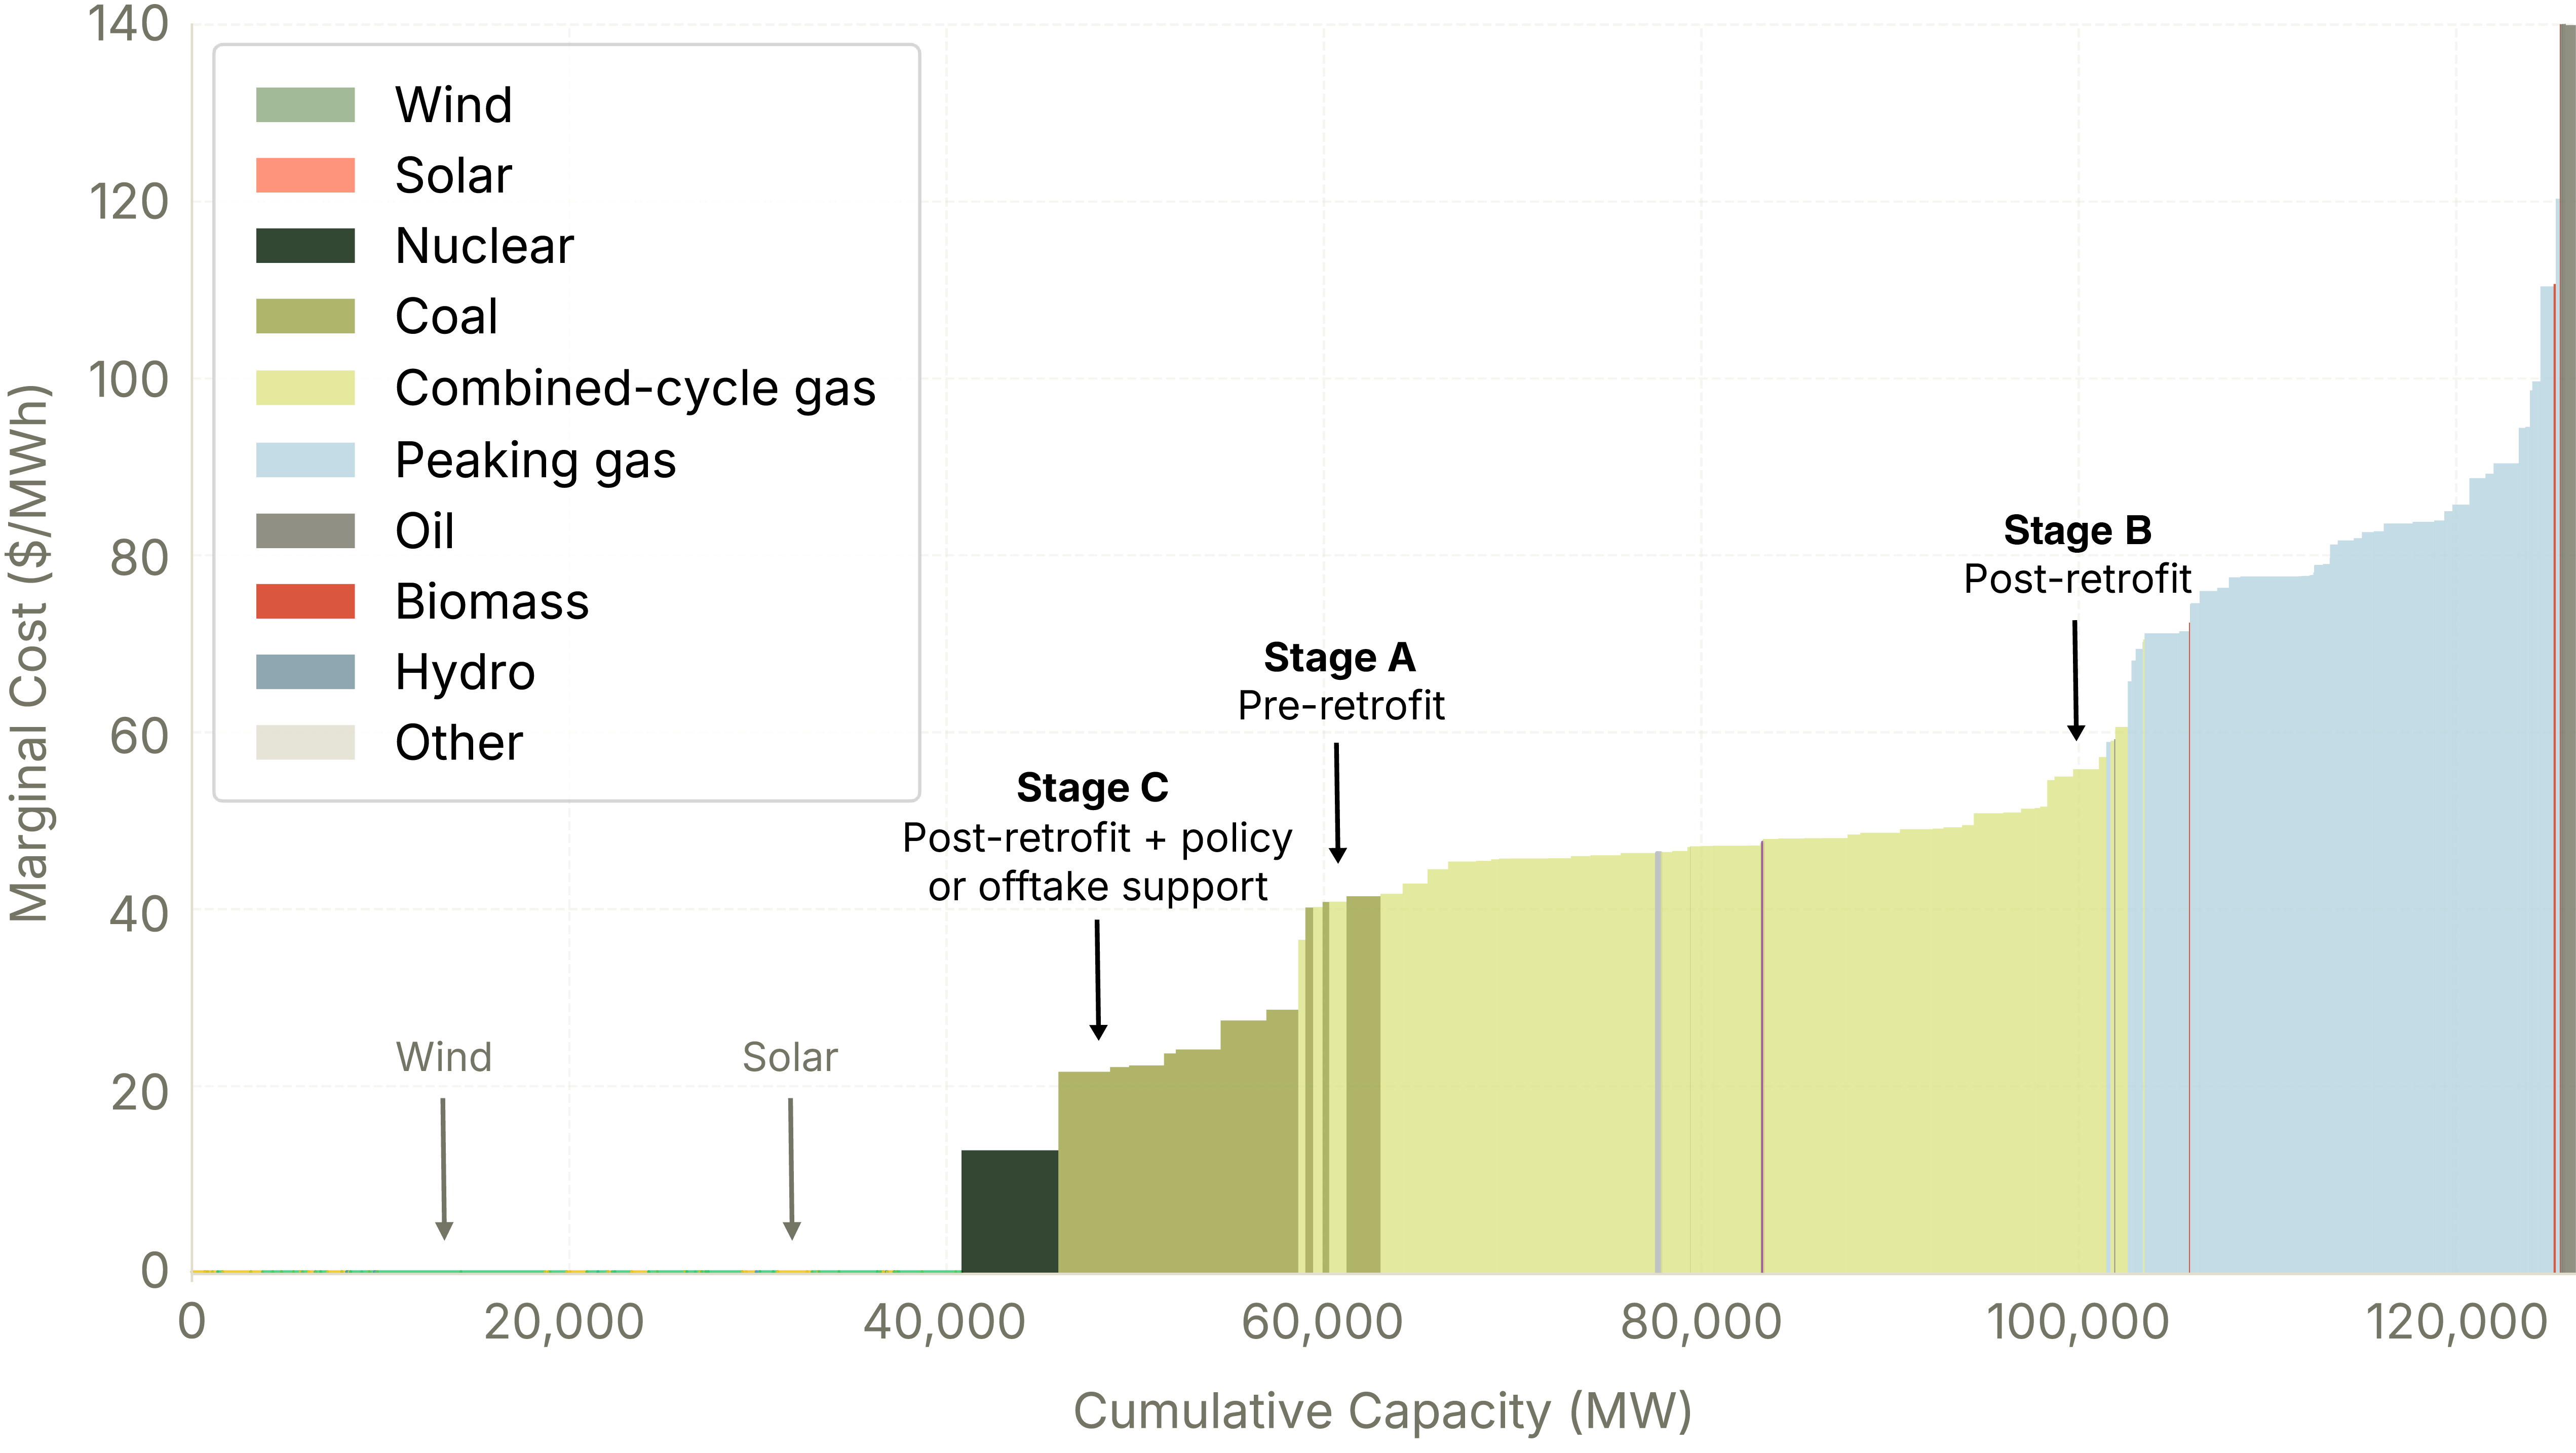
The Figure below shows an example generation merit order in the ERCOT energy market.
Case Study: How Support Structures Influence Dispatch
The merit order figure illustrates a hypothetical scenario for a natural gas generator, showing how its market position changes based on technical and policy variables:
- Pre-Retrofit (Stage A): The plant operates with standard marginal costs, sitting competitively in the middle of the supply stack.
- Post-Retrofit (Stage B): Retrofitting with CCS introduces higher operating costs due to the energy-intensive nature of carbon capture. Without external support, the plant’s marginal cost increases (A to B), making it less competitive. The retrofitted plant may be utilized less while cheaper units are dispatched to meet demand.
- Post-Retrofit + policy or offtake support (Stage C): Financial support, whether through the 45Q tax credit (approx. $33/MWh1) or a corporate offtake agreement, can effectively offset the plant’s higher operational costs (B to C). This effect restores the plant’s competitiveness, ensuring it dispatches consistently.
Testing This With Grid Modeling
At Relae, we apply state-of-the-art grid analysis tools to answer these and more complex analytical questions related to the future energy system. Our custom modeling framework has been used to simulate clean power strategies, assess data center demand response programs, and understand how procurement decisions today impact the future energy system.
While the theoretical impact of a CCS retrofit, a PPA agreement, and the 45Q tax credit on a plant’s dispatch is clear, it’s important to put the theory to the test by modeling their effects on system-wide emissions.
Our Modeling Approach
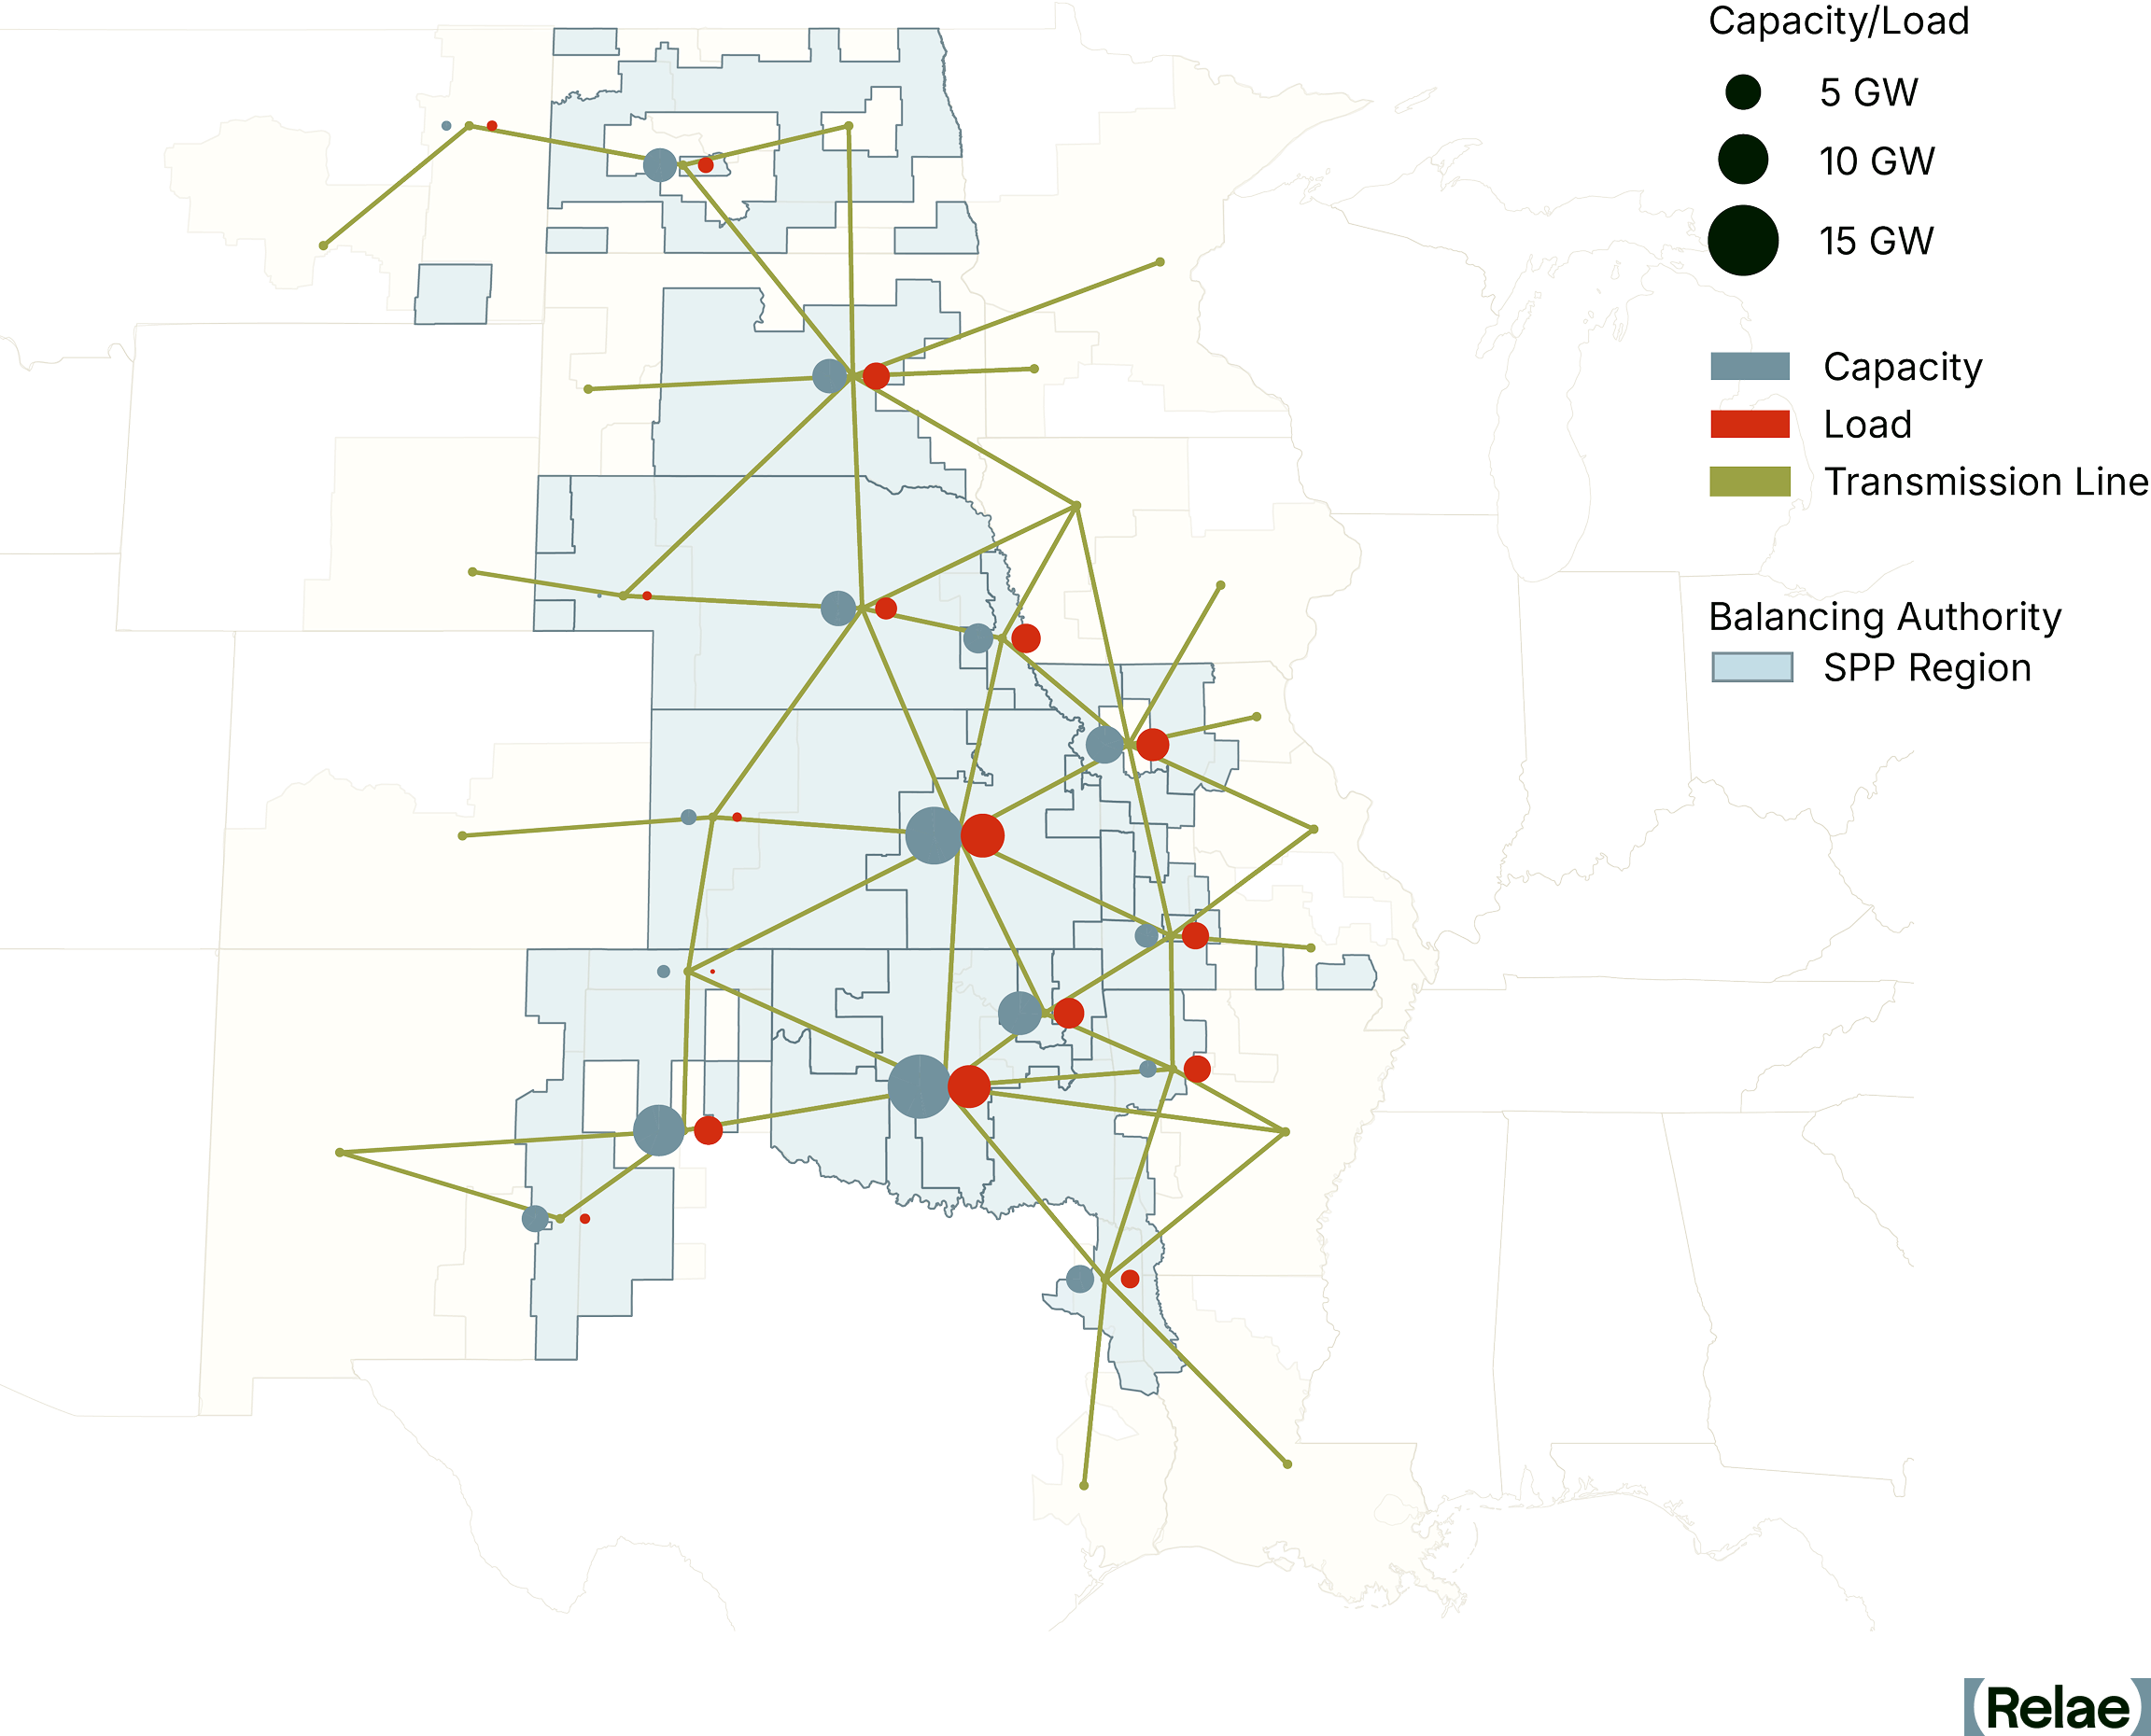
Because each grid region has distinct power plants and load requirements, they must be modeled separately. For this analysis, we chose to model the ERCOT and SPP power markets to determine the region-specific, grid-wide emissions impact of hypothetical CCS retrofits of natural gas power plants.
As part of this modeling, we:
- Deployed detailed hourly simulation: We used our custom PyPSA-USA grid model to produce a set of hourly simulations of the ERCOT and SPP electricity markets.2
- Identified suitable retrofits: We identified suitable combined cycle gas power plants for a CCS retrofit in each of the markets, based on key commercial and operational criteria, including size, age, generation profile, and proximity to CO2 transport/storage.
- Modeled plant and energy assumptions: To reflect the retrofit, we adjusted generator cost and energy use for the identified plants (up to 1.4 GW capacity), fitting all combustion turbines with capture and requiring each plant to consume 20% more fuel per unit of electricity produced to power CCS.3
- Carried out comparative scenario analysis: We simulated several scenarios, including (1) pre-retrofit, business-as-usual, (2) post-retrofit, with and without a PPA, and (3) post-retrofit, with and without the 45Q tax credit, to isolate the impact of different procurement agreements and policy landscapes on grid-wide emissions.
What Our Analysis Reveals
Results of this analysis reveal how CCS deployment in the power grid interacts with market economics and the role mechanisms that drive high utilization of CCS retrofit plants can have in ensuring system-wide emissions reductions:
CCS With a Firm Offtake Agreement Can Significantly Reduce Grid-Wide Emissions
Pairing a retrofitted plant with a dedicated offtaker can drive meaningful emissions reductions in both ERCOT and SPP compared to business-as-usual (-0.8% to -1.7% CO2 in ERCOT; -5.2% to -7.3% CO2 in SPP). Under these arrangements, system-wide emissions fall because the PPA acts as an operational anchor, ensuring the retrofitted plant maintains high utilization rates despite its higher running costs. Ensuring the plant stays utilized prevents the grid from reverting to more carbon-intensive generation to fill the gap.
Our analysis finds the value of the operational “clean, firm premium” for natural gas with CCS power is up to $60 per MWh. This value varies by hour, region and scenario but results generally align with our previous estimate of a $30 per MWh value associated with this type of generation. Other estimates put this value between $19 and $72 per MWh.
CCS Without an Offtake Agreement Can Reduce Emissions, But Is More Reliant on Policy Support
Without a dedicated offtake agreement or policy support, retrofitting natural gas plants with CCS runs the risk of a small increase in grid emissions (+0.7% CO2 in ERCOT; -0.0% CO2 in SPP). System-wide emissions are higher because other power plants displace the plants with carbon capture. The higher operational costs of CCS mean the CCS plants have a less competitive place in the merit order and run for fewer hours in the year.
The story changes with the application of 45Q, and grid-wide emissions are lower for both ERCOT and SPP (-1.7% CO2 in ERCOT; -3.4% CO2 in SPP). Access to the 45Q tax credit improves each CCS plant’s position in the merit order, meaning that it runs for more hours and successfully displaces higher-emitting generation with clean, firm power.
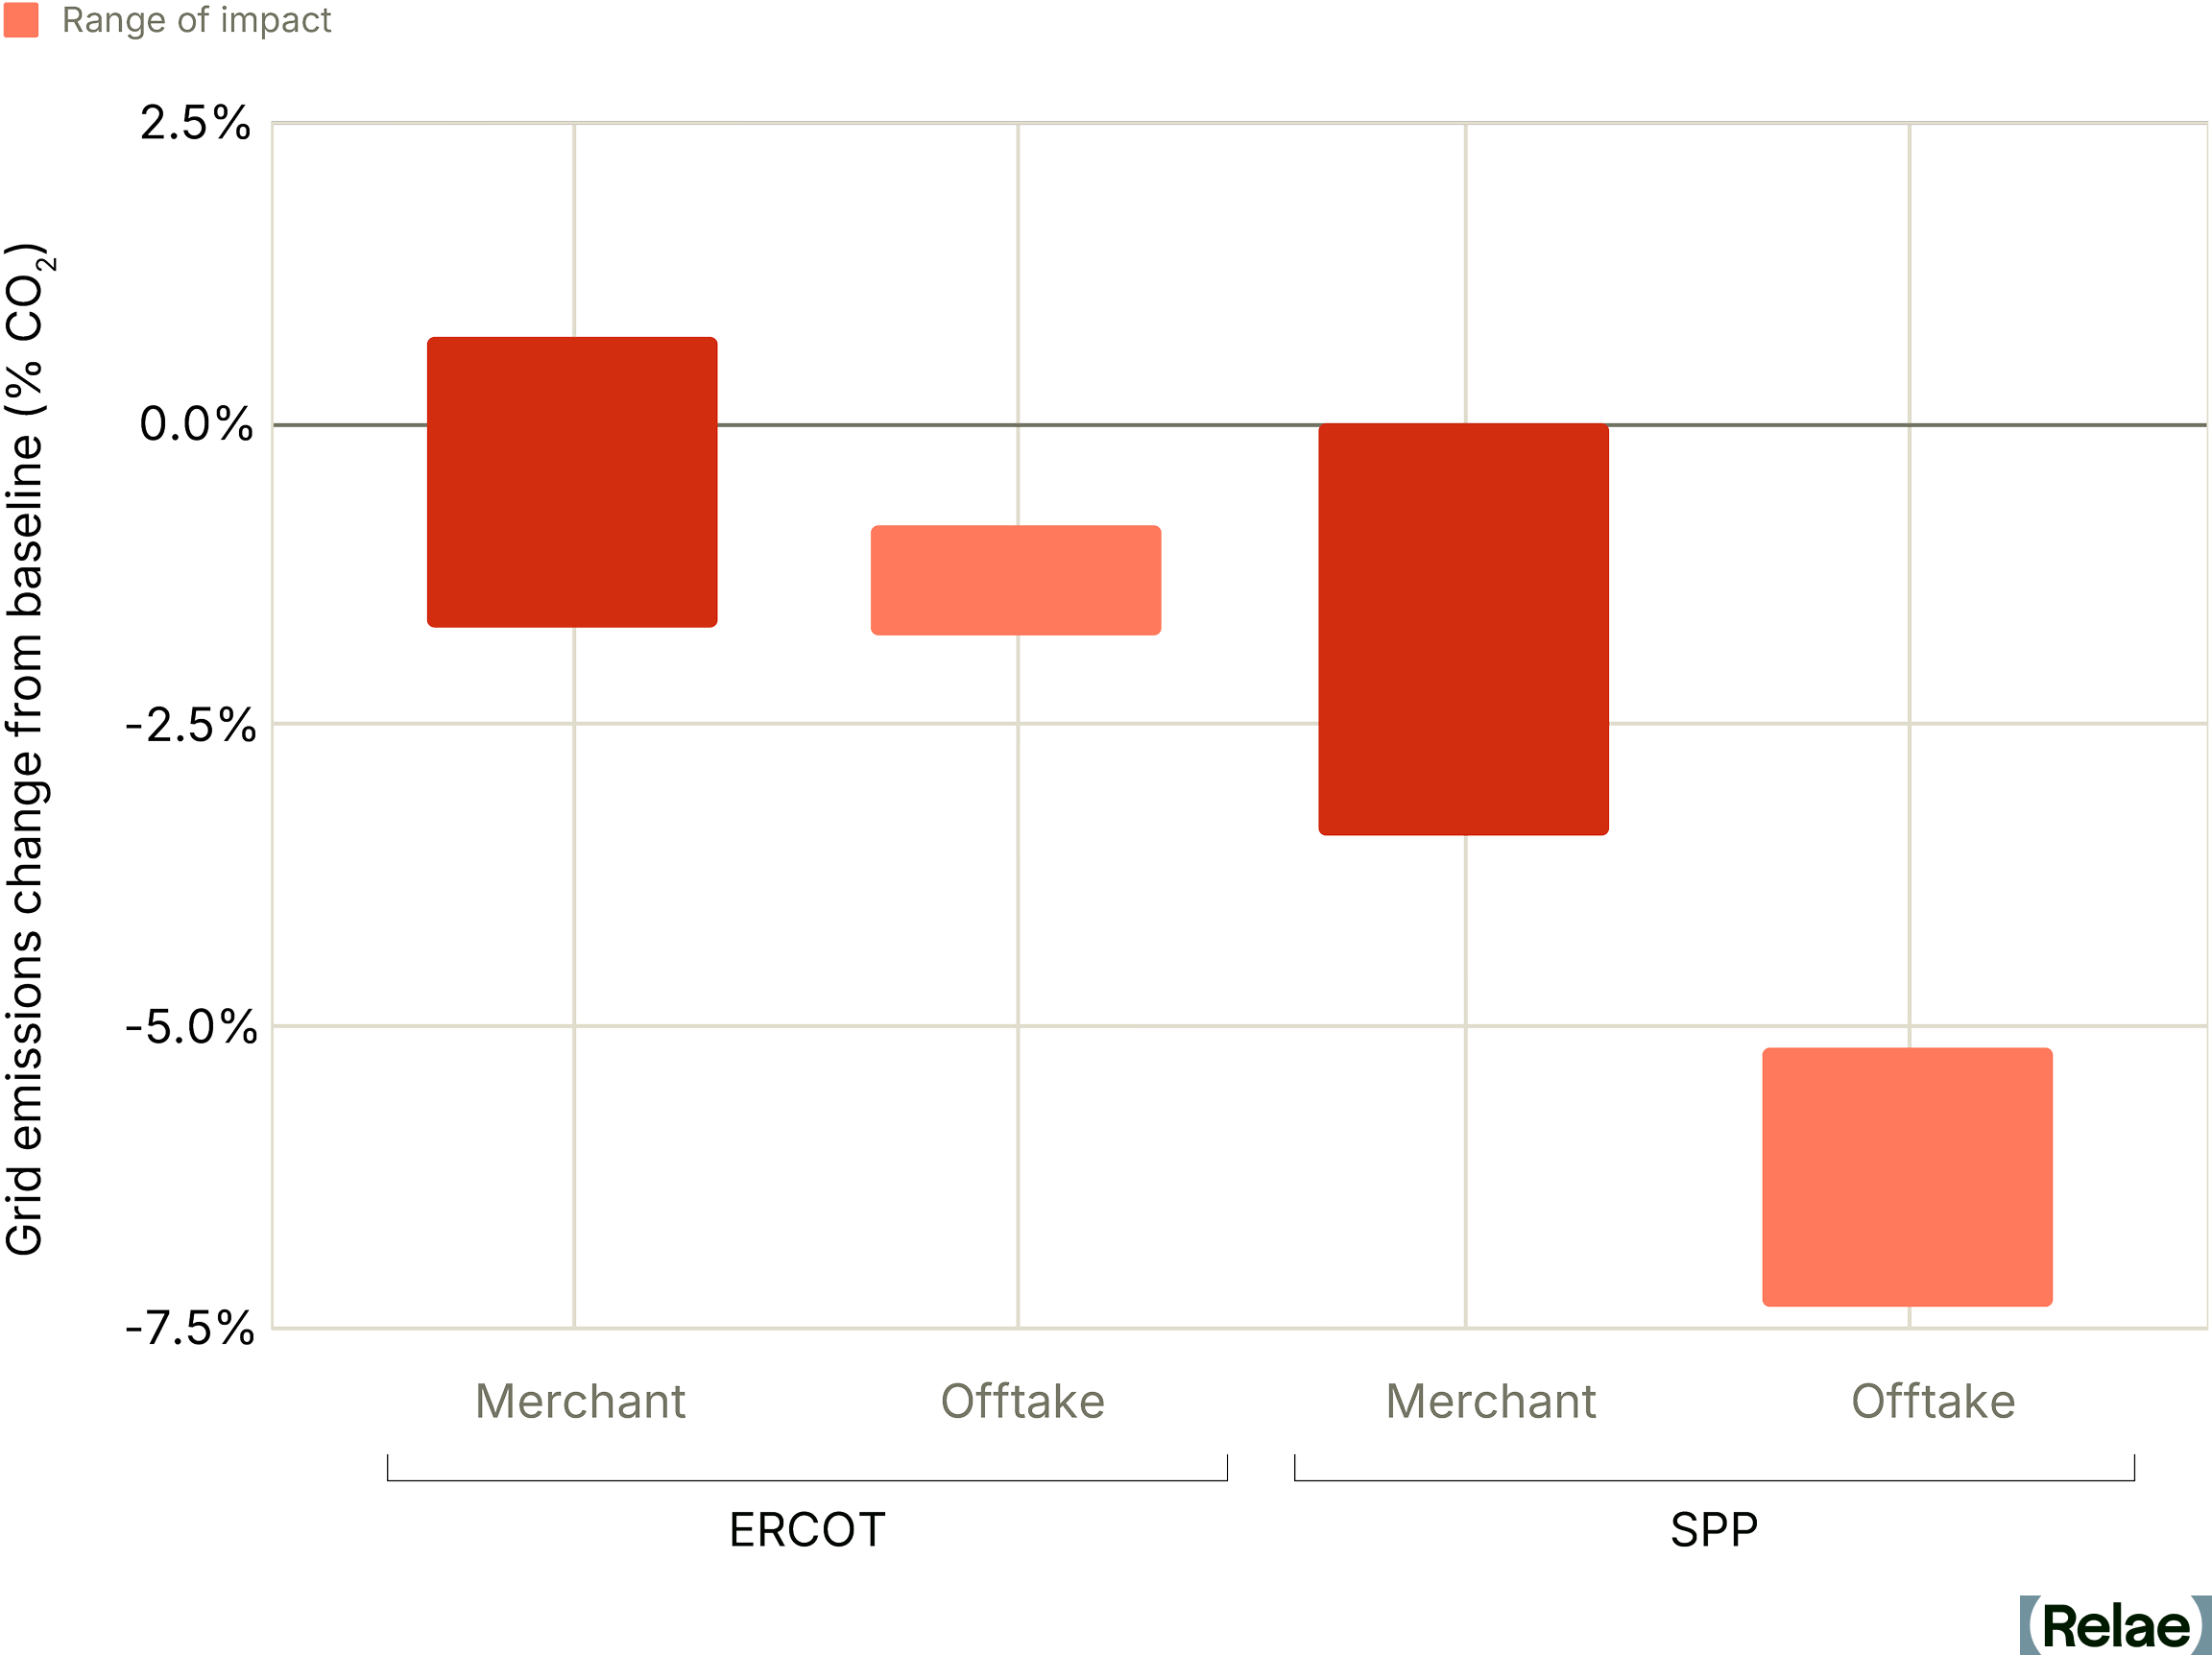
The Path Forward for Clean, Firm Power
Our analysis illustrates that in competitive power markets, the overall carbon emissions impact of natural gas generation with CCS cannot be measured solely at the power plant level. While clean, firm power remains a strategic priority for large electricity buyers, and CCS is a key tool to meet this demand, the overall climate value of a successful retrofit is linked to the availability of offtake agreements and the plant’s position in the merit order.
A systems-level perspective captures what facility-level analysis misses: how market dynamics determine the true climate impact of decarbonization investments. Support mechanisms for the continuous operation of low-carbon power plants, like PPAs and the 45Q tax credit, are important tools that ensure clean, firm power reaches the grid, effectively bridging the competitiveness gap.
Frequently Asked Questions
How can companies ensure CCS retrofits actually reduce grid-wide emissions?
By securing the plant’s dispatch through a long-term offtake agreement, or by utilizing a policy incentive like 45Q. Relae’s modeling found that offtake agreements have a substantial impact on the emissions reduction potential of CCS retrofits.
Why would the dispatch decisions of one power plant affect others?
Power plants dispatch according to marginal cost, and grid stability requires that total supply remain constant at any given moment. So, if one large plant suddenly dispatches less (say, because its operating costs have increased), other potentially dirtier plants may ramp up to fill the gap, increasing total system emissions.
How to Fix Load Forecasting for the AI Era
Key Takeaways
- Accurate load forecasting is needed to distinguish and prioritize real demand, align capital deployment, and reduce delays in bringing new power capacity online. Traditional load forecasting was built for predictable, gradual demand growth, not for the scale, uncertainty, and dynamic behavior of data centers.
- The system-level fix to data-center load forecasting requires probabilistic, more frequent, category-specific methods paired with mandatory data standards and policy alignment. Together, these give planners visibility into the range of possible futures and the likelihood of each.
- Without that fix, today's forecasts conflate real demand with speculative submissions, reducing accuracy. Inaccurate forecasting in either direction is expensive: underbuild adds friction to economic development; overbuild risks raising retail rates. Both can erode public trust in planning.
- Behind-the-meter generation (BTM) and load flexibility can help achieve speed-to-power in the near term. Just 1% data-center flexibility could unlock 100 GW—more than the entire US nuclear fleet.
Load Growth Is Increasing, Uncertain, and Concentrated
For two decades, US electricity demand was flat. Utilities, transmission planners, and corporate buyers built their planning models around that reality. Then AI workloads changed it.
AI load growth is large, uncertain, and concentrated in major power markets. While load forecasting projections vary across studies, the trajectory is clear: electricity demand is scaling faster than the bulk power grid was designed to handle. Accurate load forecasting is needed to distinguish and prioritize real demand, align capital deployment, and reduce delays in bringing new power capacity online.
On April 30, 2026, Relae (formerly Carbon Direct) hosted a Trellis Group panel on load forecasting in the AI era. Panelists included Derya Eryilmaz, PhD, Vice President of Power Commercialization at Relae; John Miller, Director of Transmission Policy at the Corporate Energy Buyers Association (CEBA); Daniel Padilla, Strategy and Business Development Lead at Emerald AI; and Sam Hodas, Head of US Government Affairs at National Grid. Jake Mitchell, Director of Climate Tech Innovation at Trellis Group, moderated.
The conversation explored where load forecasts fail, what they cost, how to fix them, and near-term solutions to overcome grid constraints. Here is what the panel found.
What Is Load Forecasting?
Load forecasting is the practice of predicting how much electricity will be consumed across a region, at what times, and under what conditions. It informs the major capital and procurement decisions on the grid: where to build transmission, how much generation to procure, what capacity to bid into wholesale markets, and how corporate buyers secure clean, firm power.
Long-term forecasts inform multi-year decisions about transmission and generation. Short-term operational forecasts inform real-time grid operations and trading. The two often sit in separate workflows, but short-term operational forecasts should feed into long-term system planning to improve accuracy as demand patterns shift.
The Bulk Power Grid Is Under Strain
Large power users face constraints on clean, firm power, transmission capacity, multi-year interconnection queues, and aging infrastructure. The strain is most acute in PJM Interconnection (PJM) and the Electric Reliability Council of Texas (ERCOT), the two US markets expected to see the most significant load growth. Each constraint raises the cost of getting load forecasts wrong.
Hodas from National Grid describes the operational reality on the utility side: aging infrastructure inherited from a different demand era. “We’ve got transmission lines that are 70 to 100 years old in New York and Massachusetts, some of the oldest in the country, still in operation.” Replacing or upgrading that infrastructure requires investment, and ratepayers are already pressed.
Why Today’s Load Forecasts Fail
Traditional load forecasting was built for predictable, gradual demand growth, not for the scale, uncertainty, and dynamic behavior of data centers.
Most utilities and Independent System Operators (ISOs) produce load forecasts on annual or biannual cycles. They aggregate submissions from individual customers, run that data through a deterministic single-peak load estimate against a single capacity scenario, and pass the consolidated forecast up to regional planners. Regional Transmission Organizations (RTOs) roll those bottom-up utility forecasts into a regional view.
This worked when demand was flat and predictable. It no longer works with nonlinear growth driven by data centers. Eryilmaz from Relae identifies key structural limitations.
Four Structural Limitations to Traditional Forecasting Methods
- Over-stating and double-counting. Data centers bid into multiple regions while shopping for power, inflating regional forecasts and blurring the line between real and hypothetical demand—the speculative-load problem.
- Deterministic models (vs probabilistic models). Most planning runs a single peak load estimate against a single capacity scenario, missing the geographic concentration and uncertainty inherent in integrating large loads into the system.
- Aggregated submissions. Utilities report large loads as a single block of gigawatts, with no resolution into workload type, ramp schedule, or operational shape. Planners reverse-engineer peak-demand assumptions rather than measure them.
- Infrequent cadence. Annual or biannual forecasts cannot catch an 80% queue reduction or a multi-gigawatt addition between cycles.
The Speculative-Load Problem
The core challenge in load forecasting is distinguishing real versus hypothetical load. While data center electricity demand is projected to grow by 13-27% annually through 2028, the majority of the projects in the data center queue may not materialize, inflating regional load forecasts.
American Electric Power's Ohio utility (AEP Ohio) introduced a tariff requiring data centers to put up firm financial commitments before getting in line for grid connection. Its interconnection queue dropped from 30 gigawatts to 5.6 gigawatts. More than 80% of the submitted load was speculative: projects that disappeared once commitment became required.
ERCOT shows the same overstatement problem on a larger scale. Roughly 225 gigawatts of data center demand sits in the ERCOT queue against a historic system peak of 85 gigawatts. Texas Senate Bill 6 introduced similar financial obligations for new loads, but those rules apply only to interconnections after 2025, and the cleanup of speculative demand has not yet materialized.
The speculative-load problem shows up in interconnection times. An average new project in PJM can wait 4 to 5 years to become operational. Some of that delay is a real backlog. The rest comes from the inability to distinguish real submissions from speculative ones.
As Eryilmaz puts it, “Load forecasting is actually the center of all of these problems. It is a tool to help planners make the right investment decisions.”
The Cost of Inaccurate Forecasting
As Miller from CEBA notes, “A single misforecasted project can swing a transmission plan by hundreds of megawatts.” Significant inaccuracies can erode public trust in the planning process in two main ways. Underbuilding adds friction to economic development and can limit corporate access to clean power markets. Conversely, overbuilding risks raising retail rates if capacity remains underutilized.
The goal is to achieve right-sized infrastructure investment. When planning aligns with actual large load growth, it can be net beneficial to retail rates. By spreading fixed costs across more usage, significant new demand can put downward pressure on the rates via the “denominator effect.”
On the other hand, forecasting variability can distort capacity procurement and interconnection queue prioritization. When load forecasts spike upward, grid operators like PJM have to scramble to buy additional electricity capacity on short notice. These emergency procurements lock in major dollar commitments on the basis of unstable forecast numbers.
PJM, Midcontinent Independent System Operator (MISO), and Southwest Power Pool (SPP) have also reshaped their interconnection queues to make room for new large loads, but those queue priorities depend on the same forecasts that are unreliable in the first place.
“There is no substitute for good backbone regional transmission planning,” Miller says. “Full stop. That is the enabler of all of the load growth that we’re talking about.”
BTM Generation and Load Flexibility: A Near-Term Bridge
Hyperscalers’ need for power is way faster than that of utilities and RTOs. Generation alone cannot scale fast enough to meet this new demand, and hyperscalers need speed-to-power.
As Eryilmaz frames it, behind-the-meter generation and load flexibility are interim solutions to the timing mismatch between data center urgency and the grid's slower build cycles. BTM generation and flexibility work differently:
- BTM is power generated on the data center's side of the utility meter, bypassing grid interconnection entirely. The structure gives operators large, reliable blocks of power without waiting years for grid approval.
- Load flexibility is the demand-side approach. A data center modifies its grid draw in response to grid signals. In practice, that can mean curtailing compute workloads during stress events, pre-cooling facilities ahead of a heat wave, drawing from on-site batteries or generators, or shifting workloads to data centers in less-constrained regions.
The Value of Load Flexibility
Relae’s power system modeling quantifies the dollar value of load flexibility in ERCOT. Load flexibility can eliminate forced load shedding risk, even at 40 gigawatts of data center buildout, preventing $5.5 billion in annual consumer welfare losses by curtailing an average of 5% of demand for under 1% of operating hours.
Padilla from Emerald AI reinforces the scale and value of load flexibility: “With just 1% flexibility, we can unlock 100 gigawatts of data centers across the US. That’s more than the entire US nuclear fleet.”
Silicon Valley Power, a municipal utility, is the first US utility to tie flexibility to interconnection speed: flexible data centers get connected faster. NVIDIA, EPRI, Digital Realty, and PJM are partnering on the Aurora AI Factory, the first purpose-built reference design for flexible AI data centers.
But standardized policy for load flexibility is lagging. Padilla highlights this challenge: “Today, if a data center wants to be flexible, they have nowhere to point. We need standardized tariffs, interconnection rules, and product definitions for large loads that reward them with upsizing interconnection in response to flexibility.”
Flexibility Takes Many Forms, but it Isn't Universal
Flexibility means accepting brief, predictable downtime, and some workloads can't tolerate it. Hospital systems and mission-critical enterprise applications need 99.999% uptime, the "five nines" standard. As Padilla puts it: "99.9% uptime, with brief and predictable curtailments, is plenty" for most AI workloads. That distinction determines which data centers can participate in flexibility programs.
Miller points out that compute-level flexibility is not always feasible. BTM batteries and virtual power plants (VPPs) are among the alternatives that can offset what data centers withdraw when the grid is stressed, even at facilities whose compute workloads cannot pause directly.
Better Load Forecasting: The Longer-Term Fix
While BTM generation and load flexibility can help address near-term speed-to-power, the longer-term fix is improving load forecasting methods and the standardization of data provided by the data centers themselves.
Eryilmaz outlines three technical shifts for better load forecasting:
- Embed short-term operational forecasting into long-term planning. Short-term spikes, weather risk, and reserve considerations carry direct implications for multi-year capital decisions. The line between operations and planning breaks down when growth is nonlinear.
- Replace deterministic models with probabilistic methods. Risk metrics like loss of load hours (expected hours per year that demand exceeds supply) and expected unserved energy (total expected energy shortfall) measure both how much capacity the system has and the conditions under which it might fall short. The North American Electric Reliability Corporation (NERC) has suggested both metrics as part of its reliability framework.
- Forecast load by category. Treating all data center load as a single block hides the differences in load profiles, operational schedules, and ramp-up timing that drive system planning.
Policy Alignment
Technical forecasting improvements only scale with policy alignment, and Miller proposes a two-part fix:
On the top-down side, RTOs need authority to take an independent view of utility-submitted forecasts. They should require milestones, such as firm financial commitments and secured financing, before counting a submitted load against the regional forecast.
On the bottom-up side, state regulators set the rules that govern how individual utilities prepare their forecasts. Large load tariffs play a big role in how utility-level forecasts come together. Federal and state authorities need to row in the same direction. Hodas frames the same alignment from the utility side: “Grid investment unlocks economic growth, but for us to make those investments, we need regulatory certainty.”
Standardizing Large-Load Data
The Federal Energy Regulatory Commission (FERC) has since moved: in June 2026 it issued show cause orders directing six RTOs and ISOs—CAISO, ISO-NE, MISO, NYISO, PJM, and SPP—to revise or justify their large-load interconnection rules, and in July 2026 it directed NERC to develop computational-load reliability standards and registration criteria by the end of the year. Both are useful first steps. But as Eryilmaz argues, voluntary disclosure has not closed the gap.
The industry cannot meaningfully compare ISO forecasts when each utility submits load data in different shapes (e.g., using different methods and data standards) on different schedules. Mandatory submission requirements and published methodologies, applied consistently across utilities, ISOs, and state regulators, are the only path to forecasts whose components are actually comparable.
Getting Load Forecasting Right Starts Now
The system-level fix to improving forecasting is through probabilistic, category-specific methods paired with data standardization and policy support. Together, these account for the scale, uncertainty, and dynamic behavior of data center loads, and give planners visibility into the range of possible futures and the likelihood of each.
All forecasts will be wrong to some degree, but as Miller puts it, “It's ultimately not about having a perfect prediction. It's about baking in methods to account for uncertainty.” These system-level improvements won't eliminate errors entirely, but they will minimize them, leading to more confident investment decisions and a grid better prepared for what's ahead.
Frequently Asked Questions
What is load forecasting, and why is it harder now with AI data center loads?
Load forecasting predicts how much electricity a region will consume, when, and under what conditions—the basis for where to build transmission, how much generation to procure, and how corporate buyers secure clean, firm power. It was designed for two decades of flat, gradual demand growth. Data center load is none of those things: it is large, geographically concentrated, arrives in gigawatt blocks with no disclosed operating shape, and can be withdrawn as quickly as it appeared.
What is speculative load in an interconnection queue, and how do planners tell it apart from real demand?
Speculative load is capacity requested by projects that may never be built — often the same data center bidding into several regions at once while shopping for power, which counts the same gigawatts more than once. The tested filter is a financial commitment: when AEP Ohio required firm commitments before queue entry, the utility's reported data center pipeline fell from about 30 GW to roughly 5.7 GW. Milestone requirements, independent RTO review of utility submissions, and mandatory data standards are the tools planners have.
Is load flexibility proven and scalable today, or still emerging?
The modeling case for load flexibility is strong; the commercial case is still early. Duke's Nicholas Institute found the 22 largest US balancing authority areas could absorb roughly 76–126 GW of new load if it accepts modest curtailment, and Relae's ERCOT modeling shows demand response eliminating forced load shedding risk at 40 GW of data center buildout, avoiding $5.5 billion in annual consumer welfare losses. What is still missing is the market plumbing—standardized tariffs, interconnection rules, and product definitions—so a data center willing to be flexible has somewhere to sign up.
What should a company look for when evaluating a region's load forecast?
Ask whether the forecast is probabilistic or a single deterministic peak, how often it is refreshed, and whether large loads are broken out by category and operating shape rather than reported as one block of gigawatts. Then ask what milestone or financial commitment a project must clear before its megawatts count toward the forecast. A forecast that cannot answer those three questions cannot tell you how much of the queue ahead of you is real.
[cta]