Low-Carbon Fuels Get a Market-Based Reporting Home
Key Takeaways
- The Greenhouse Gas (GHG) Protocol’s Actions and Market Instruments (AMI) proposal would formally recognize market-based instruments across emissions scopes for the first time, within Statement 2.
- The proposal substantially expands opportunities for companies to report lower emissions from purchasing market-based instruments for low-carbon fuels (LCF), such as book-and-claim environmental attribute certificates (EACs) for sustainable aviation fuel (SAF) and renewable natural gas (RNG).
- Companies purchasing or already holding market-based instruments for SAF, RNG, and other low-carbon fuels should begin mapping those instruments to the AMI’s proposed reporting structure now, before the standard is finalized.
The Current Reporting Problem With Low-Carbon Fuels
A low-carbon fuel is defined as a fuel whose lifecycle greenhouse gas (GHG) emissions are lower than those of a relevant, use-case-specific fossil fuel baseline. Most LCFs used today are created from biogenic sources like agricultural residues, used cooking oil, or landfill gas, and their use often results in reduced GHG emissions due to the fact that the CO2 they release during use is biogenic and not fossil.
Consumers of LCFs face a reportability problem. Many buyers track LCF purchases through market-based instruments such as book-and-claim and mass balance EACs. These instruments unbundle environmental claims from physical molecules to facilitate investment in LCFs when direct provision of the molecule is infeasible. However, the current GHG Protocol only permits the use of market-based tools for electricity-based emissions.
Currently, companies cannot recognize the emissions benefit of an LCF purchase unless they physically receive and combust the fuel. Given that sustainable aviation fuel, renewable natural gas, and other LCFs typically flow into shared pipeline and distribution infrastructure rather than being delivered to buyers as distinct physical molecules, direct delivery is often not achievable in practice. This limitation constrains demand growth in the voluntary market.
The value of LCFs to voluntary buyers is the sustainability claim attached to the molecule, not the molecule itself. Without a credible reporting framework for market-based instruments, buyers struggle to justify LCF procurement. Producers, in turn, may face a market where buyer reluctance limits commercial opportunities for scale-up. Non-reportability inhibits one of the few available levers to incentivize voluntary investment in climate solutions.
[cta]
How Does the AMI Proposal Address Non-Reportability?
The Actions and Market Instruments (AMI) proposal introduces a four-statement reporting framework, with all four statements relevant to elements of LCFs. Together, these statements give organizations across the LCF value chain a standardized way to account for LCF procurements in their sustainability reports, whether those procurements are physical or through market-based instruments.
- Statement 1 covers the physical GHG inventory and is the traditional GHG Protocol inventory as it exists today. Companies that physically receive and combust LCFs recognize the lower GHG emissions here.
- Statement 2 proposes a market-based GHG inventory for all emissions scopes. For the first time, this will allow companies to report the carbon intensities of book-and-claim and mass balance EACs for LCFs within a GHG Protocol-aligned inventory. This is a shift from the current framework, which relegates market-based instruments for LCFs and other products, along with carbon credits, to a supplemental section outside of the core emissions inventory. By bringing these purchases into the inventory itself, Statement 2 puts market-based LCF claims on a more equal footing with the emissions companies already report.
- Statement 3 covers beyond value chain interventions as well as GHG emissions reductions/avoidance reported relative to a baseline counterfactual (e.g., the domain of carbon credits). Avoided methane emissions upstream from RNG use is one LCF-relevant example that might live here.
- Statement 4 captures non-GHG indicators and could include things such as the quantity of an LCF procured or produced. This rounds out the story an organization tells about how LCFs fit within their operations and value chain.
How the AMI Proposal Applies to Specific Fuel Types
Two important LCFs are impacted by the current GHG Protocol guidance and offer an example of the significance of the AMI proposal.
- SAF is a biobased or synthetic drop-in substitute for conventional jet fuel.
- RNG, generally produced from organic wastes, is a drop-in substitute for conventional natural gas.
Both are typically delivered through existing infrastructure. SAF is typically blended into a common fuel supply. RNG is often injected into the broader gas network. The buyer typically does not have a direct physical link to the molecule’s consumption, but rather an indirect claim on molecules injected into a common system.
Current GHG Protocol guidance disallows using and reporting market-based LCF emissions factors within corporate scope inventories. If finalized as proposed, the AMI proposal’s Statement 2 would open the aperture for companies to report the lower emissions from purchasing SAF or RNG market-based instruments. Here’s how that might work.
SAF: Reporting Across the Value Chain
When an airline physically receives and burns SAF in its aircraft, the lower combustion emissions are reflected in its Statement 1, scope 1 emissions inventory. This is reported the same way as conventional jet fuel.
The picture changes when airlines use market-based instruments. Many airlines purchase scope 1 SAF certificates that are decoupled from the physical fuel and tracked via book-and-claim or mass balance EACs. Under the AMI proposal, the lower emissions factors of these instrument purchases would be reflected in an airline’s Statement 2, scope 1 emissions inventory.
Corporate buyers face a parallel situation. Companies that purchase scope 3 EACs from SAF suppliers or through airline programs to address employee travel would reflect these lower emissions factors in their Statement 2, scope 3, category 6 emissions. Legitimate Statement 2 claims provide additional incentive for corporate climate action to address travel emissions.
RNG: Reporting Across the Value Chain
As with SAF, an organization that physically receives and combusts RNG can reflect the lower emissions in its Statement 1, scope 1 emissions inventory.
More often, RNG is injected into the shared gas network and claimed by users through book-and-claim or mass balance certificates rather than physical delivery. Statement 2 introduces a reporting opportunity for RNG EAC purchasers to report lower scope 1 emissions. Lower emissions from RNG consumption could also be passed through as reduced scope 3 emissions for consumers of products associated with RNG consumption.
RNG carries an additional nuance. Some RNG projects may also claim to have avoided methane emissions (e.g., dairy manure methane emissions avoided by way of diversion to RNG). This type of methane avoidance attribute, typically tracked in the realm of carbon credits, would have a home within Statement 3, subject to additional disclosure requirements. Companies evaluating RNG certificates should understand which claims belong in which statement.
Application to Other LCFs and Market-Based Instruments
While SAF and RNG are two of the more prominent examples, the AMI proposal is relevant to all LCFs including renewable diesel and marine fuels. The emissions associated with market-based instrument purchases for these fuels would belong in Statement 2.
The proposed framework may also cover market-based instruments aimed at lower emissions conventional fuels, e.g., natural gas production that has taken measures to reduce fugitive methane emissions far below industry averages. Companies purchasing certificates of this type would theoretically report the reduced upstream natural gas emissions rates in Statement 2, scope 3, category 3.
Three Steps Companies Can Take Now to Prepare
The AMI proposal is still in development. A public request for information on the initial white paper recently closed. A draft standard is in development, with a formal public consultation planned in Q3 2027. Companies that act early will be better positioned when the standard takes effect. Steps will vary depending on where in the fuels value chain an organization sits, but could include:
- Map exposure. Identify where the organization sits in the LCFs value chain and what fuels it is currently procuring and consuming. This will help to better understand where the largest fuels-related emissions hot spots are in the current GHG inventory.
- Record current instruments and assess quality. Catalog the instruments the company is currently producing or procuring. Understand where these instruments may sit within the AMI’s proposed four-statement framework and assess their quality against emerging eligibility criteria.
- Engage with the process. The GHG Protocol is still defining eligibility and quality criteria for LCF instruments. Organizations can monitor interim developments from the AMI Technical Working Group. Companies with active programs have a real stake in how those criteria are written.
Frequently Asked Questions
How would the AMI proposal change the way low-carbon fuels get reported?
The core shift is the introduction of Statement 2, a new market-based GHG inventory. For the first time, companies would be able to report the lower emissions from purchasing market-based LCF instruments, including book-and-claim and mass balance EACs, within a GHG Protocol-aligned inventory. This applies to all LCFs, including SAF and RNG, and can be reflected in scope 1 or scope 3 inventories depending on where the organization sits in the LCF value chain.
Is the AMI proposal finalized, and what should companies do now?
No, the proposal is still in development. A public request for information on the initial white paper recently closed. A draft standard is in development, with a formal public consultation planned in Q3 2027. In the meantime, companies holding SAF, RNG, or other LCF instruments should map their exposure across the value chain, catalog existing instruments against the proposed four-statement framework, assess quality against emerging eligibility criteria, and monitor GHG Protocol AMI updates.
What should a company look for when evaluating a SAF or RNG certificate?
Buyers should confirm which claim a certificate actually conveys and where it would sit in the AMI’s proposed framework. For example, a lower-emissions carbon intensity claim belongs in Statement 2 whereas an avoided-methane claim falls under Statement 3. Buyers should also assess the instrument against the AMI's emerging eligibility and quality criteria to reduce the risk that a purchase won't qualify under the final standard. Relae (formerly Carbon Direct) has published a comprehensive set of criteria for high-quality low-carbon fuels that buyers can use as a starting point, until AMI’s eligibility and quality criteria are finalized.
Environmental Markets
Relae guides buyers, investors, producers, and project developers through the market instruments designed to mitigate environmental impacts. Our work combines science-based quality criteria, project-level diligence, market and policy intelligence, and commercial execution to help you make defensible decisions, capture green premiums, and finance the clean energy transition.
Criteria for High-Quality Low Carbon Fuels



Joe Willenborg

Joe Willenborg

Joe has an interdisciplinary background based in science and engineering, and is applying his professional and academic experience to help promote industrial decarbonization. At Relae, Joe provides research and technical support to carbon reduction and removal projects, with a particular focus on low-carbon fuels.Prior to joining Relae, Joe worked as a Climate Advisory Consultant, partnering with organizations to quantify their GHG footprint, develop emissions reduction targets and strategies, and report on corporate climate programs. He has also spent time working in climate-related shareholder advocacy and supporting state and federal environmental programs.

Rohan Raman

Rohan Raman
Rohan Raman is a chemical engineer by training who brings a background in process engineering and industrial project execution to the evaluation of carbon management solutions. Before joining Relae, Rohan spent several years in the oil and gas industry in process engineering, project engineering, and business planning roles supporting refining, chemicals, and low-carbon technology initiatives. Additionally, he supported deployment of various large scale capital projects, helping develop project design specifications and start-up procedures.
At Relae, Rohan applies his engineering and project delivery background to help clients evaluate carbon removal and reduction projects for procurement. He conducts technical assessments of hybrid carbon management projects to help clients understand project quality, technical risk, and delivery likelihood. Rohan also supports project assurance work, partnering with project developers to identify and address technical and operational risks that could affect a project's ability to be built successfully and deliver on its carbon claims.
Every Climate Action Counts: GHG Protocol's AMI Proposal Explained
What to Read Next
Low-Carbon Fuel Certification: How Market Rules Shape the Value of a Fuel
Key Takeaways
- The revenue stack for a given fuel is set by the rules that govern the market for low-carbon fuels: regulations, certification schemes, certificate registries, and corporate accounting frameworks.
- Regulators and buyers reward characteristics beyond regulatory eligibility and carbon intensity, such as reportability, broader sustainability, and advanced technology.
- Relae helps producers with commercial strategy relating to feedstock, production pathway, and certification, which impact access to markets.
The Route to Market Is a Strategic Choice
Low-carbon fuels (LCFs), such as sustainable aviation fuel (SAF) and renewable natural gas (RNG), will cost more to make than their fossil equivalents for the foreseeable future. Projects narrow that gap through some combination of regulatory-market value, sales of environmental attribute certificates (EACs) to voluntary buyers, and financial incentives such as the 45Z Clean Fuel Production Credit.
Regulatory programs are pulling investment into new facilities and novel production routes, and voluntary reporting frameworks are moving toward allowing companies to count fuel certificates in their emissions inventories. What the revenue stack for a given fuel looks like is set by the rules that govern the market for LCFs: regulations, certification schemes, certificate registries, and corporate accounting frameworks.
In voluntary markets, the certification scheme, certificate registry, and reporting framework determine the official carbon intensity (CI) of the fuel, the number of certificates generated, and how buyers can use them to make claims.
In regulatory programs across Europe and North America, the rules determine how the fuel is classified, and whether its feedstock receives premium value, is capped, or is excluded altogether. Producers who understand how their market entry decisions impact value will be better positioned now and going forward.
What Is Carbon Intensity?
A fuel’s CI measures the life cycle greenhouse gas emissions per unit of fuel, usually expressed in grams of carbon dioxide-equivalent per megajoule (gCO2e/MJ). It covers feedstock production, conversion, transport, and use. Each program defines its own methodology for calculating it, which is why the same batch of fuel can carry a different CI depending on which program’s rules apply.
EACs Carry a Fuel’s Value to Market
An LCF EAC records characteristics of a batch of fuel separately from the fuel itself, such as whether it qualifies for a given program, the CI, or its feedstock. The certificate can travel with the fuel (bundled) or be sold on its own (unbundled):
Bundled EACs
In most regulatory markets, an obligated party purchases the fuel and its certificate together. These buyers are mainly fuel suppliers, as under the California Low Carbon Fuel Standard (LCFS), and airlines, as under the EU Emissions Trading System and the Carbon Offsetting and Reduction Scheme for International Aviation (CORSIA). They need both the physical fuel and the EAC that proves the fuel is eligible.
Unbundled EACs (Book-and-Claim)
Often in the voluntary market, the fuel is consumed wherever it can be delivered. The EAC is sold separately to whoever wants to claim its attributes, a system called book-and-claim. This matters because most companies have no control over the fuel burned in their supply chains: a company that ships freight cannot choose the fuel its carriers use, but it can buy EACs with a certified CI and claim the associated emissions reduction.
In both markets, the characteristics the EAC carries determine the regulatory and voluntary value in a fuel’s revenue stack.
Three Layers of Rules Determine the Value of an EAC
An LCF producer chooses the feedstock, production pathway, and markets to sell into. How those choices translate to the value of a fuel’s EAC is determined by three layers of rules that govern the LCF market (Table 1).
Table 1. The three layers of rules that set an LCF EAC’s value. Examples are illustrative and not exhaustive. ISCC = International Sustainability and Carbon Certification; RSB = Roundtable on Sustainable Biomaterials; SAFc = sustainable aviation fuel certificate; RED III = Renewable Energy Directive; GHG = greenhouse gas; SABA = Sustainable Aviation Buyers Alliance. Source: Relae.
Where the Rules Disagree: Three Feedstock and Pathway Examples
The result is that the same batch of fuel can carry a different CI, or a different classification, depending on which rules it is subject to. Three examples below demonstrate how production pathway decisions can impact a fuel’s value:
- Manure-based RNG ⇨ avoided emissions. The three layers treat avoided emissions differently. At the regulatory program and voluntary standard layer, ISCC PLUS follows the EU Renewable Energy Directive (RED III) in crediting methane emissions avoided through improved manure management, but CORSIA does not. At the registry and accounting layer, the Greenhouse Gas (GHG) Protocol’s draft Action and Market Instruments (AMI) Standard and the AIM Platform have proposed separating avoided emissions from a fuel’s direct life cycle emissions and reporting the two on different statements, and whether negative CI values from avoided emissions are accepted at all depends on the registry where the EACs are listed.
- Crop-based feedstocks ⇨ indirect land use change (iLUC). Regulators don’t agree on how to incorporate iLUC, either. Under the LCFS, modeled iLUC emissions for all crop-based fuels are positive. Under CORSIA, they can be positive or negative. Under RED III, iLUC is excluded from the CI, though separate rules restrict feedstocks deemed high-risk for iLUC. And because modeling and assumptions keep evolving, iLUC values are also subject to change over time.
- Synthetic fuel ⇨ e-SAF mandates. Regulatory programs also differ on what counts as a given category of fuel. ReFuelEU Aviation and the UK SAF Mandate both reserve a share of their mandates for e-SAF, but define it differently. The EU requires the fuel to qualify as a renewable fuel of non-biological origin (RFNBO). The UK sets its own power-to-liquid criteria, including which electricity sources it accepts. The same e-SAF can therefore count toward one sub-mandate and not the other.
Beyond Eligibility: EAC Characteristics the Market Rewards
In regulatory markets, an EAC’s value depends first on whether the fuel is eligible and how it is classified. In voluntary markets, value depends on the fuel’s CI and the number of certificates issued. Both regulators and voluntary buyers also reward characteristics beyond that baseline, and those characteristics can impact a fuel’s revenue stack:
- Voluntary reportability. The value of an EAC depends on how a buyer can report it, today and in the future. The GHG Protocol is still finalizing its rules for fuel certificates and what a buyer can claim. Certificates that fit cleanly within those rules may command a premium.
- Breadth of sustainability criteria. Some buyers screen EACs against criteria beyond emissions savings. The Sustainable Aviation Buyers Alliance (SABA) explicitly prefers advanced feedstocks and certification schemes with stronger social and environmental safeguards. Regulations set a minimum bar, but voluntary markets have no single standard for a high-quality EAC. The Relae Criteria for High-Quality Low Carbon Fuels consolidate these characteristics into one framework, and can show producers how their fuel and certification choices measure up against it.
- Advanced feedstocks and technologies. Fuel from novel pathways typically costs more than fuel from established ones, and some buyers are willing to pay that premium: early buyers want to support technologies that need offtake to reach commercial scale, and others want to diversify supply ahead of expected constraints on hydroprocessed esters and fatty acids (HEFA) SAF.¹ Regulators reward the same pathways directly through e-SAF sub-mandates and financial incentives, such as the UK Revenue Certainty Mechanism.
Where Should Producers Start?
How each program treats a feedstock, how each methodology calculates CI, and what each set of buyers will pay for are inputs to the feedstock, production pathway, and offtake decisions themselves. Once those decisions are made and contracts are signed, the route to market is largely fixed. Producers should weigh the routes open to them against three questions before committing:
- How will my feedstock, production pathway, and certification affect access to markets?
- How do I position my product within overlapping voluntary and regulatory markets?
- Who are my buyers and what do they require or prefer?
A sound strategy must consider the complex interactions between voluntary and regulatory markets, certification schemes and registries, and buyer preferences.
The landscape continues to evolve, with new national certification programs and regulations for LCFs emerging across the globe and accounting frameworks shifting. The policy experts, scientists, engineers, and economists at Relae help producers understand how each certification route affects the value of their fuel in the markets they want to enter, choose feedstocks and pathways with that in mind, and make sure the claims behind their EACs are high-quality and hold up to buyer and registry scrutiny as the rules evolve.
Frequently Asked Questions
What is the difference between a bundled and an unbundled EAC?
A bundled EAC is sold with the physical fuel, usually to an obligated party under a regulatory program such as the LCFS or ReFuelEU Aviation. An unbundled EAC is sold separately from the fuel through book-and-claim, so a buyer can claim its attributes without taking delivery of or consuming the fuel.
What is the difference between a regulation, a certification scheme, a registry, and a corporate accounting framework?
A regulation or voluntary standard sets the CI methodology and decides whether certain feedstocks are rewarded, capped, or excluded. A certification scheme verifies that a batch of fuel meets that methodology. A registry issues and tracks the certificates and can apply additional rules on CI, while corporate accounting frameworks determine what a voluntary buyer can claim.
Why can the same fuel have more than one carbon intensity?
Each regulatory program and voluntary standard sets its own CI methodology, and registries can add rules of their own. Manure-based RNG is one example: RED III and ISCC PLUS credit avoided methane emissions, CORSIA does not, and some registries cap CI at zero. The same batch can therefore carry different CIs depending on where it is certified and what market it is sold into.
How does carbon intensity affect LCFS credits?
Under the LCFS, the number of credits a fuel generates depends on how far its certified CI falls below the program’s fossil fuel benchmark for that year. Credit price is set by the market, so a lower CI increases the credits a producer has to sell, and the program’s rules decide the CI of the fuel.
The New Nasdaq Issuance Calendar Advances Transparency in the Carbon Removal Market
Key Takeaways
- The Nasdaq Carbon Issuance Calendar, a new data platform, provides carbon removal buyers and suppliers with standardized information on future offtake availability, indicative pricing, and project maturity. The platform was developed in collaboration with Relae, formerly Carbon Direct.
- The Carbon Issuance Calendar addresses the fragmentation and transparency problems of the voluntary carbon market by centralizing standardized project data and embedding our scientific diligence framework, built over 900 project reviews, giving buyers delivery-risk insight that no registry or marketplace offers today.
- The Carbon Issuance Calendar is an important early step, not the whole journey: it shows buyers what durable tonnes exist and allows them to compare projects with apples-to-apples data.
- Buyers can move from the Carbon Issuance Calendar into technical diligence, contracting, and project assurance with Relae’s advisory team. Suppliers can register to connect with buyers who are ready to engage.
Carbon Removal Project Data Has a Visibility Problem
If you're sourcing durable carbon removal credits, you may run into a familiar wall: project data scattered across dozens of developer websites, presented in inconsistent formats, with no easy way to compare one project against another. If you're a project developer, you face the mirror image of that problem: fielding individual requests for proposals, with no central place to showcase your available tonnes.
Get this wrong, and buyers may end up counting on carbon removal that never shows up - the delivery risk bugbear.
Between 2022 and 2024, high-durability engineered carbon removal made up just 2 percent of all carbon credit issuances. They remain in short supply, particularly the high-quality supply corporate buyers need. The gap is set to widen: our 2026 State of the Voluntary Carbon Market report found that more than 80% of the 2030 high-durability carbon removal projects are at risk of stalling and failing without additional offtake and financing commitments.
The Nasdaq Carbon Issuance Calendar, developed by Nasdaq in collaboration with Relae, offers an important first step toward addressing this information gap.
What Is the Nasdaq Carbon Issuance Calendar?
The Carbon Issuance Calendar is a centralized, accessible dashboard where carbon removal buyers and suppliers view standardized project data: future credit availability, indicative pricing, and project delivery status, all in one place.
The Nasdaq Carbon Issuance Calendar combines structured, developer-provided project data with project maturity assessment informed by Relae’s assessment framework and technical diligence. This helps users understand future CDR availability, indicative pricing, and potential project delivery risk through a single platform.
This expertise didn't appear overnight. It comes from sitting across the table with developers, stress-testing their science, mapping their delivery timelines against reality, and helping them show up to buyers as credible partners. The result is a track record that gives the framework embedded in the Carbon Issuance Calendar its depth. It's a starting point, built for buyers and suppliers to find each other on the basis of consistent, comparable information, using international class financial and information infrastructure.
How Buyers Should Use the Nasdaq Carbon Issuance Calendar
Today, if you're trying to procure durable carbon removal credits, you have no single place to start. You have to visit individual developer sites, request information through scattered channels, and compare projects that present data in entirely different formats before diligence has even begun. In many cases, you are comparing apples to oranges - different kinds of CDR projects with different durabilities, risks, and overall quality.
The Carbon Issuance Calendar provides a central starting point. You can view future credit availability, compare indicative pricing across projects, and begin assessing options without contacting each supplier one by one.
More importantly, the Carbon Issuance Calendar frames the data. Our scientists developed a delivery-oriented lens, built from reviewing over 900 carbon removal projects, drawing on the same rigor behind our Criteria for High-Quality Carbon Dioxide Removal, which we develop annually with Microsoft.
How Suppliers Reach Buyers Through the Carbon Issuance Calendar
If you're a project developer, the Nasdaq Carbon Issuance Calendar tackles visibility, one of the most persistent barriers to market access. You can list available tonnes, display indicative pricing, and reach a global audience of corporate and financial buyers at no cost.
The timing matters. Many first-of-a-kind engineered carbon removal projects are preparing to break ground and need bankable offtake agreements to secure financing before they can do so (a key aspect of CDR 2.0). Our analysis of approximately 140 high-durability carbon removal project developers found scale-up plans for 30 million tonnes of supply per year. Reaching that potential will take real demand: committed forward offtake, increased project equity investment, and access to lending.
Register now: you'll be positioned to connect to buyers actively looking to engage.
How Does the Carbon Issuance Calendar Differ From a Carbon Credit Registry or Carbon Removal Marketplace?
The Carbon Issuance Calendar solves a distinct, early-stage problem. It gives buyers and suppliers a centralized place to find each other and compare options against standardized information, something neither a registry nor a marketplace is built to do.
For a closer look at how registries differ and what you should weigh when navigating them, read our Navigating Carbon Credit Registries report.
Scientific Diligence Turns Visibility Into Confidence
Standardized data tells you what exists. Scientific diligence tells you what's worth pursuing.
Relae’s scientists do that work every day. Our experts apply rigorous pathway-specific criteria to live projects, evaluating delivery risk and status, and identifying where questions remain is the core of what we bring to the carbon removal market.
The Carbon Issuance Calendar puts an accessible version of that expertise at the top of the procurement funnel. It’s for everyone in the market - you don't need to be a carbon removal scientist to use it. This snapshot allows you to compare projects against each other, giving you a meaningful starting point before deeper diligence begins.
Want to go deeper on a specific project? Relae’s technical diligence team picks up right where the Carbon Issuance Calendar leaves off.
What Carbon Removal Projects Are on the Carbon Issuance Calendar Today?
The Carbon Issuance Calendar currently features engineered and hybrid carbon removal projects: direct air capture, biochar, enhanced rock weathering, and bioenergy with carbon capture and storage. These high-durability pathways offer permanence on the order of hundreds to thousands of years.
Many of these projects are at an inflection point: they’re ready to scale but dependent on committed offtake to unlock financing. The Calendar serves their needs, and the buyer’s needs, together.
Nature-based carbon removals have their own criteria and market dynamics. They may appear in a separate segment of the Carbon Issuance Calendar down the line.
From the Carbon Issuance Calendar to Completed Carbon Removal Procurement
If you're building or refining a carbon removal procurement strategy, the Carbon Issuance Calendar is the right place to start.
From there, you can choose to work with the Relae advisory team to support every later stage: technical diligence on specific projects, contracting and negotiation support, ongoing project assurance, and access to curated carbon credit sourcing. The Carbon Issuance Calendar surfaces the market; we help you navigate it, connecting you with the right developers, on the right terms, with the scientific confidence to move forward.
Moving from commitment to delivery takes structural change across the market, too—our CDR 2.0 white paper lays out the five pillars we see as essential to getting engineered and hybrid carbon removal projects built and delivering.
CORSIA Phase 1: Credits, Compliance, and What Comes Next
Key Takeaways
- CORSIA, the program intended to address international aviation emissions, is currently the world’s largest international compliance carbon market, with approximately 200 million tonnes of eligible emissions units (EEUs) expected to be retired for Phase 1 (2024-2026) compliance.
- Airlines have already begun retiring significant volumes of credits (clean cookstoves and jurisdictional REDD+) toward their Phase 1 obligations ahead of the January 2028 compliance deadline, signaling that the industry is treating CORSIA as a binding policy mandate.
- In addition to the four already approved, a record 25 carbon standards have applied for eligibility to supply credits under Phase 2 (2027–2035), pointing to a diversifying pipeline of credits.
- Legal enforcement of CORSIA at the national level remains uneven. A handful of jurisdictions, including the EU, Japan, Brazil, New Zealand, and Canada, have established compliance regimes, but it is unclear whether other major aviation markets will implement domestic enforcement requirements by 2027.
- As CORSIA matures alongside other compliance and voluntary frameworks, strategic engagement increasingly depends on understanding where eligibility overlaps and where the most value can be found.
Introduction to CORSIA
The Carbon Offsetting and Reduction Scheme for International Aviation (CORSIA) was established and is managed by the International Civil Aviation Organization (ICAO)—a specialized agency of the UN—and provides a compliance mechanism to reduce emissions from international aviation that do not fall within a single country’s contributions to the Paris Agreement. For years, CORSIA generated more commentary than activity—airlines weren’t required to offset a single tonne of CO2 emissions (tCO2) during the pilot phase (2021–2023). That is changing; in early 2026, Singapore Airlines and Japan Airlines retired significant volumes of carbon credits against their Phase 1 (2024–2026) obligations. Increasing authorization announcements showcase the eligible supply steadily entering the market, and 25 carbon standards have applied for Phase 2 (2027–2035) eligibility. As CORSIA becomes an active compliance market, this article explains how the program works, what is driving the current trends, and what to watch as Phase 1 draws to a close.
Who is Covered by CORSIA Phase 1 and Phase 2?
Because emissions from international aviation are not tied to any individual nation, the International Civil Aviation Organization (ICAO) adopted CORSIA in 2016 to complement the Paris Agreement framework and address these emissions. CORSIA applies to international airlines operating flights registered between participating countries.
- During Phase 1, offsetting obligations apply only to routes between the 130 countries that have voluntarily opted in.
- From Phase 2, participation becomes mandatory for all 193 ICAO member states, except for those below the aviation activity threshold or classified as Least Developed Countries, Small Island Developing States, or Landlocked Developing Countries—although they can voluntarily participate.
Several major aviation markets, including China, that are not participating in Phase 1 will be required to do so from 2027.
Offsetting Obligations
Airlines are required to offset the portion of their emissions that exceeds the program’s baseline on routes subject to offsetting. The key input is the annual Sectoral Growth Factor (SGF), which reflects how much annual emissions on covered routes have grown above the baseline (set at 85% of 2019 emissions). In simple terms, each airline's offsetting obligation is calculated by multiplying its CORSIA-regulated emissions by the SGF.
For example, an airline that emits 1 million tCO2 on covered routes in a year when the SGF is 10%, would have an offsetting obligation of 100,000 tCO2. An airline that emits 500,000 tCO2 in the same year would have an obligation of 50,000 tCO2. The actual 2024 SGF was 15.4%, exceeding the baseline and triggering offsetting obligations for the first time since the COVID-induced reduction in international aviation activity.
Beginning in 2033, CORSIA’s offsetting formula combined the SGF with an individual component that accounts for each airline's own emissions growth. The individual weighting starts at 15% in 2033 (with an SGF weighting of 85%) and rises to 45% by 2035 (SGF 55%). This progressively ties each airline’s obligations to its own emissions trajectory rather than sector-wide trends alone.
Airlines can also reduce their obligations by reporting the use of CORSIA Eligible Fuel (CEF). In order to qualify as CEF, Sustainable Aviation Fuel (SAF) must meet ICAO’s certification criteria. Offsetting remains a lower-cost option than sustainable fuel procurement, and CORSIA obligations are currently not influential drivers of CEF/SAF uptake compared to supply mandates, such as ReFuelEU Aviation. However, these dynamics will evolve as CORSIA matures and SAF prices continue to fall.
CORSIA Eligible Carbon Credits: Phase 1 and Phase 2
To determine the eligibility of carbon crediting standards and credits issued under those standards, ICAO's Technical Advisory Body (TAB) reviews applications and recommends approval to the ICAO Council, subject to restrictions on methodologies, vintages, and more granular project elements. Currently, no standard is approved without exclusions. Credits eligible for use under CORSIA are known as Eligible Emissions Units (EEUs).
TAB broadly excludes some project types across standards, including large-scale grid-connected renewable energy projects and most project-level REDD+ activities. The exclusions reflect TAB's assessments of baselines, safeguards, and quantification gaps. However, these assessments are not static; ICAO updates its determinations as the evidence base improves. For example, in 2025, TAB approved certain direct air capture (DAC) and biochar pathways for the first time.
A record 25 carbon standards—certifying projects from emissions avoidance to engineered carbon dioxide removal (CDR)—have applied for Phase 2 eligibility in the 2026 assessment cycle, reflecting the scale of the opportunity. The International Air Transportation Association (IATA) projected a demand of 170–236 million EEUs for Phase 1 alone; developers are eager to serve this growing market. Assessment results are expected in October 2026.
Article 6 and Corresponding Adjustments
The biggest bottleneck for eligible supply has been requirements relating to Article 6.2 of the Paris Agreement. CORSIA requires that EEUs carry a host country Letter of Authorization (LoA) confirming that the host country will not count the underlying mitigation toward its Nationally Determined Contribution (NDC). This prevents double counting between CORSIA and national emission inventories, but it also means eligible supply depends on host country authorization, not just meeting methodological requirements. Authorized credits are called Internationally Transferred Mitigation Outcomes (ITMOs).
To manage the risk that a host country fails to apply the promised corresponding adjustment, projects must secure legally enforceable insurance policies that either provide replacement EEUs or funds to secure them. Several providers have been approved to insure EEUs registered by Gold Standard and Verra.
Insurance requirements do not apply when the host country has already confirmed the corresponding adjustments in its mandatory Paris Agreement reporting. For example, in March 2026, Madagascar submitted a Biennial Transparency Report (BTR) and annual information report that reflect the application of corresponding adjustments to CORSIA-eligible clean cookstoves credits listed on the Verra registry. According to Verra, BTR accounting is the “highest level of assurance” that ITMOs will not be double counted.
The Enforcement Challenge
With the authorization bottleneck loosening, market attention is turning to demand. Critically, ICAO has no direct enforcement power; for CORSIA to work, participating countries must pass laws requiring airlines to comply with its requirements. Under CORSIA rules, airlines must retire their Phase 1 EEUs by January 2028, but most are not yet subject to legal sanctions for failing to comply. Where regulations do exist, it remains unclear whether penalties will be stringent enough to matter, or whether they will be enforced at all.
Where legal enforcement of offsetting requirements does exist, it varies by design. For example, in Brazil, failure to comply attracts a penalty of BRL 50/tCO2 (US$10/tCO2) and an administrative fine. Meanwhile, the Canadian Aviation Regulations impose administrative fines capped at CAD 25,000 (US$18,000) per infraction, but there is no specific fine for each tCO2 not offset. However, the absence of a statutory penalty framework does not necessarily mean compliance will not be enforced. For example, New Zealand manages CORSIA participation through an administrative Memorandum of Understanding with Air New Zealand, rather than a dedicated legal regime (though this will change from 2027). Similar informal arrangements may be more common than the legislative record suggests.
According to 2024 data, US-based airlines account for around 15% of CORSIA-covered emissions. However, there is no indication that the federal government will implement CORSIA penalties under the current administration. It is unclear how non-compliance by a major economy will impact market confidence or enforcement by other governments, but uncertainty about US participation in multilateral climate programs is not new.
What to Watch
- Global enforcement: As Phase 2 approaches, the prospects for CORSIA enforcement in key aviation markets will become clearer. China, which has not participated in the voluntary phase and has raised objections to CORSIA’s design on grounds of fairness, presents an uncertain picture for domestic transposition. The UK government has consulted on a draft legal amendment that would penalise non-compliance for UK airlines at £100/tCO2 (US$130/tCO2), but has not published updates since February 2025.
- EU Emissions Trading Scheme (ETS) update: In July 2026, the European Commission proposed to expand the ETS to address emissions from flights departing the European Economic Area (EEA) to destinations within 5,000 km. To avoid double charging emissions also regulated under CORSIA, the Commission proposed to deduct CORSIA costs from airlines’ ETS obligations. While the Commission flagged concern about the stringency of CORSIA eligibility criteria, the proposed rules would not impact demand for Phase 1 EEUs. Still, it is worth watching for future restrictions on which credits EU airlines can use for CORSIA, whether in Phase 1 or 2.
- Supply financing vehicles: The LEAF Coalition—which purchases credits verified under the CORSIA-eligible ART TREES standard—has signed over US$1.5 billion worth of purchase agreements with host countries. The Forest Carbon Partnership Facility (FCPF) and BioCarbon Fund Initiative for Sustainable Forest Landscapes (ISFL), both CORSIA-approved for Phase 1 in early 2026, have built jurisdictional REDD+ pipelines across dozens of countries. As projects mature, it will be worth watching how issued credits are marketed across compliance and voluntary channels.
Strategic Considerations
Avoided emissions credits dominate early CORSIA supply—and consequently demand—principally from avoided deforestation and clean cooking projects. As there is no regulatory premium for higher-cost CDR, this is not surprising. But as the market matures and supply diversifies, airlines are likely to begin differentiating on geography, co-benefits, and environmental performance. Corporate interest is growing in projects that abate non-CO2 superpollutants, due to their outsized near-term climate impact. As many of these projects are based in countries actively issuing LoAs, this may soon translate into a supply of superpollutant EEUs. Some airlines are reluctant to procure aggressively now, anticipating the upcoming availability of higher-quality credits.
Credits that hold value across multiple frameworks could carry a strategic premium. A credit also eligible for Singapore's carbon tax, Switzerland's CO2 Act, or SBTi claims may offer more durable demand than one tied to a single use case. While specific requirements vary significantly, we are beginning to see convergence around broad principles, such as the need for Article 6 authorization for credits used in compliance markets tied to NDCs. Procurement and project development strategies could begin to favour credits that confer wider market optionality.
The precondition for all of this is policy stability. Longer-term offtake agreements, portfolio strategies, and meaningful investment in project development depend on confidence that CORSIA rules will hold. Efforts to soften emissions regulations in response to energy price shocks are now testing this confidence, from proposed changes to soften the EU ETS to Singapore's deferral of its SAF levy. Tracking price signals, enforcement developments, and authorization trends will be essential for identifying firm demand and where the opportunities lie.
Conclusion
Effective engagement with CORSIA requires more than developing quality projects. It means understanding methodological eligibility requirements, navigating Article 6.2 authorization processes, tracking a network of overlapping national regulations, and staying ahead of a rapidly evolving market landscape. Relae (formerly Carbon Direct) brings together policy, market, and scientific expertise to help clients on all of these fronts.
Frequently Asked Questions
Which carbon credits can airlines use for CORSIA compliance?
CORSIA Eligible Emissions Units (EEUs) must be issued by crediting standards approved by ICAO's Technical Advisory Body. Every approved standard currently has exclusions on certain methodologies and project types, so eligibility is granular rather than blanket. EEUs must also have a host country Letter of Authorization confirming a corresponding adjustment under Article 6.2 of the Paris Agreement.
Is CORSIA actually enforceable?
In all phases, CORSIA obligations are legally binding when a country writes them into domestic law. Countries participating in Phase 1 are expected to do this, but not all have, and enforcement remains uncertain in several key aviation markets (e.g., the United States). Even where enforcement exists, penalty regimes vary significantly in stringency and design.
How does the July 2026 EU ETS proposal affect CORSIA?
The European Commission's proposal to expand ETS coverage to more flights does not reduce demand for CORSIA credits. While it would lead to overlap between flights covered under CORSIA and the ETS, as proposed, airlines could have CORSIA costs effectively deducted from their ETS allowance obligations. However, the Commission has signalled continued scrutiny of CORSIA's effectiveness, which could shape future limits on the credits EU airlines are allowed to use.
Independent Project Assurance Is Likely Your Best-Returning Spend
Key Takeaways
- The decision to fund a project is determined by a holistic review of project development maturity. This applies across capital-intensive projects, including low-carbon power generation, carbon capture and storage (CCS) solutions, sustainable aviation fuel (SAF), and broader transition infrastructure build-out. Both technical and commercial workstreams must be developed in parallel to avoid project failure.
- Early scope decisions, such as site selection, core technology selection, and nameplate capacity, are cheap to make but become exponentially disruptive and costly to reverse.
- Independent challenge and verification is tangible evidence of a disciplined, well-managed capital development process.
Bridging the Gap from Announcement to Delivery
Among project developers, a perception often persists: seeking external review signals a project in distress. In capital budgeting discussions, subjecting engineering scope and commercial assumptions to third-party interrogation can be misconstrued as a vote of no confidence in the primary delivery team.
In reality, the reverse is true. Across complex infrastructure, independent challenge is the disciplined stage-gate practice that protects capital by reconciling technical reality with commercial terms before designs are locked.
Independent Challenge Is a Sign of Strength, Not Doubt
Across capital projects, and in particular within emerging low-carbon industrial infrastructure, the gap between announced projects and delivered assets remains stark. Data from the Mission Possible Partnership’s Global Project Tracker reveals that fewer than 17% of announced commercial-scale clean industrial facilities worldwide have reached Final Investment Decision (FID) or commercial operations, leaving more than 800 major decarbonization projects stalled in front-end development.
The causes of developmental paralysis are multifaceted. While macroeconomic interest rate shifts and global supply chain disruptions sit largely outside a developer's control, project definition and developmental discipline remain entirely manageable. Even amid external volatility, a project designed with resilience will have a far greater likelihood of success.
Independent review and assurance directly strengthen a project’s chance of success and overall value. Large global project delivery organizations have applied this discipline for decades by deploying independent teams to evaluate project readiness at every stage gate. For teams lacking a dedicated internal oversight organization, or those deploying first-of-a-kind facilities, third-party independent review provides the necessary rigor to facilitate project success.
Relae’s (formerly Carbon Direct) work with Stockholm Exergi is a clear example: independent assurance helped build funder and regulator confidence in a first-of-a-kind carbon removal facility with no direct precedent to benchmark against.
Why Projects Stall Between Announcement and FID
Low-carbon infrastructure and net-zero industrial projects carry unique risks compared to the repeat delivery of established designs. Exciting new developments run a higher risk of falling victim to optimism bias or compressing development timelines to meet public announcement milestones.
It is a natural human tendency for project champions to focus on the upside during early development. However, early momentum must be balanced with processes that reintroduce industrial lessons, supply-chain realities, and operational resilience.
Front-End Loading (FEL) is a well-evidenced approach for improving capital project outcomes. Decades of benchmarking by Independent Project Analysis (IPA) show that approximately two-thirds of industrial megaprojects suffer capital cost overruns or schedule slippage of 25% or more, or encounter severe operational problems lasting more than two years post-startup. This pattern is repeating in low-carbon infrastructure: IPA’s analysis of 12 completed low-carbon projects found average cost escalation of 31% and schedule slip of almost 50%. Rigorous front-end definition remains the single strongest predictor of whether a project will achieve its cost and schedule targets.
As highlighted in the CDR 2.0: Five Pillars of Successful Project Deployment and Delivery report published by Relae, projects falter when developers push ahead without stress-testing the full delivery framework. Stage gate reviews are the mechanisms that evaluate the total project concept and underlying business case. They are most effective when executed as independent cold-eye evaluations prior to each funding gate, identifying and mitigating vulnerabilities long before final investment decisions are reached.
What Funders Need to See at Each Gate
Different stages of project development rely on distinct capital sources, each requiring specific proof points before deploying funds.
Before FEED Funding: Justifying the Engineering Spend
Front-End Engineering Design (FEED) is a major financial commitment, typically costing between 2% and 4% of total project capital cost. The funders backing this stage are usually the developer’s own balance sheet equity, strategic partners, or public grant programs. Before allocating millions of dollars to detailed engineering, these funders need confidence on the fundamentals:
- A technically sound process concept, confirmed utility balances, and an energy integration scheme that fits the site.
- Secured site control, clear zoning pathways, and no environmental fatal flaws that could derail permitting.
- Documented availability of required feedstocks, water and power, paired with demonstrable interest from target off-takers.
Before FID: Proving Bankability and Commercial Closure
As a project approaches FID, the funding audience shifts to conservative commercial lenders, infrastructure funds, and binding offtake counterparties. These capital providers are not underwriting strategic vision; they are underwriting long-term operational cash flows and debt service. Depending on the project and financing structure, capital providers may require:
- A high-confidence capital cost estimate (AACE Class 2 or Class 3) backed by frozen Piping and Instrumentation Diagrams (P&IDs), firm equipment quotes, and a realistic execution schedule with clear critical paths.
- Bankable engineering, procurement, and construction (EPC) structures that clearly allocate risk, include performance guarantees and enforceable liquidated damages.
- Fully executed, binding offtake and feedstock agreements, along with non-appealable permits and completed utility interconnection agreements, with remaining conditions clearly understood.
- An objective, third-party challenge review that assesses operational viability and distinguishes an executable engineering plan from an aspirational concept.
Commercial and Technical Co-Development: The Stage-Gate Method in Practice
A project rarely fails because of an isolated mechanical issue or a purely commercial misstep; failure happens when technical decisions and commercial terms are negotiated in silos and decisions are made without understanding of the wider implications.
We see this disconnect play out in several ways, including:
- Sizing capacity before testing market demand: An engineering team may size a facility to maximize thermodynamic efficiency and economies of scale, only for the commercial team to discover buyers will only commit to half that volume. The developer is left with an oversized, unbankable design requiring fundamental rework.
- Setting product specifications before negotiating offtake: Process engineers frequently design systems around standard vendor packages. However, when downstream transport, processing, or storage networks enforce strict purity standards, the facility faces costly equipment redesigns. This issue has materialized directly within European CCS networks. Open-access offshore storage operators, such as Norway's Northern Lights project, established strict cross-border CO2 specifications requiring tighter moisture and impurity thresholds than originally designed for.
- Locking Electrical Loads Prior to Interconnection Verification: As detailed in Relae’s analysis of physical infrastructure bottlenecks, scale is rarely constrained by capital availability; it is dictated by electrical transmission queues, substation headroom, and 24/7 firm power availability. Freezing electrical demand before verifying utility interconnection timelines risks stranding engineering work on an asset that cannot connect to the grid.
How Relae Stress Tests Projects at Each Gate
Independent reviews at each stage-gate improve success rates by stress-testing assumptions before presenting to lenders, infrastructure investors, or corporate buyers. Relae reviews projects across five categories using the TECOP framework:
- Technical: Verifying technology readiness levels (TRL), mass and energy balances, plot plan constructability, and operational availability under real-world conditions.
- Economic: Capex benchmarking, operating contingency adequacy, utility tariff sensitivities, and financial model cash-flow resilience.
- Commercial: Offtake agreement structures, feedstock contracts, contracting boundaries, EPC contract structures, and counterparty creditworthiness.
- Organizational: Owner's team capabilities, internal stage-gate governance, contractor oversight mechanisms, and execution capabilities.
- Political: Statutory permitting status, regulatory durability, carbon market policy exposure, and local community social license.
The TECOP framework is relevant for evaluating delivery risk across all project types, see more in Relae’s Criteria for High-Quality Carbon Dioxide Removal, Delivery Risk Appendix.
What makes this approach effective is sitting on both sides of the table. Having completed over 250 deep-dive technology reviews, 900+ project evaluations, and advised on more than $6 billion in industrial project finance, Relae has extensive experience evaluating the considerations important to institutional funders and buyers.
The Value of Early Independent Project AssuranceIncorporating independent review should be standard practice for modern infrastructure delivery. Because funders will perform their own rigorous diligence regardless, conducting an independent evaluation early enables developers to address vulnerabilities proactively and present a more resilient business case.
Commissioning an independent team for a cold-eye review during early project formation can be a cost-effective way to identify potential risks before they become expensive to address. Catching an unworkable process assumption, an oversized capacity plan, or a misaligned commercial interface during pre-FEED costs a tiny fraction of what it takes to fix those issues during construction
Ultimately, independent challenge is not an admission of doubt, but the disciplined stage-gate practice that protects capital by reconciling technical reality with commercial terms before designs are locked, signaling to partners, and your future funders that your project is built to deliver.
To dive deeper into the frameworks that support successful projects, read Relae's white paper: CDR 2.0: Five Pillars of Successful Project Deployment and Delivery and take a look at project assurance in action through our Stockholm Exergi Case Study.
Frequently Asked Questions
What is independent project assurance?
Independent project assurance is a structured review of a capital project by a team that sits outside the project’s delivery organization. Reviewers test the engineering scope, cost estimate, schedule, commercial agreements and permitting position against what funders will require at the next stage gate. The developer receives a clear list of gaps, risks and proposed mitigations prior to presenting the project to lenders, investors or buyers.
When should a developer commission an independent project review?
Periodically throughout the project development process - at a minimum before each major funding gate, but smaller reviews are also beneficial at earlier stages when key concept and technology decisions are being made. A review before Front-End Engineering Design (FEED) tests whether the process concept, site and supply of feedstock, water and power justify the engineering spend. A review before Final Investment Decision (FID) tests whether the cost estimate, EPC structure and binding agreements will satisfy lenders. Site, technology and capacity decisions are cheap to change in pre-FEED and expensive to reverse once detailed engineering starts.
What does an independent project review assess?
Relae structures its reviews around the TECOP framework, which covers five risk areas: technical (technology readiness, mass and energy balances, constructability), economic (capex benchmarking, contingency, financial model resilience), commercial (offtake, feedstock and EPC contracts), organizational (owner’s team capability and stage-gate governance) and political (permitting, regulatory durability and social license). Reviewers also check that technical and commercial decisions are aligned, because projects often fail where the two are developed in silos.
How does an independent project review differ from lender due diligence?
An independent project review applies a holistic approach identifying not only gaps, but also opportunities to add value and strengthen the business case. Lender and investor due diligence is often purely looking at risks and gaps, prior to committing capital. Lender diligence protects the funder and reports its findings at a point when changes are costly and can delay financial close. A developer-commissioned review takes place earlier, so the project team can fix weaknesses in scope, cost or contracts before funders see them.
Shifting Playbook for Corporate Power Procurement
Key Takeaways
- The Greenhouse Gas (GHG) Protocol’s proposed scope 2 revisions would shift many large power buyers from annual renewable energy certificate (REC) accounting to 24/7 hourly matching and reveal a larger emissions gap than most inventories currently report.
- Of all the US grid regions modeled, the emissions gap between annual and 24/7 hourly matching is widest in PJM Interconnection (PJM) and the Electric Reliability Council of Texas (ERCOT), the markets where data center load is growing fastest.
- Relae's modeling quantifies the shift from annual to 24/7 hourly matching: serving a 4-gigawatt (GW) data center load at 100% hourly carbon-free energy requires 9.6 GW of additional clean capacity in ERCOT and 10.5 GW in PJM, a roughly 800-megawatt premium in PJM that translates directly into cost and siting strategy.
- Closing that gap requires investments in clean, firm generation technologies, like natural gas with carbon capture and storage (CCS), battery storage, and geothermal. The optimal mix varies by market and load profile, which means modeling current and future emissions positions under 24/7 accounting to understand the best procurement options for a specific portfolio.
Annual REC Accounting No Longer Holds at Data Center Scale
For years, large corporate energy buyers have relied on a straightforward approach: purchase renewable energy certificates (RECs) or sign virtual power purchase agreements (VPPAs) to offset market-based scope 2 emissions. Under the current GHG Protocol guidance, these instruments allow companies to claim low or zero emissions regardless of when or where clean energy is actually generated. When corporate clean energy demand was modest, this fueled new renewable project development while aggregate grid emissions were trending down.
That approach worked, until now. Energy demand from data centers and hyperscalers is surging. The Federal Energy Regulatory Commission (FERC) reported more than 50 GW of data center capacity operating in the US at the end of 2025, much of it concentrated in regions where local clean generation cannot keep pace. When corporate clean energy demand was modest, the gap between contractual claims and physical generation was small enough that few questioned this argument. At hyperscaler levels, with load concentrated in a handful of grids, that gap is becoming too large to ignore.
From a climate perspective, well-designed renewable procurement has created real impact by channeling corporate capital into new clean generation, and reducing CO2 emissions anywhere to benefit the climate everywhere. From a grid perspective, power consumption and generation must balance in real time, and the flow of electricity is constrained by the physics of the transmission system. Some regulators, investors, and standard-setters argue that corporate clean energy claims should be grounded in this second, engineering perspective rather than the first. The GHG Protocol's proposed revisions reflect that view, and would force buyers to defend their claims against it.
Relae’s modeling of this 24/7 framework in PJM and ERCOT helps quantify its costs and emissions implications in the markets where the stakes are highest.
What Does 24/7 Hourly Matching Mean for Scope 2 Accounting?
The biggest proposed change to the GHG Protocol’s current Scope 2 Guidance is the move from annual power reporting and matching to a 24/7 approach. Instead of calculating emissions with an annual emissions factor (EF) based on their independent system operator (ISO) or eGRID region for each megawatt-hour (MWh) consumed, companies would need to use hourly-specific EFs.
Companies would still be able to retire RECs to reduce their market-based emissions. However, companies would need to show that these RECs came from clean energy that was generated on the same grid, in the same hour as their facilities consumed power. This makes annual, location-agnostic REC retirement, currently the dominant practice, insufficient for 24/7 market-based accounting.
Both the time restriction (hourly matching) and the location restriction (generation on the same grid as consumption) will make it more difficult for companies to retire RECs. For example, because today's methodology is location-agnostic, a New York-based company can retire RECs from a Texas wind farm (purchased unbundled or via a VPPA) to reduce its reported market-based scope 2 value. This has allowed renewable development to follow the best resource sites rather than the load. Similarly, the time of day that the wind farm generates energy is irrelevant, as long as it is approximately in the same calendar year.
Under the proposed revisions, retiring these RECs would no longer be acceptable for the New York company, since they would fail both location- and hourly-matching requirements. As a result, companies with large REC portfolios today may no longer be able to retire them in order to reduce their market-based scope 2 emissions, if the proposed revisions take effect. These companies may face significant unmatched consumption under 24/7 accounting, especially during evening peaks or grid stress events when fossil-based generation fills the gap.
Annual Matching vs 24/7 Hourly Matching
The figure below illustrates the gap between what a representative large buyer reports under the current annual location- and market-based methodologies, versus what an hourly 24/7 analysis reveals.
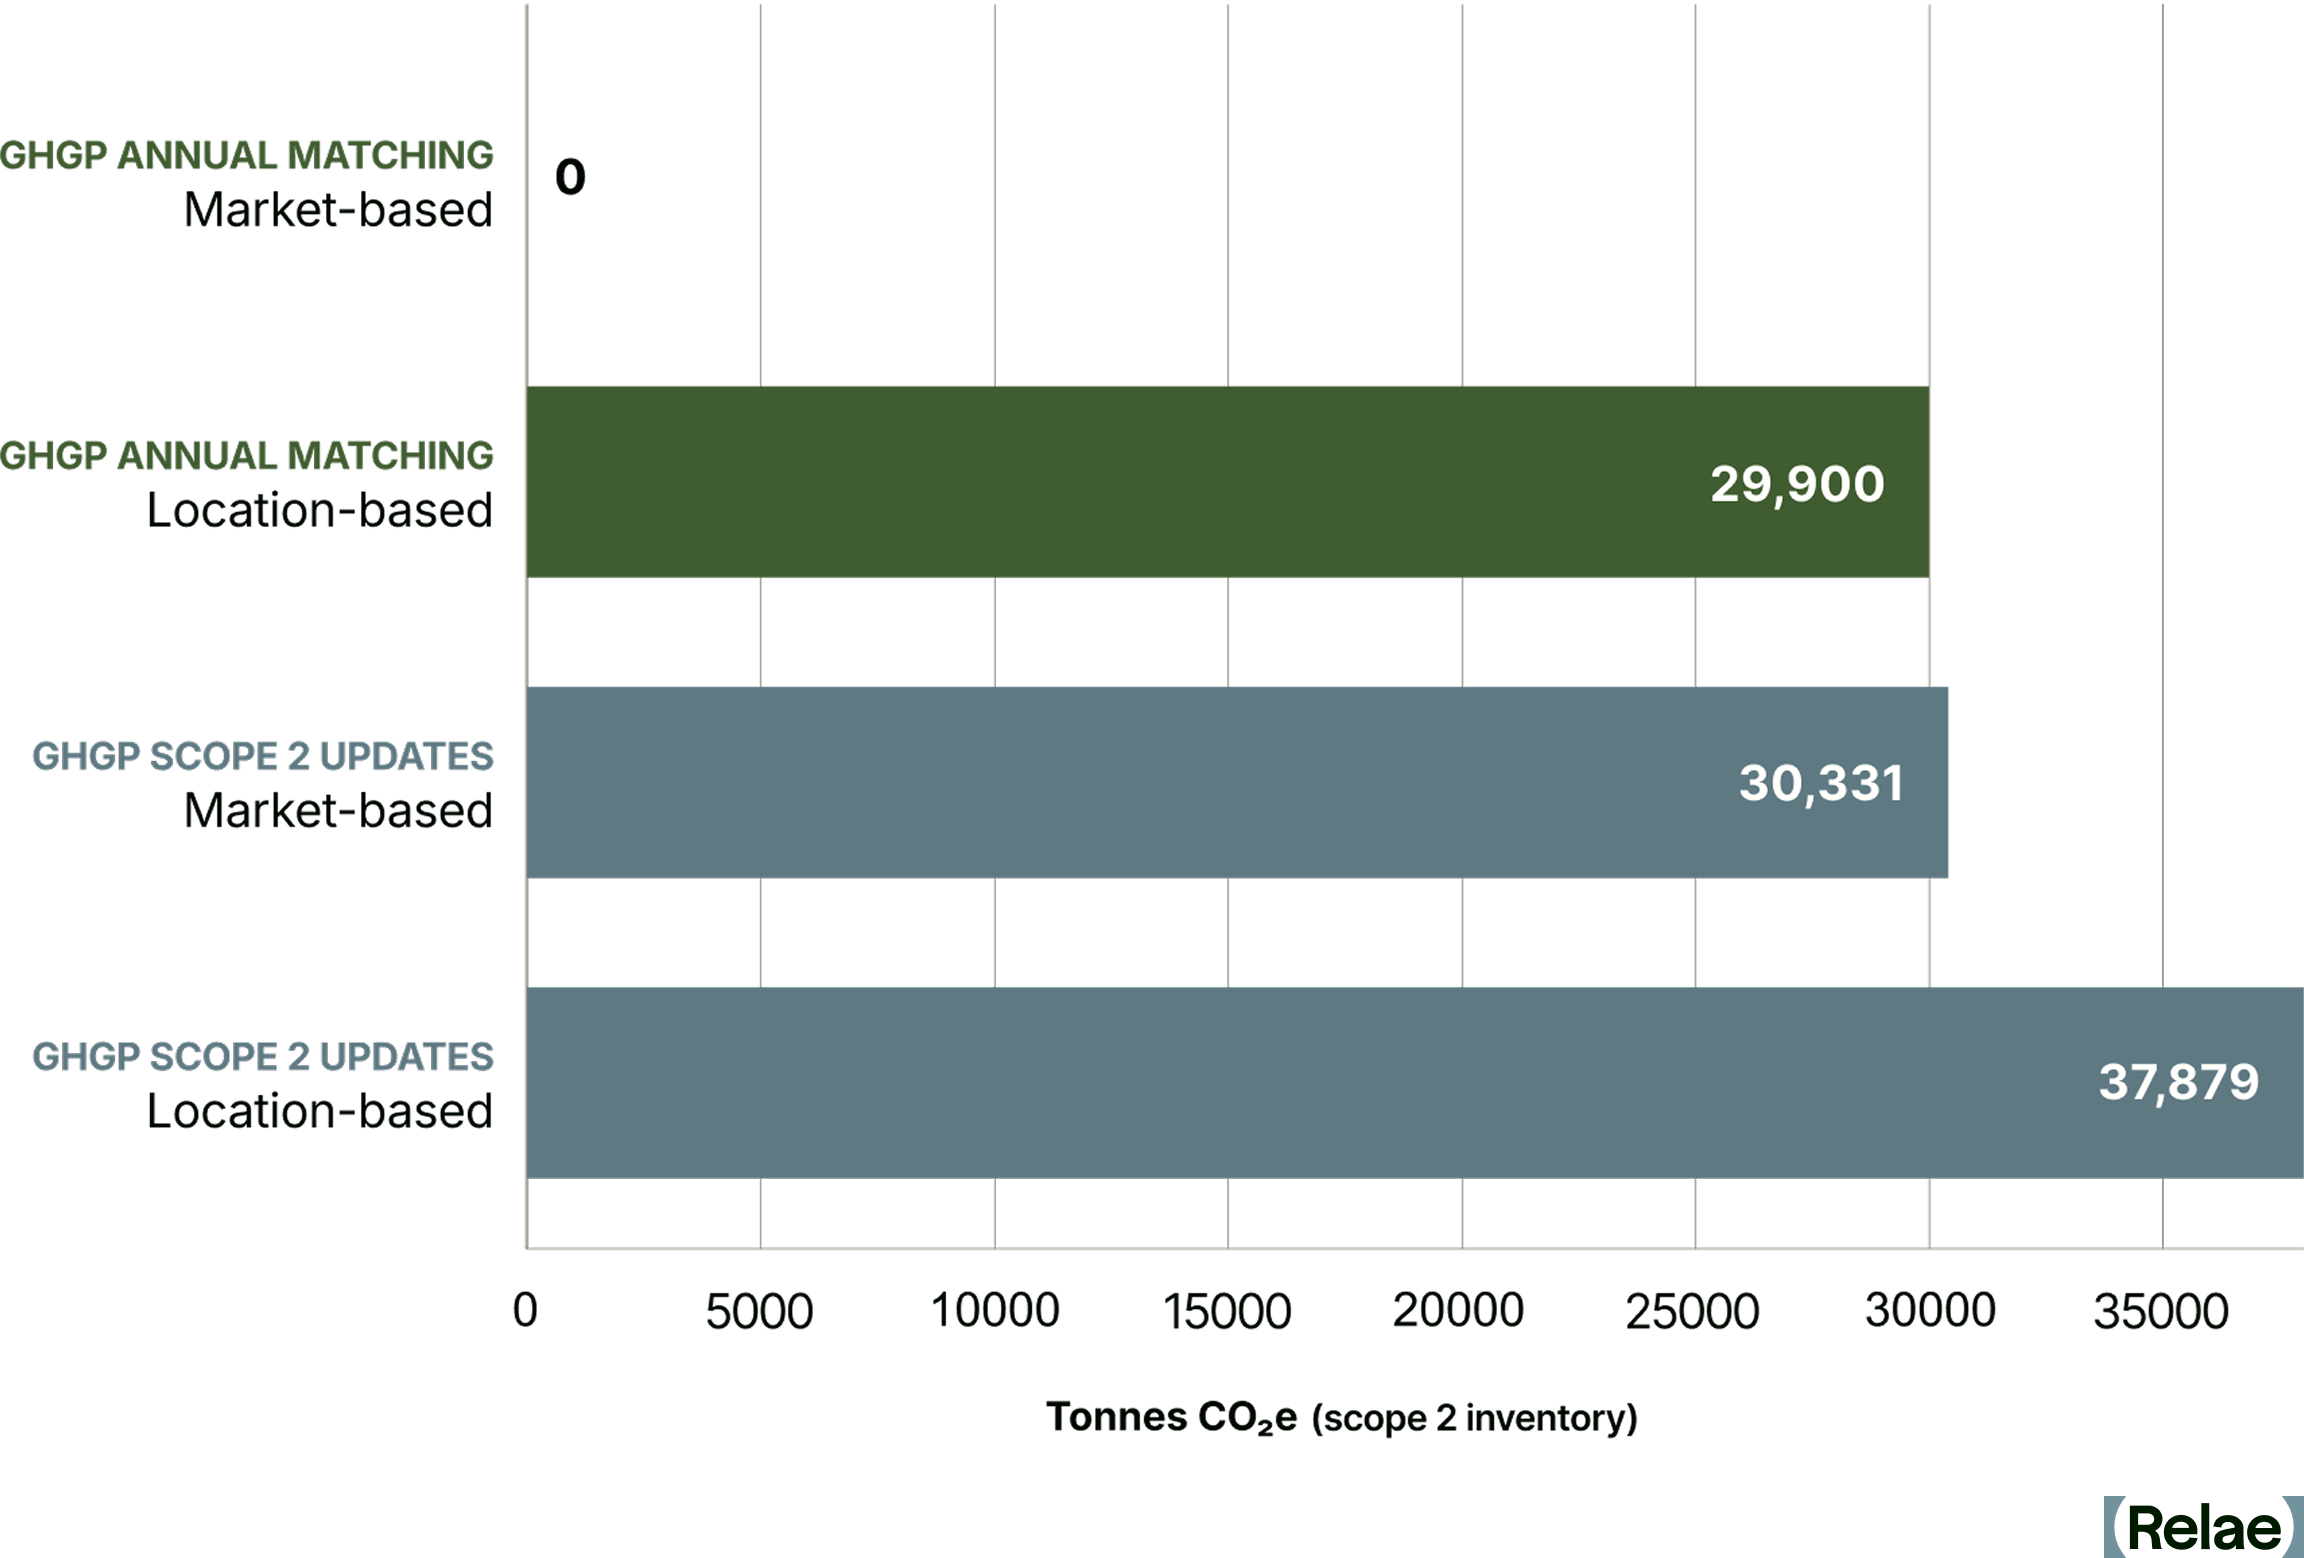
Understanding this emissions gap is the essential first step for buyers to make informed decisions about which instruments to retain, which contracts to renegotiate, and where new investment will matter most. If the proposed scope 2 revisions are enacted, companies procuring clean energy will be disincentivized from buying RECs sourced from variable renewables in distant locations, and instead will find it more favorable to invest in same-grid clean, firm generation, such as geothermal, nuclear, and renewables plus storage. RECs from these projects would qualify to be retired against market-based scope 2 emissions under the proposed revisions, where today's distant-wind or off-peak-solar RECs would not.
Where Pressure Is the Highest: ERCOT and PJM
Two markets stand out for projected hyperscaler load growth: PJM, which covers the extended mid-Atlantic region, and ERCOT in Texas. Both are on track to absorb massive increases in data center demand over the next decade, and both expose the limits of annual REC accounting in ways that will be hard to ignore under the new proposed framework.
PJM: 60% Fossil Generation Means High Marginal Emissions
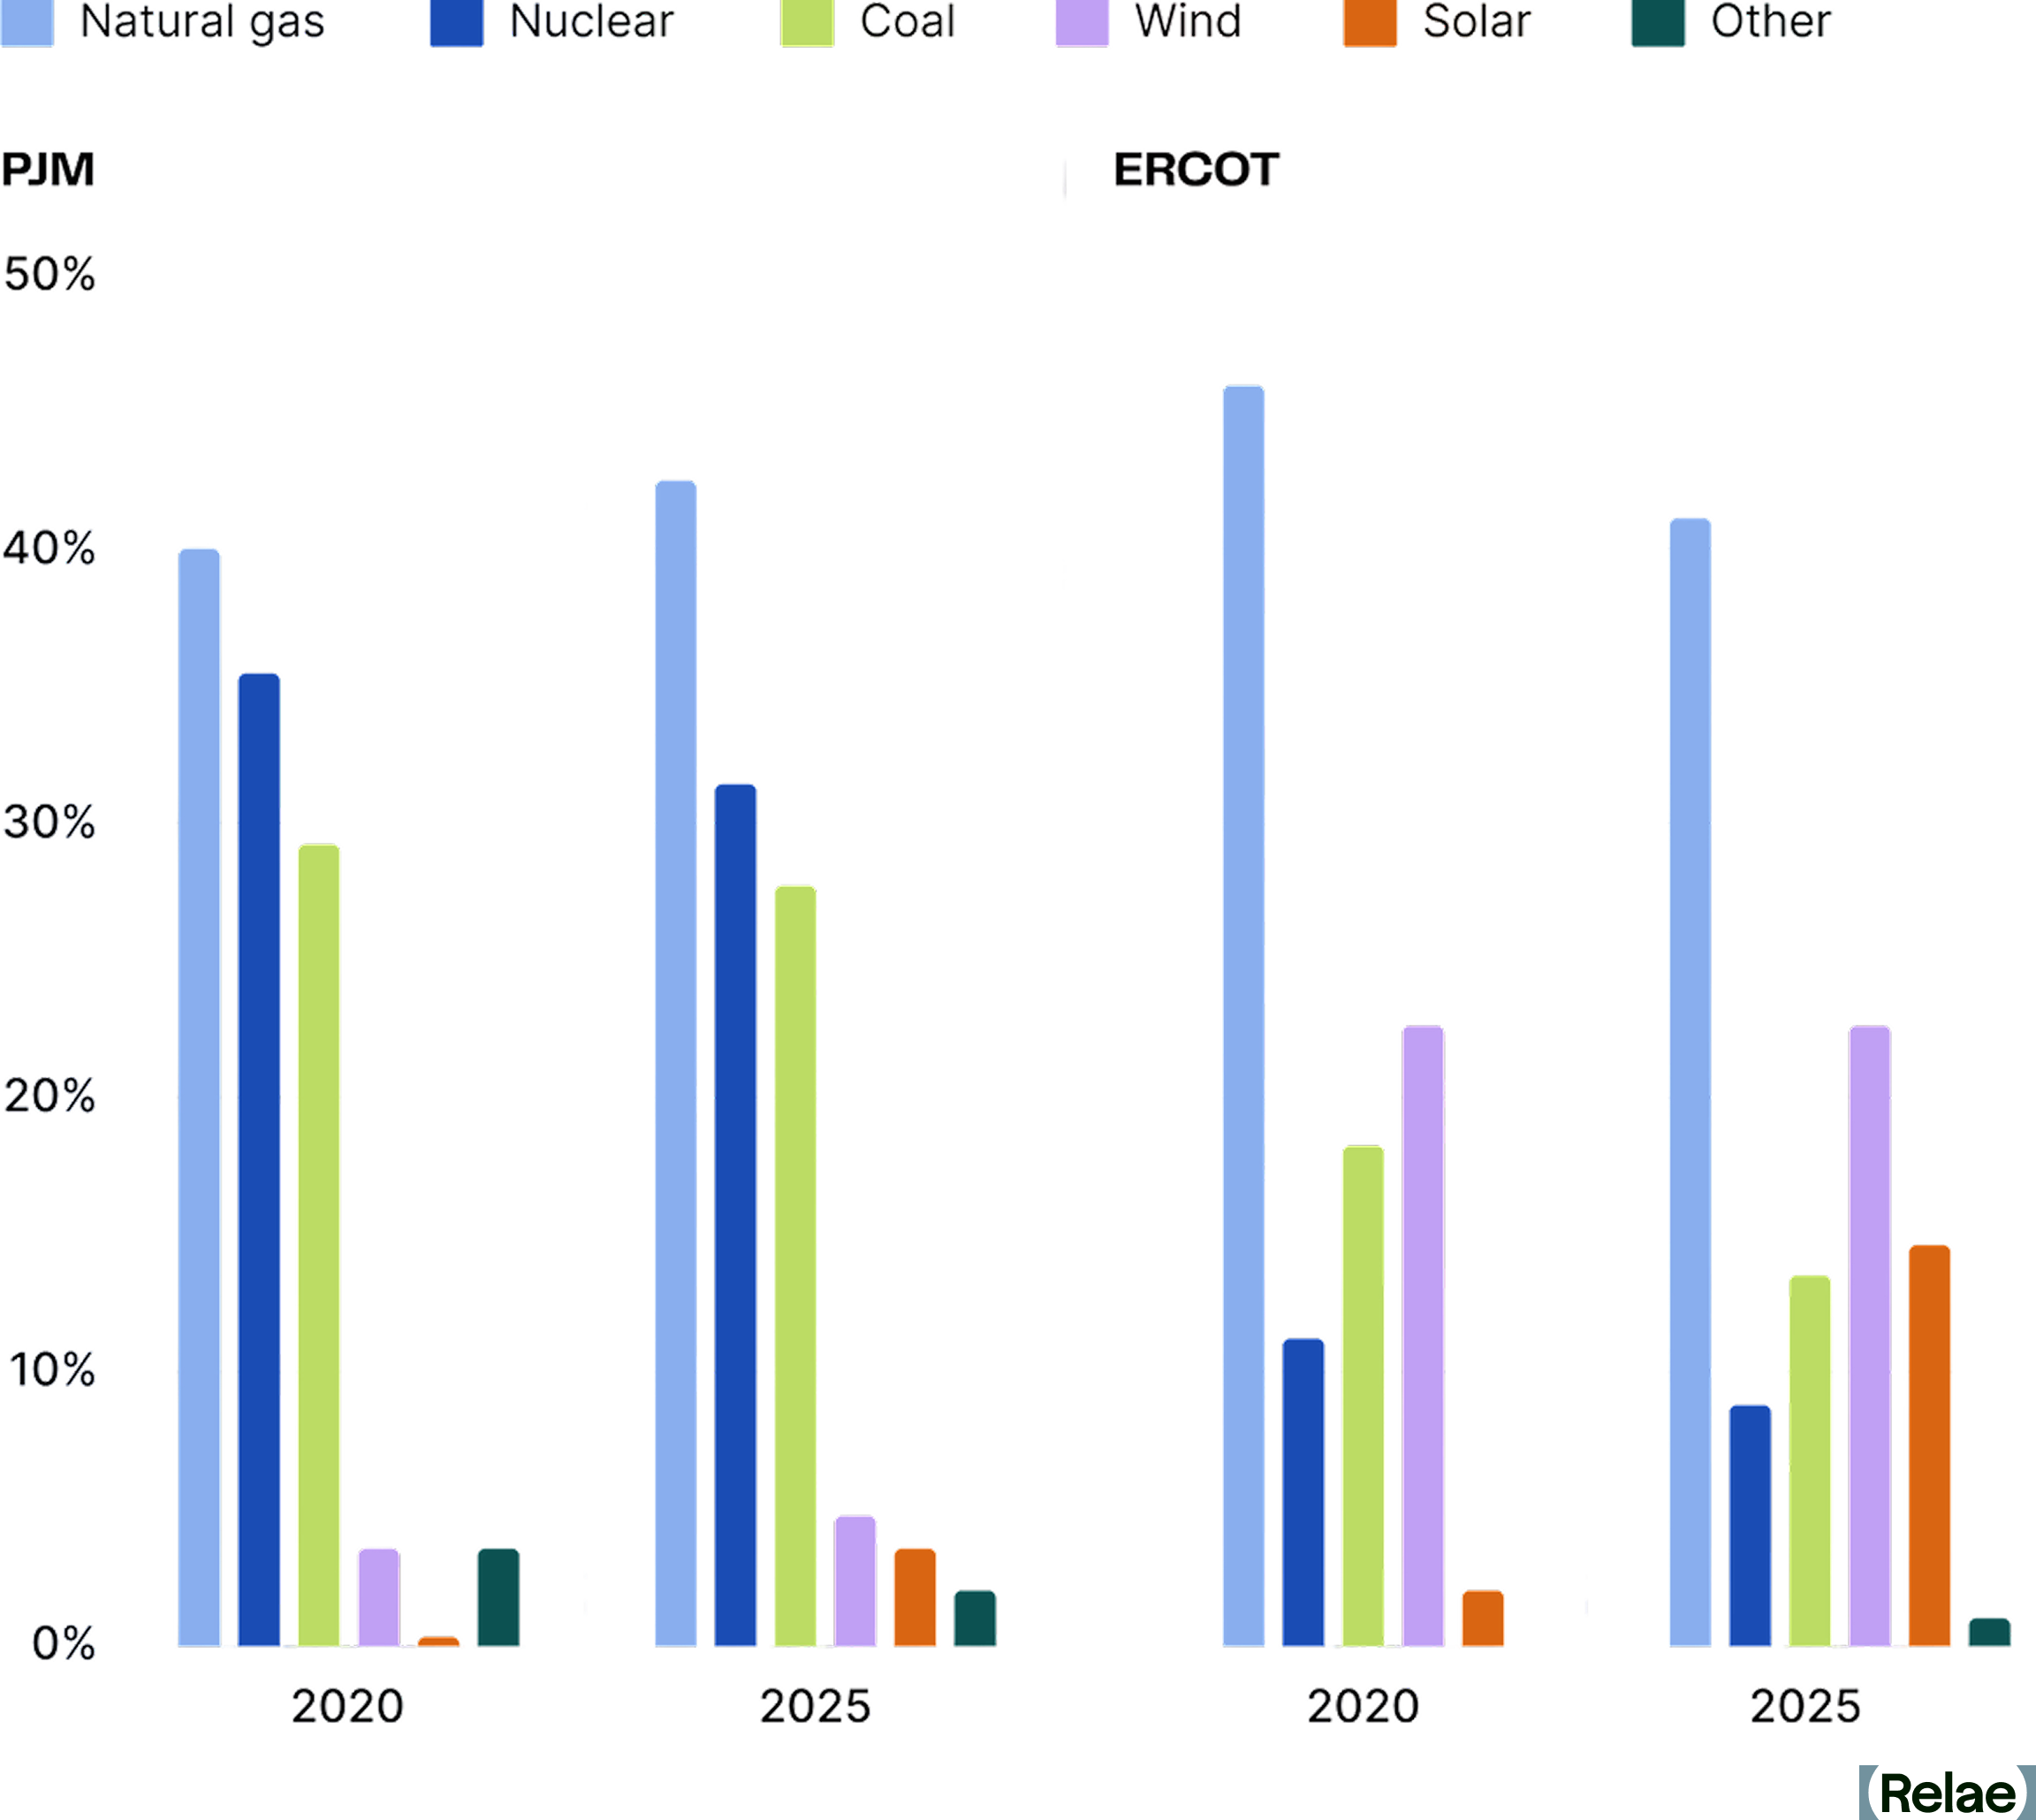
PJM is one of the largest and most complex wholesale electricity markets in the world. Its generation mix still includes 60% coal and natural gas, which means hourly emissions intensity remains high, particularly during evening peaks and grid stress events when fossil generation dominates the dispatch stack.
Buyers relying solely on annual REC retirement may show low market-based scope 2 emissions today, but a 24/7 analysis tells a different story. For PJM-based buyers, this means hourly matching gaps will be largest during evening and overnight hours, when nuclear and storage become disproportionately valuable relative to additional solar.
ERCOT: Solar and Wind Don’t Peak When Demand Does
Texas has abundant wind and solar, with solar generation growing nearly 7x since 2020, but those resources don’t always run when demand peaks. While fossil-based generation has declined since 2020, it still comprises more than half of ERCOT’s generation. Solar dominates midday, wind peaks in the evening, and natural gas fills the gaps, especially during high-demand evenings or extreme weather events.
Buyers with large ERCOT footprints may find that VPPA portfolios, which generate most of their clean energy in off-peak hours, already satisfy the proposed location-based test but fail on hourly matching. Battery storage and demand flexibility could help bridge the gap.
Figure 3 below quantifies that gap in both markets by showcasing the carbon-free energy (CFE) score in ERCOT and PJM, as well as the additional capacity required for a 4 GW load to achieve a 100% CFE target. The CFE score is the share of grid-supplied electricity in a given hour that comes from carbon-free sources, and is the metric the proposed scope 2 revisions would use to evaluate hourly matching. A 100% CFE target means electricity consumption is matched to carbon-free generation in every hour of the year.
In the left panel, a representation1 of each market's 2030 hours are sorted by grid (CFE) score, from the dirtiest hour on the left to the cleanest on the right. Neither grid approaches 100% carbon-free on its own, and the shaded areas represent the unmatched hours a buyer claiming 100% clean energy through annual instruments would actually carry under 24/7 accounting. The gap is the maximum unmatched hours a buyer might be exposed to, as some RECs procured through annual matching may qualify under the new rules, if satisfying the locational and hourly requirements.
The right panel translates that gap into action. The additional co-located clean generation and storage required to serve a representative 4 GW load (roughly 5% of the forecast 2030 C&I load in ERCOT and 4% in PJM) at a 100% hourly CFE target, on top of what the underlying grid already provides.
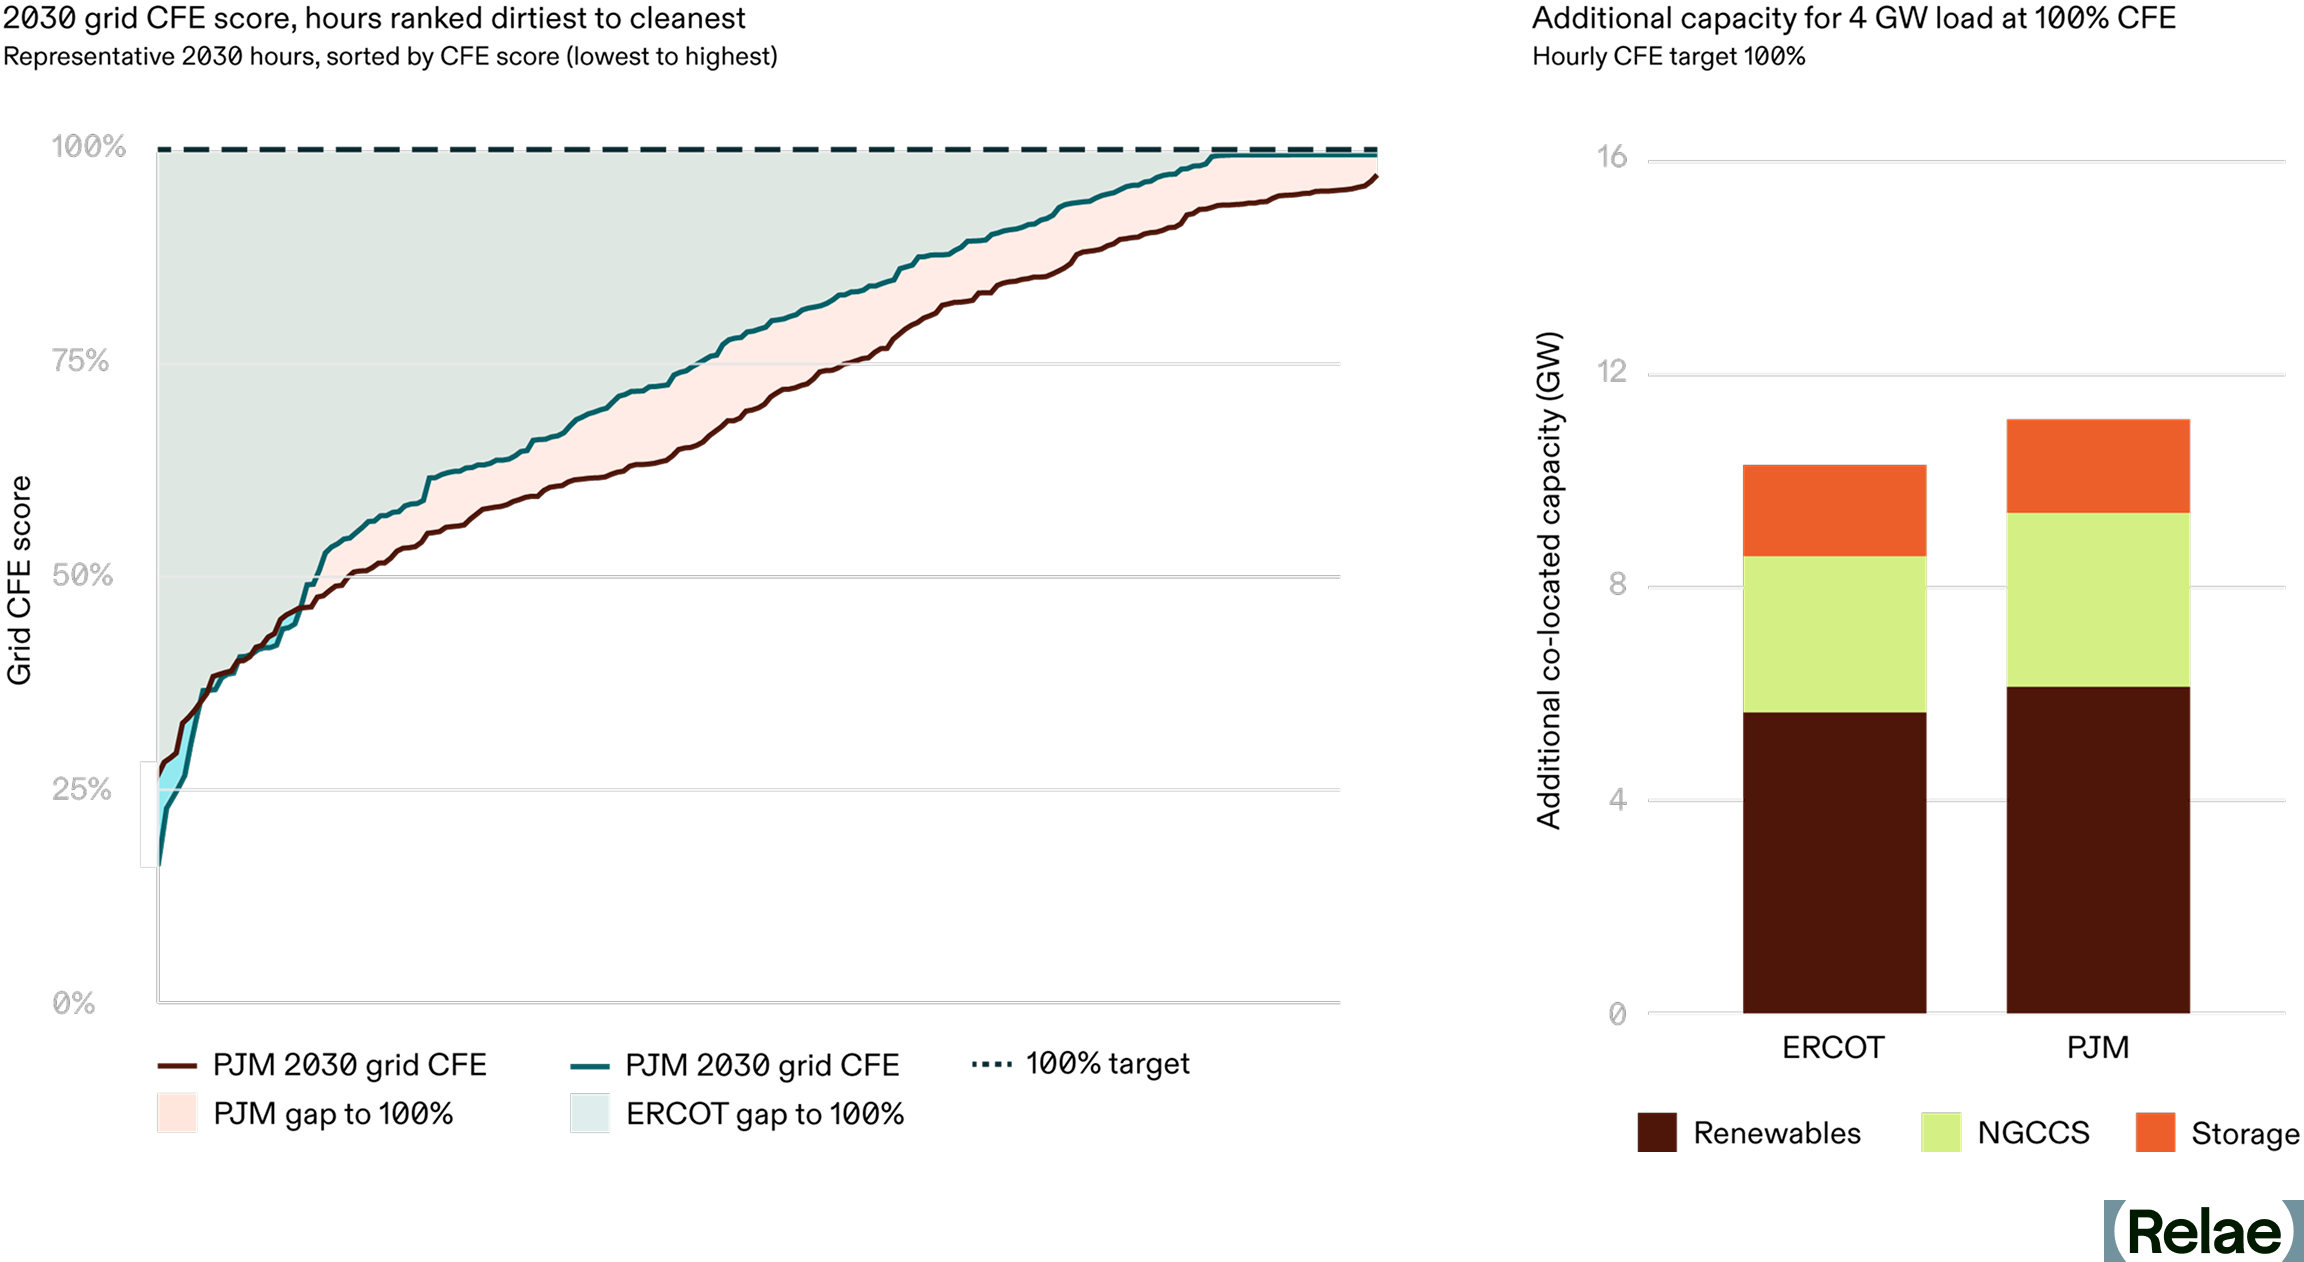
A few patterns are worth highlighting. First, the left panel confirms that PJM’s grid will still spend materially more hours below 100% carbon-free than ERCOT’s in 2030, a direct consequence of the coal- and gas-heavy generation mix described above. Notably, ERCOT's curve reaches 100% in a meaningful share of hours (windows when the grid is running entirely on carbon-free resources), while PJM's never does, meaning some fossil generation is dispatched in every hour.
Second, the ISO a buyer operates in drives a meaningful difference in build-out: hitting 100% hourly CFE for a 4 GW load takes 9.6 GW of additional capacity in ERCOT and closer to 10.5 GW in PJM. This indicates the advantage of achieving hourly and locational matching in already clean grids, which may influence a buyer choosing where to site new workloads.
Renewables have the largest share of the additional capacity in both markets (5-6 GW), paired with significant long-duration energy storage (~2 GW), while natural gas with CCS provides meaningful clean, firm capacity (~3 GW). ERCOT’s storage share of capacity is slightly larger, reflecting the midday-solar/evening-load mismatch, while PJM leans a bit more on natural gas with CCS, where clean, firm generation does more of the heavy lifting due to lower wind speeds and solar irradiance than Texas.
The right panel also illustrates why clean, firm technologies (natural gas with CCS, advanced nuclear, and enhanced geothermal) are likely to be included alongside renewables and batteries in any serious 24/7 portfolio. With only renewables and batteries, hitting the same target requires about double the total generation and storage capacity. In both markets, targets that look achievable today on an annual REC basis will require materially more capital and a different mix of resources, under 24/7 accounting.
Top Questions Large Power Buyers Need to Model Before the Rules Change
The GHG Protocol revisions are not finalized, and the timing of any mandate remains uncertain, which is exactly why modeling cannot wait.
A useful self-test for any large power buyer is: can your team answer the following today with defensible numbers?
- What is your hourly CFE score across your largest load centers, and how far does it sit from your reported market-based emissions?
- Which of your existing VPPAs and REC contracts hold value under 24/7 accounting, and which become effectively stranded?
- What mix of resources delivers the incremental clean, firm capacity that closes your gap in PJM, ERCOT, or wherever your load is concentrated at the lowest cost?
- If your next gigawatt of load were sited in a different ISO, how would your emissions position change?
Clean firm projects do not appear off the shelf. Advanced nuclear, enhanced geothermal, and natural gas with CCS all carry multi-year development timelines, and corporate offtake agreements are often what get these projects financed in the first place. Buyers who engage now help shape the project pipeline that will be available in their target markets in 2030, and can lock in offtake terms before competition for the most valuable sites tightens. Buyers who wait until the methodology is final will be working with shorter lead times, fewer development partners, and less leverage to specify projects that fit their load profiles and hourly matching needs.
Frequently Asked Questions
What is 24/7 hourly matching, and how does it differ from today's REC accounting?
Today's scope 2 accounting lets companies retire renewable energy certificates (RECs) from any grid, at any time of year, to offset their emissions. The GHG Protocol's proposed 24/7 hourly matching would require RECs to come from clean generation on the same grid, in the same hour a facility consumes power, making most of today's location-agnostic RECs ineligible for market-based accounting.
Why are PJM and ERCOT under the most pressure from this shift?
Both markets are absorbing the fastest-growing data center load in the country, and both still lean on fossil generation to meet demand outside peak renewable hours. PJM's generation mix is 60% coal and gas, while ERCOT's solar and wind often don't peak when demand does, so buyers in these markets face the largest gaps between their annual REC claims and their actual hourly carbon-free energy score.
How much additional clean capacity does it take to close the gap?
Relae's modeling finds that serving a 4 GW data center load at 100% hourly carbon-free energy requires 9.6 GW of additional clean capacity in ERCOT and 10.5 GW in PJM. That capacity mix leans on renewables and long-duration storage in both markets, with natural gas with CCS playing a larger role in PJM, where wind and solar resources are weaker.
What should power buyers do before the GHG Protocol revisions are finalized?
Start modeling now. Buyers should know their hourly carbon-free energy score, understand which existing VPPAs and REC contracts hold value under 24/7 accounting, and identify the lowest-cost mix of clean, firm resources that closes their gap. Clean firm projects like advanced nuclear, enhanced geothermal, and natural gas with CCS take years to develop, so buyers who engage early have more influence over the project pipeline and better offtake terms.
Modeling the 24/7 Emissions Gap with Relae
For large power buyers assessing what the proposed GHG Protocol revisions mean for their power procurement portfolio, Relae's Advanced Power Emissions Analysis solution models the gap between current market-based reporting and what 24/7 accounting would reveal—by market, load profile, and technology stack.
The 2026 Criteria: Designing and Delivering High-Quality Carbon Removal
Key Takeaways
- High-quality carbon dioxide removal (CDR) projects require robust project management and oversight to deliver credits on time and at the promised volume; delivery risk is a distinct concern that quality standards alone don't catch.
- The sixth edition of the Criteria for High-Quality Carbon Dioxide Removal is the first to provide an approach to evaluating both credit quality and delivery risk, adding a new delivery risk appendix built around the TECOP framework: technical, economic, commercial, organizational, and political risk.
- The 2026 Criteria provides a framework for developers, investors, and buyers to evaluate both project quality and delivery risk.
- This year's update draws on 170 new diligence reports from 2025 and the input of more than 60 subject matter experts, building on a foundation of six years of lessons from professional diligence across hundreds of real-world CDR projects.
The Criteria Create a Shared Standard for Credit Quality
Relae (formerly Carbon Direct) first launched the Criteria for High-Quality Carbon Dioxide Removal (the Criteria) in collaboration with Microsoft in 2021 to help rapidly and justly scale the development of high-quality carbon dioxide removal (CDR) credits. The market didn't yet have a shared definition of what "high-quality" meant, so we laid out transparent, science-based benchmarks that gave developers, investors, and buyers a common foundation to work from. Every year since, we have gone back and sharpened those benchmarks so that they keep pace with the quickly evolving industry.
But a shared definition of quality doesn't guarantee the delivery of credits as planned. The 2026 edition is the first to tackle that gap directly, pairing the Criteria's quality benchmarks with a new framework for evaluating delivery risk.
The Six Principles of High-Quality Carbon Removal
The Criteria defines six science-based principles that apply across engineered, hybrid, and nature-based CDR approaches:
- Social harms, benefits, and environmental justice: The extent to which the project prevents new social harms to people and communities, reduces existing harms, and provides meaningful benefits distribution.
- Environmental harms and benefits: The extent to which the project minimizes and mitigates environmental harms, as well as provides environmental benefits.
- Additionality and baselines: The evidence that the project’s carbon removal would not have occurred without carbon finance.
- Measurement, monitoring, reporting, and verification (MMRV): The ability to accurately quantify carbon removal in a repeatable and verifiable way, and to develop a plan for long-term monitoring of the project.
- Durability: The likelihood that removed carbon remains stored over time, with mechanisms in place to mitigate reversal risk.
- Leakage: The extent to which project activities cause increased emissions elsewhere.
These principles provide a consistent foundation for carbon removal procurement, evaluation, and project benchmarking.
[cta]
Supporting the Delivery of High-Quality CDR Credits
"Projects must work better operationally and be more commercial. Quality and delivery risk shape a project's risk profile at every point in its life, and this edition of the Criteria is the first to give buyers a way to judge both at once." Dr. Julio Friedmann, Chief Scientist, Relae
Designing projects to meet high-quality CDR criteria is only part of the challenge. Effective project planning, management, and execution are also essential to ensure that high-quality CDR tonnes successfully reach the market as planned. As discussed in CDR 2.0: Five Pillars of Successful Project Deployment and Delivery, managing delivery risk requires developers, investors, and buyers to understand the risks that can affect project success and align on how these risks are assessed and mitigated.
To support this alignment, the 2026 Criteria introduced a new Delivery Risk Appendix, which establishes a common framework and language for identifying and evaluating key delivery risks for the first time. Drawing on our broader observations of the carbon removal market and established approaches to project risk management, the appendix highlights common delivery risks across two broad CDR project types: open systems and closed systems. It organizes these risks into five categories: technical, economic, commercial, organizational, and political factors, also known as the TECOP framework.
The TECOP Framework for CDR Delivery Risk
- Technical delivery risks are associated with the technical feasibility of the project design, implementation, and long-term operation of the project
- Economic delivery risks are associated with the project’s financing structure, financial modeling assumptions, and expenditure profile
- Commercial delivery risk reflects the extent to which a project's purchase agreements, supply arrangements, and key contractual relationships are secured or well-advanced.
- Organizational delivery risks center on the project developer's capacity and capability to successfully plan, execute, and manage a project of the appropriate size and complexity.
- Political delivery risks are associated with governance, policies, and potential changes in regulatory environments, as well as the local communities’ perception of and willingness to participate in projects.
New Additions to the 2026 Criteria
Since publishing the 2025 Criteria, Relae has conducted an additional 170 diligence reports across established and emerging CDR pathways, ranging from reforestation and enhanced rock weathering (ERW) to direct air capture (DAC). To date, less than 10% of all 900+ projects the team has reviewed have met the bar for high-quality. These diligence efforts, together with insights from market analysis and ongoing synthesis of the latest scientific and technical literature, have deepened our understanding of how CDR project quality has evolved over the past year.
The 2026 Criteria leverage these insights and the expertise of more than 60 subject matter experts to reflect advances across the CDR industry and address key weaknesses that remain in the market across all pathways.
A few of the most significant updates to the Criteria include:
Addition of Direct Counterparty Considerations: Direct counterparties are the organizations that developers partner with, and are structurally dependent on, to generate credits. This can include:
- Primary feedstock providers (e.g., mines, biomass providers, tree nurseries)
- Major implementing partners (e.g., local implementation partners, base facilities, transportation and storage providers, major product offtakers)
- Land owners that make up a significant proportion of project land
To reflect the key role that direct counterparties play in high-quality credit generation, developers must conduct diligence and disclose on their direct counterparties to demonstrate that they are not causing social or environmental harm.
Increased Rigor for Enhanced Rock Weathering Projects: Over the past year, ERW’s presence in the CDR market has grown substantially, and so too has the market’s understanding of the corresponding scientific and technical rigor required to deliver high-quality tonnes. The 2026 Criteria raised the bar for how ERW projects:
- Measure and prove their carbon removal claims
- Mitigate risks related to potentially toxic elements (PTEs)
- Incorporate more sophisticated farmer protections and benefits
Projects now have to back up their numbers with multiple physical field measurements, not just computer models; and they must now track and account for every significant loss pathway, from plants taking up minerals to carbon escaping from rivers and oceans.
Use of Dynamic Baselines for ARR Projects: ARR projects are increasingly using dynamic baselines to provide a more accurate reflection of the counterfactual scenario (e.g., what would have happened in the absence of the project). This is reflected in the 2026 Criteria with a requirement that ARR projects, with the exception of agroforestry projects, use dynamic baselines with statistically matched controls.
What’s Next?
The 2026 Criteria create a clear, science-driven framework for both designing and delivering measurable, just, and durable carbon removal. However, the Criteria cannot ensure high-quality tonnes reach the market on its own; good criteria do not replace robust diligence. To put these criteria into practice, we encourage developers, standard-setting bodies, buyers, investors, and policymakers to consider how the Criteria can be used to inform their role in enabling the carbon market to deliver high-quality tonnes and to engage in deep diligence and ongoing monitoring over the life of a project.
This edition of the Criteria reflects what we have learned over the past year, but our work is not done. We will continue to update it so that it remains a living document that evolves with the science and the market. To do so effectively, it must be a collaborative effort; we welcome input from carbon market actors, academia, and communities.
Frequently Asked Questions
Who publishes the Criteria for High-Quality Carbon Dioxide Removal, and how often is it updated?
Relae (formerly Carbon Direct) first published the Criteria for High-Quality Carbon Dioxide Removal with Microsoft in 2021 and have updated it every year since. The 2026 edition reflects six years of lessons from real-world project diligence and advances in climate science.
What are the six principles of the Criteria for High-Quality Carbon Dioxide Removal?
The Criteria define six science-based principles that apply across all CDR pathways: social harms, benefits, and environmental justice; environmental harms and benefits; additionality and baselines; measurement, monitoring, reporting, and verification (MMRV); durability; and leakage.
What CDR pathways does the Criteria cover?
The Criteria include pathway-specific criteria across nine CDR pathways: afforestation, reforestation, and revegetation (ARR); mangrove forestation; improved forest management (IFM); soil carbon; enhanced rock weathering (ERW) in croplands; biomass carbon removal and storage (BiCRS); abiotic marine CDR; carbon mineralization; and direct air capture (DAC).
What is delivery risk in carbon removal?
Delivery risk is the likelihood that a project generates credits on the timeline and at the quantity committed to buyers. It's a distinct concern from credit quality: even a high-quality project can fail to deliver as planned because of technical, economic, commercial, organizational, or political risk, the five categories the Criteria's TECOP framework evaluates. The 2026 Criteria's new Delivery Risk Appendix gives developers, investors, and buyers a shared benchmark for identifying and managing these risks before they derail a project.
What's the relationship between carbon removal credit quality and delivery risk?
Credit quality and delivery risk are distinct but interrelated. A project that fails to deliver credits as planned reduces the availability of high-quality CDR tonnes in the market, and weaknesses in credit quality can themselves increase delivery risk by creating buyer uncertainty or limiting access to project financing. The 2026 Criteria provides a framework for evaluating both quality and delivery risk.