



The Relae Blog
Original insights from the Relae team on the forces reshaping power systems, GHG emissions, environmental markets, nature, and the capital and policies behind them.
Scope 2 Emissions Explained: Tracking, Reporting, and Reducing Impact
Key Takeaways
- Scope 2 emissions (indirect emissions from energy use) are increasingly critical to address. With surging electricity demand, especially from data centers, scope 2 is a growing share of corporate emissions and a priority for decarbonization.
- Approaches to scope 2 accounting are evolving—and formal changes are now on the table. Both location-based and market-based methods remain accepted under the Greenhouse Gas Protocol. Still, the Protocol's recently closed public consultation proposes more granular approaches, including 24/7 power and carbon matching, that would better reflect the realities of modern power markets.
- Proven decarbonization levers, such as reducing energy use, entering power purchase agreements, procuring green tariffs, and buying high-quality renewable energy certificates, are already available and impactful. Decarbonization, not just measurement, must be the goal. Companies don’t need to wait to decarbonize.
Accounting for Indirect Emissions From Energy Use
As businesses and organizations strive to reduce their environmental impact, carbon accounting has become an essential tool for tracking and managing greenhouse gas (GHG) emissions. Carbon accounting helps organizations measure, report, and mitigate their emissions across various activities. A key framework for categorizing these emissions is the Greenhouse Gas Protocol (GHG Protocol), which classifies emissions into three scopes:
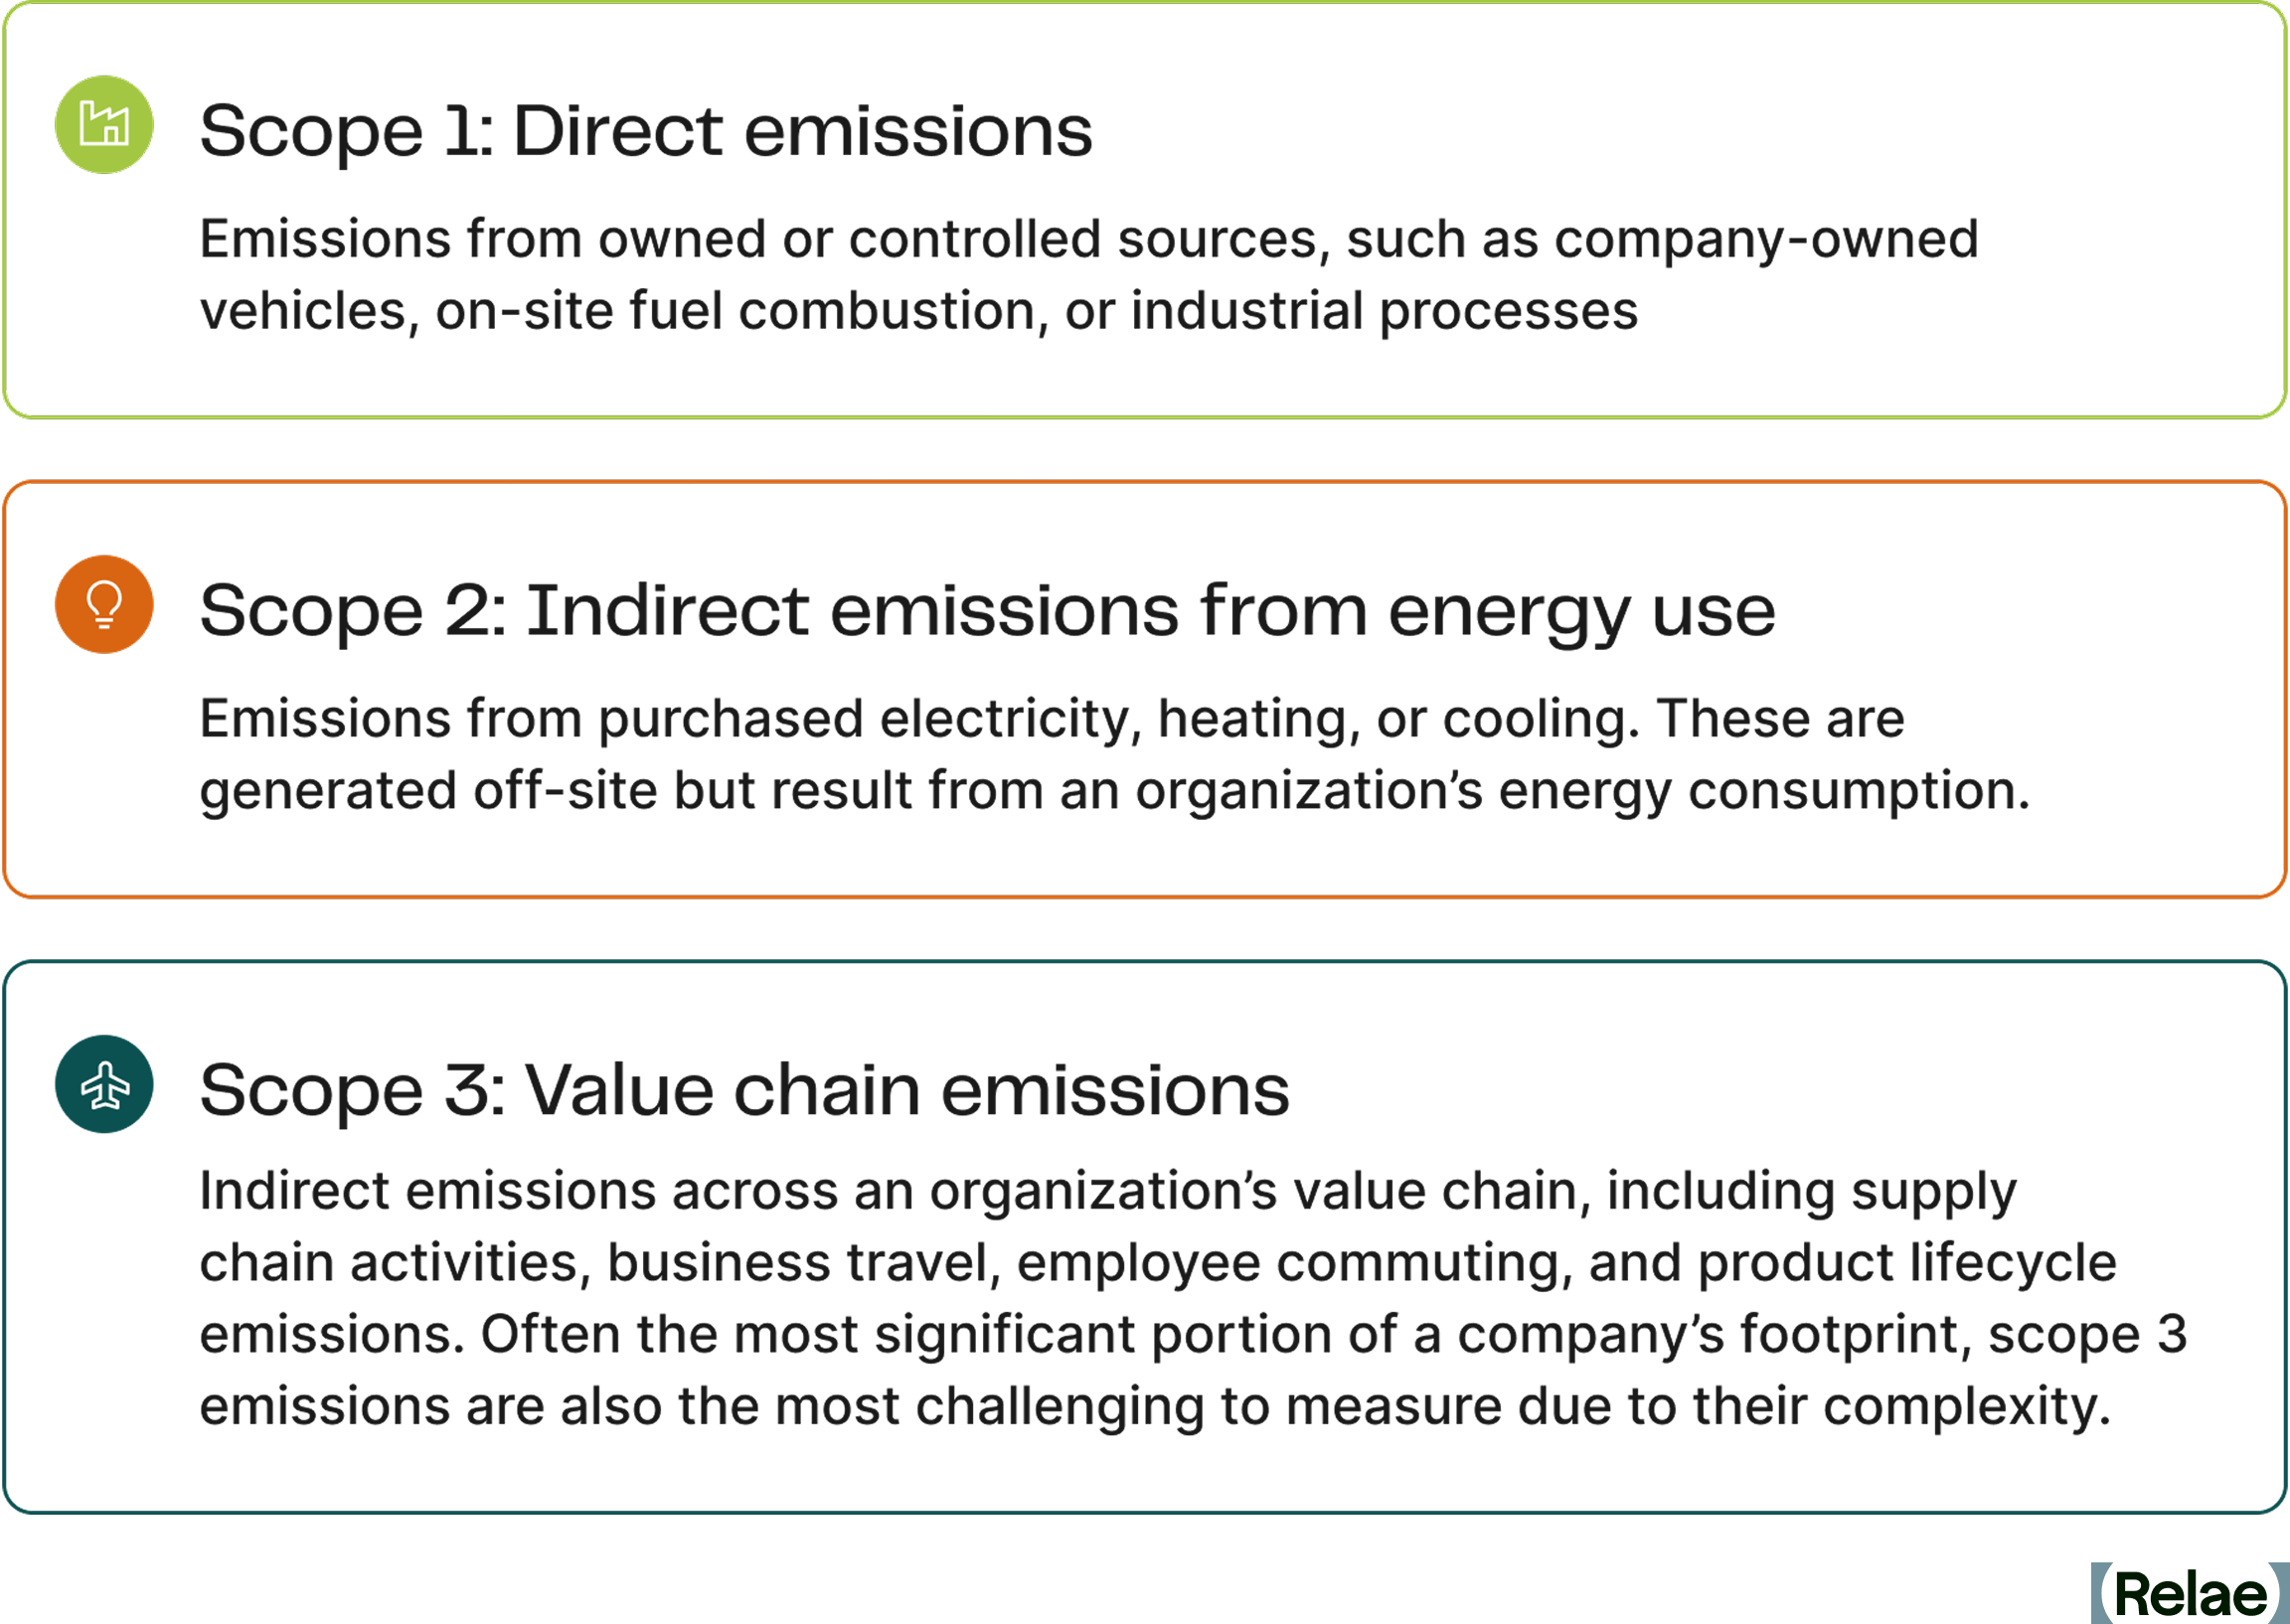
Each scope presents unique challenges and opportunities for reduction. Among them, scope 2 emissions are particularly significant because they stem from purchased energy, which is often generated using fossil fuels. However, numerous reduction mechanisms exist today to help organizations eliminate these emissions, such as improving energy efficiency in order to use less energy, and transitioning to renewable energy sources through market-based mechanisms. Understanding scope 2 emissions is crucial for businesses looking to contribute meaningfully to the global energy transition and achieve sustainability goals.
What Are Scope 2 Emissions?
Scope 2 emissions refer to indirect GHG emissions associated with the consumption of purchased energy. Unlike scope 1 emissions, which result from direct fuel combustion, scope 2 emissions arise from the generation of electricity, steam, heat, or cooling that a company procures from external sources.
The primary sources of scope 2 emissions include:
Purchased electricity: When businesses buy electricity from a utility provider, the emissions from power plants that generate this electricity are classified under scope 2.
Purchased heat, steam, and cooling: Some companies purchase heat, steam, or cooling services instead of generating them on-site. These services often come from centralized facilities that may rely on fossil fuels, thereby contributing to scope 2 emissions.
What sets scope 2 emissions apart from other scopes is the presence of market-based mechanisms that offer multiple pathways for organizations to reduce their carbon footprint. Unlike scope 1, where emissions reductions often require technological shifts or operational changes, scope 2 reductions can be achieved through strategic procurement decisions. The transition to renewable energy sources is an essential component of sustainability strategies, setting the stage for a broader energy transition across industries and economies.
How Are Scope 2 Emissions Measured Today?
The GHG Protocol currently outlines two primary approaches for calculating scope 2 emissions: the location-based method and the market-based method.
Location-Based Method
The location-based method calculates emissions for electricity consumption based on the average emissions intensity of the grid where the energy consumption occurs. This approach is mandatory under various reporting frameworks and does not take into account a company’s procurement choices.
- Relies on grid averages: Emissions are calculated based on regional grid emissions factors rather than specific energy purchases.
- Time-delayed data: Since grid emissions factors are typically updated annually, this method may not reflect real-time energy sourcing changes.
- Limited control: Companies using this method have less direct influence over their reported emissions, as they depend on the overall energy mix of their region.
Market-Based Method
The market-based method, on the other hand, reflects an organization’s actual procurement decisions and energy-sourcing strategies. It accounts for specific contracts, such as power purchase agreements (PPAs), renewable energy credits (RECs), and green tariffs, which allow businesses to claim lower emissions from their purchased electricity.
- Reflects company choices: Emissions calculations take into account contractual agreements for renewable energy purchases.
- Mechanism for electricity transition: Encourages organizations to invest in low-carbon electricity options and actively support the transition to renewables.
- Multiple reduction options: Companies can reduce their scope 2 emissions through a portfolio of mechanisms like PPAs, RECs, and green tariffs, making this method a flexible and strategic tool for decarbonization.
While market-based mechanisms provide flexibility in reducing scope 2 emissions, they also highlight the need for more precise and updated carbon accounting methodologies. For example, some decarbonization strategies, such as time-shifting energy consumption to better match renewable generation, are not accounted for under these methods. This and other limitations mean that the traditional methods outlined in the GHG Protocol are increasingly seen as outdated in an era of rapid changes in energy generation and grid dynamics. As a result, the market is shifting toward more advanced power emission accounting methodologies that provide a more accurate reflection of emissions associated with electricity use.
Proposed Changes to the GHG Protocol Scope 2 Guidance
The current GHG Protocol Scope 2 Guidance provides a market-based instrument methodology, originally designed in the early 2000s, that allows US-based companies to procure renewable energy at any point within a year from anywhere in North America and apply it to any of its annual electricity consumption within that same year. This methodology, as written, allows for a potentially significant mismatch of “emissions caused” (by consuming electricity) versus “emissions avoided” (by generating renewable electricity) in that it does not account for any of the realities of electric grids and generators, which vary significantly over different regions, seasons, and time of day.
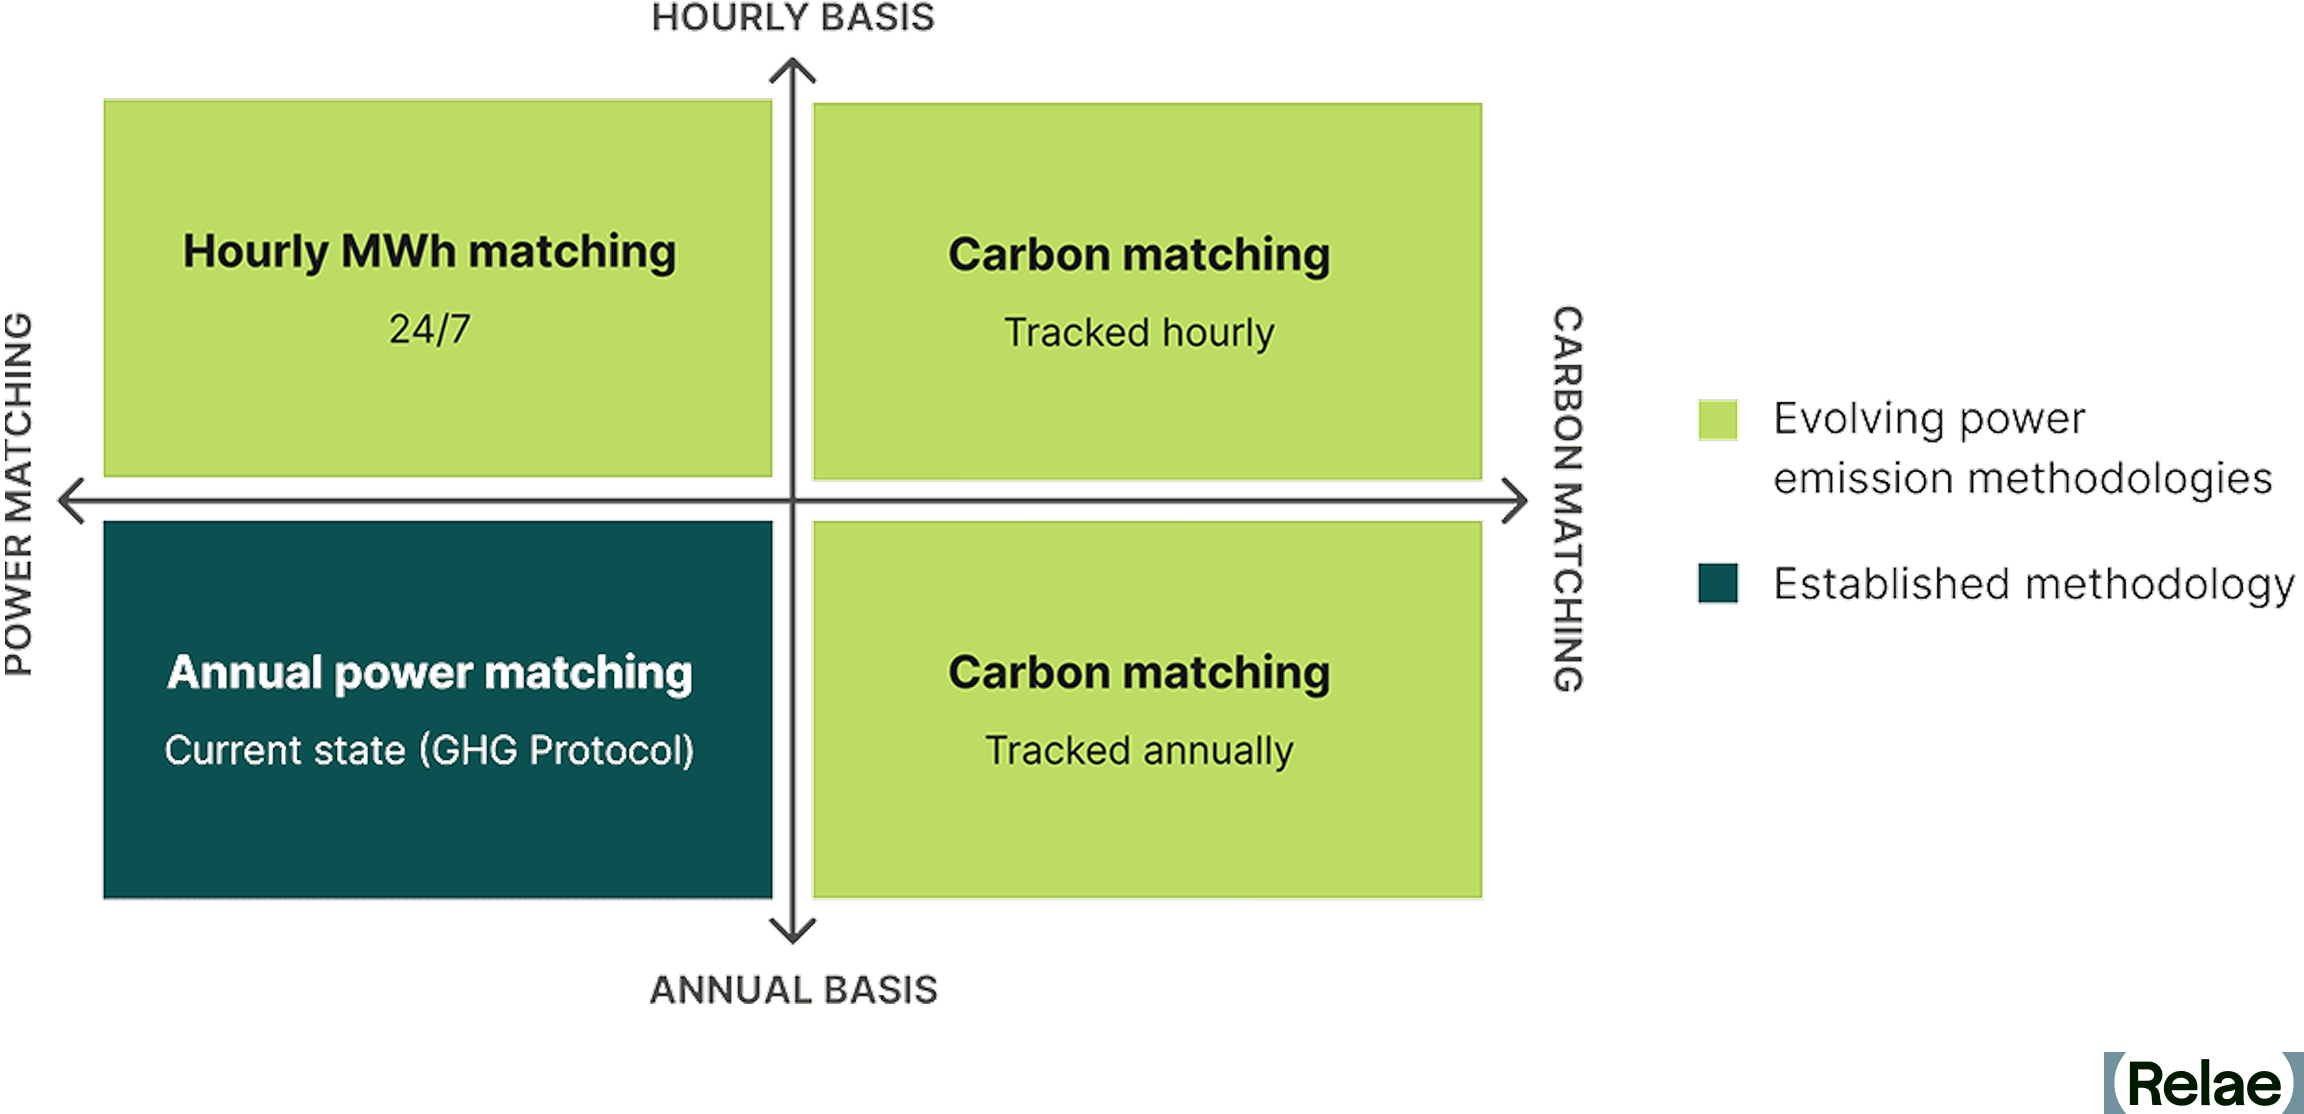
In response to this, the GHG Protocol Scope 2 Guidance is currently undergoing a revision process, which will include how emissions associated with electricity consumption are calculated. A focus of the revision process is on how to better account for the real emissions associated with a corporate’s electricity consumption, and more impactful ways of mitigating them through market-based instruments and other approaches. Advanced power emission accounting methodologies, such as 24/7 power matching and carbon matching, are being explored as ways to better represent the GHG emissions associated with electricity consumption.
- 24/7 power matching emphasizes matching electricity consumption with an equivalent amount of renewable energy production on an hourly basis.
- Carbon matching emphasizes measuring the emissions impact of incremental electricity consumption or production at a specific time.
These emerging methodologies propose a shift toward more granular temporal and region-specific matching, which could require companies to rethink their emissions reporting approach and explore more advanced tracking tools. They may also introduce new strategies beyond market-based instruments for reducing scope 2 emissions, such as time-shifting energy consumption.
As power grids continue to decarbonize and new digital tools emerge, businesses will need to adapt to these evolving methodologies to remain compliant, enhance sustainability strategies, and achieve meaningful reductions in emissions. Companies that proactively integrate advanced power emission tracking into their carbon accounting strategies will be better positioned to lead in the transition to a low-carbon economy.
How to Reduce Scope 2 Emissions
The GHG Protocol provides multiple mechanisms for reducing scope 2 emissions, allowing organizations to shift their energy consumption toward lower-carbon alternatives. These include:
- Reducing energy consumption: Improving energy efficiency in operations can significantly lower electricity use. In some cases, this involves capital investments in more energy-efficient equipment, but in other cases, it can be based on operational changes such as reducing unnecessary lighting, HVAC, and other services during non-working hours. (Electrification efforts, such as shifting from fossil fuel-powered systems to electric alternatives, may actually increase scope 2 emissions, but this can ultimately reduce overall emissions by correspondingly decreasing scope 1 emissions and allowing for renewable energy procurement.)
- RECs: Companies can purchase unbundled RECs (emissions “attributes” separated from the actual electricity product) to offset emissions associated with purchased electricity. While there has been criticism of RECs due to their significant range in quality, high-quality RECs are available, which may include ensuring regional matching, financial additionality, on-line date additionality, or tighter temporal generation to consumption matching. The use of high-quality unbundled RECs is the most accessible and realistic option for most smaller-scale companies to address scope 2 emissions.
- On-site generation and co-location: Installing on-site renewable energy generation, such as solar panels, allows companies to directly offset their electricity consumption from the grid. In some commercial settings, such as companies using leased real estate or co-located data centers, partnering with facilities that prioritize renewable energy procurement can help reduce scope 2 emissions for the facility owner while the facility occupant reduces scope 3 emissions.
- PPAs: Entering into long-term contracts with renewable energy providers ensures companies receive electricity from clean energy sources while supporting the expansion of renewable generation capacity. PPAs are available with standardized contract terms, and some service providers will aggregate demand from multiple smaller companies to reach the minimum required amount for typical PPA contracts. Hedging products are also available to reduce market risks.
- Green tariffs: Many utilities offer green tariffs that enable businesses to purchase renewable energy directly through their electricity provider, often at a premium but with lower emissions impact. For many smaller companies, this is a more viable approach than a PPA with a single renewable generator.
By adopting a combination of these strategies, businesses can significantly lower their scope 2 emissions while aligning with broader sustainability goals and regulatory requirements. The path to decarbonization requires proactive investment in cleaner energy sources, efficient consumption practices, and leveraging market-based instruments to drive the transition toward a low-carbon future.
Why Does Reducing Scope 2 Emissions Matter?
Reducing scope 2 emissions is the underpinning of decarbonizing the power sector and enabling the global energy transition. In 2025, S&P reported that corporate buyers added 15.2 GW of renewable capacity in the US, up from 9.1 GW in 2024, illustrating the growing impact of the corporate sector on the electricity grid. Cleaner grids translate to lower emissions for all energy users. Organizations that actively reduce their scope 2 emissions can contribute to decreasing demand for fossil fuel-based electricity and accelerate the deployment of renewable energy infrastructure.
For companies that own and operate data centers, this transition is especially important. AI data centers consume large amounts of electricity, and their reliance on purchased power makes them a significant source of scope 2 emissions. Since many businesses rely on third-party data center services, reducing emissions from these facilities also helps lower scope 3 emissions across industries. Corporates can influence data centers by requiring that they have a clear and explicit low-emission power strategy in place before procurement.
Beyond direct corporate benefits, reducing scope 2 emissions has a tangible long-term impact on power grids. Increased investment in renewable energy procurement sends a strong market signal, encouraging utilities and developers to expand clean energy projects. As more companies commit to sourcing renewable energy, the overall mix of grid power shifts, making low-carbon electricity more accessible and reducing reliance on fossil fuel-based generation. Ultimately, widespread corporate action in scope 2 emissions reduction supports the broader decarbonization of power markets and strengthens global climate commitments.
Frequently Asked Questions
Will RECs (renewable energy certificates) still count toward scope 2 reductions under the GHG Protocol's proposed changes?
Under the current Scope 2 Guidance, yes—RECs remain a valid market-based instrument. The proposals from the GHG Protocol's recent consultation range from retaining market-based accounting with stricter quality criteria to restructuring how instrument-based claims are reported altogether, and nothing is final until the revised standard is published. What's clear is that scrutiny is rising, particularly for unbundled RECs with weak temporal or geographic connection to a company's actual consumption, so prioritizing high-quality RECs now is the best way to future-proof a procurement strategy.
How would the proposed hourly and regional matching requirements affect companies that rely on unbundled RECs today?
Hourly (24/7) and regional matching would require renewable generation claims to line up much more closely with when and where a company actually consumes electricity. Companies relying on annually matched, unbundled RECs sourced from distant grids would likely see their reported market-based emissions rise under such requirements. The practical preparation is to start collecting more granular (ideally hourly) consumption data and shift toward RECs and contracts with tighter regional and temporal matching.
What's the practical difference between location-based and market-based scope 2 accounting, and will that distinction survive the GHG Protocol's revision?
The location-based method calculates emissions using the average emissions intensity of the local grid, regardless of procurement choices, while the market-based method reflects a company's actual contracts, such as PPAs, RECs, and green tariffs. The consultation explored options from strengthening the criteria for market-based claims to reporting emissions and market instruments in separate, complementary statements. Both concepts will exist in some form, but companies should expect the requirements behind market-based claims to tighten.
When is the new Scope 2 Guidance expected to take effect, and what should companies do now to prepare?
Per the GHG Protocol's July 2026 development plan, a draft of the revised consolidated Corporate Standard is expected for public consultation in 2027, with a final published standard currently estimated for late 2028, and adoption timelines will follow publication. Companies should take action now. Energy efficiency, PPAs, green tariffs, and high-quality RECs reduce real emissions under any accounting regime. Building hourly consumption tracking and auditing the quality of existing REC portfolios now will make any future transition smoother.
The Business Case for Carbon Accounting: What It Is and Why It Matters
Key Takeaways
- Carbon accounting is a regulatory and strategic necessity, with policies like the European Union’s Corporate Sustainability Reporting Directive (CSRD) and California’s SB 253 requiring emissions tracking.
- Many companies track emissions inconsistently, underscoring the need for structured, repeatable carbon accounting to ensure accuracy and impact.
- Accurate carbon data drives efficiency and risk management, helping organizations reduce costs, streamline supply chains, and comply with climate regulations.
- Scope 2 emissions are increasingly challenging to quantify, especially for data centers and power-intensive operations. Grid-average emissions factors mask location-specific and time-specific variations that drive real procurement and siting decisions. Precise scope 2 accounting requires understanding which generators actually serve the load, when, and under what grid conditions.
- Scope 3 emissions have historically been a complex challenge, requiring better supplier engagement, standardized reporting, and expert guidance to support accuracy.
Carbon Accounting: More Than Compliance, a Strategic Advantage
Companies increasingly recognize the business value of reporting carbon emissions: it reduces regulatory risks, attracts sustainability-focused investors, enhances market competitiveness, and drives cost savings through efficiency. Transparent emissions reporting strengthens brand trust and aligns companies with global sustainability standards, ultimately turning climate accountability into a strategic advantage.
Yet, many companies struggle with incomplete and inconsistent tracking. According to the State of Corporate Climate Commitment, 80% of corporate professionals surveyed have tracked emissions at least once, but only 52% do so annually. Without a structured process and reliable data, businesses face compliance risks, financial penalties, and missed cost-saving opportunities.
This guide provides a clear roadmap to effective carbon accounting, equipping businesses with the knowledge to navigate regulations, enhance data accuracy, and implement effective strategies for compliance and operational success.
[stat]
What Are the Benefits of Effective Carbon Accounting?
By embedding annual carbon accounting into operations, organizations can enhance sustainability efforts while achieving financial and strategic benefits. Key benefits include:
Enhancing Transparency and Accountability
By providing accurate and verifiable emissions data, companies can showcase corporate responsibility and build a foundation of transparency. Aligning with recognized standards like the GHG Protocol strengthens confidence among investors and regulators. As climate disclosure laws tighten globally, ensuring credible emissions reporting reduces regulatory risks and enhances stakeholder trust. This commitment to authenticity minimizes the risk of greenwashing and strengthens brand reputation.
Guiding Regulatory Compliance and Risk Mitigation
Businesses navigating evolving environmental regulations must proactively align with policies to avoid financial and legal risks. Mandated emissions reporting, under policies like the European Union’s Corporate Sustainability Reporting Directive (CSRD) and Carbon Border Adjustment Mechanism (CBAM) as well as California’s SB 253, ensures compliance and enhances corporate accountability. Staying ahead of these evolving requirements prepares businesses for future policy shifts and safeguards their long-term resilience.
Improving Operational Efficiency and Reducing Costs
By analyzing energy consumption patterns, organizations can identify operational inefficiencies, optimize supply chains, and implement cost-saving measures while reducing carbon emissions. For example, evo, an outdoor experiences company, collaborated with Relae (formerly Carbon Direct) to assess its carbon footprint. This analysis revealed opportunities to reduce emissions across facilities, products, and shipping. By promoting sustainable practices throughout their supply chain, evo enhanced both environmental performance and operational efficiency.
Building a Competitive Advantage in a Low-Carbon Economy
Building a competitive advantage in a low-carbon economy requires prioritizing emissions transparency and sustainability. Companies that integrate emissions transparency into their operations build stronger relationships with supply chain partners and meet consumer demand for responsible brands. Aligning corporate values with sustainability fosters long-term customer loyalty and enhances market positioning.
Driving Strategic Planning and Net-Zero Alignment
Setting and tracking net-zero commitments requires structured, data-driven carbon reduction roadmaps. Businesses that measure emissions annually are more likely to set public sustainability goals and take action. Carbon accounting supports clean energy transitions, fosters supply chain collaboration, and integrates carbon removal strategies to address residual emissions. By embedding emissions measurement into long-term planning, organizations facilitate resilience and profitability in an evolving business landscape.
Carbon emissions measurement correlates to climate action: 61% of companies that calculate their footprint annually have both set a public goal and begun working toward it.
What Is Carbon Accounting? The Basics You Need to Know
Carbon accounting is the systematic measurement, analysis, and reporting of an organization's greenhouse gas (GHG) emissions. Using standardized metrics like carbon dioxide equivalent (CO₂e), companies can assess emissions across operations and supply chains, identify high-impact areas, and set and track progress toward emissions reduction targets. When conducted annually, carbon accounting supports regulatory compliance, risk management, and decarbonization strategies essential for long-term sustainability.
The GHG Protocol is the most widely used framework for carbon accounting, setting the baseline for how organizations measure and report their emissions. It classifies emissions into three scopes:
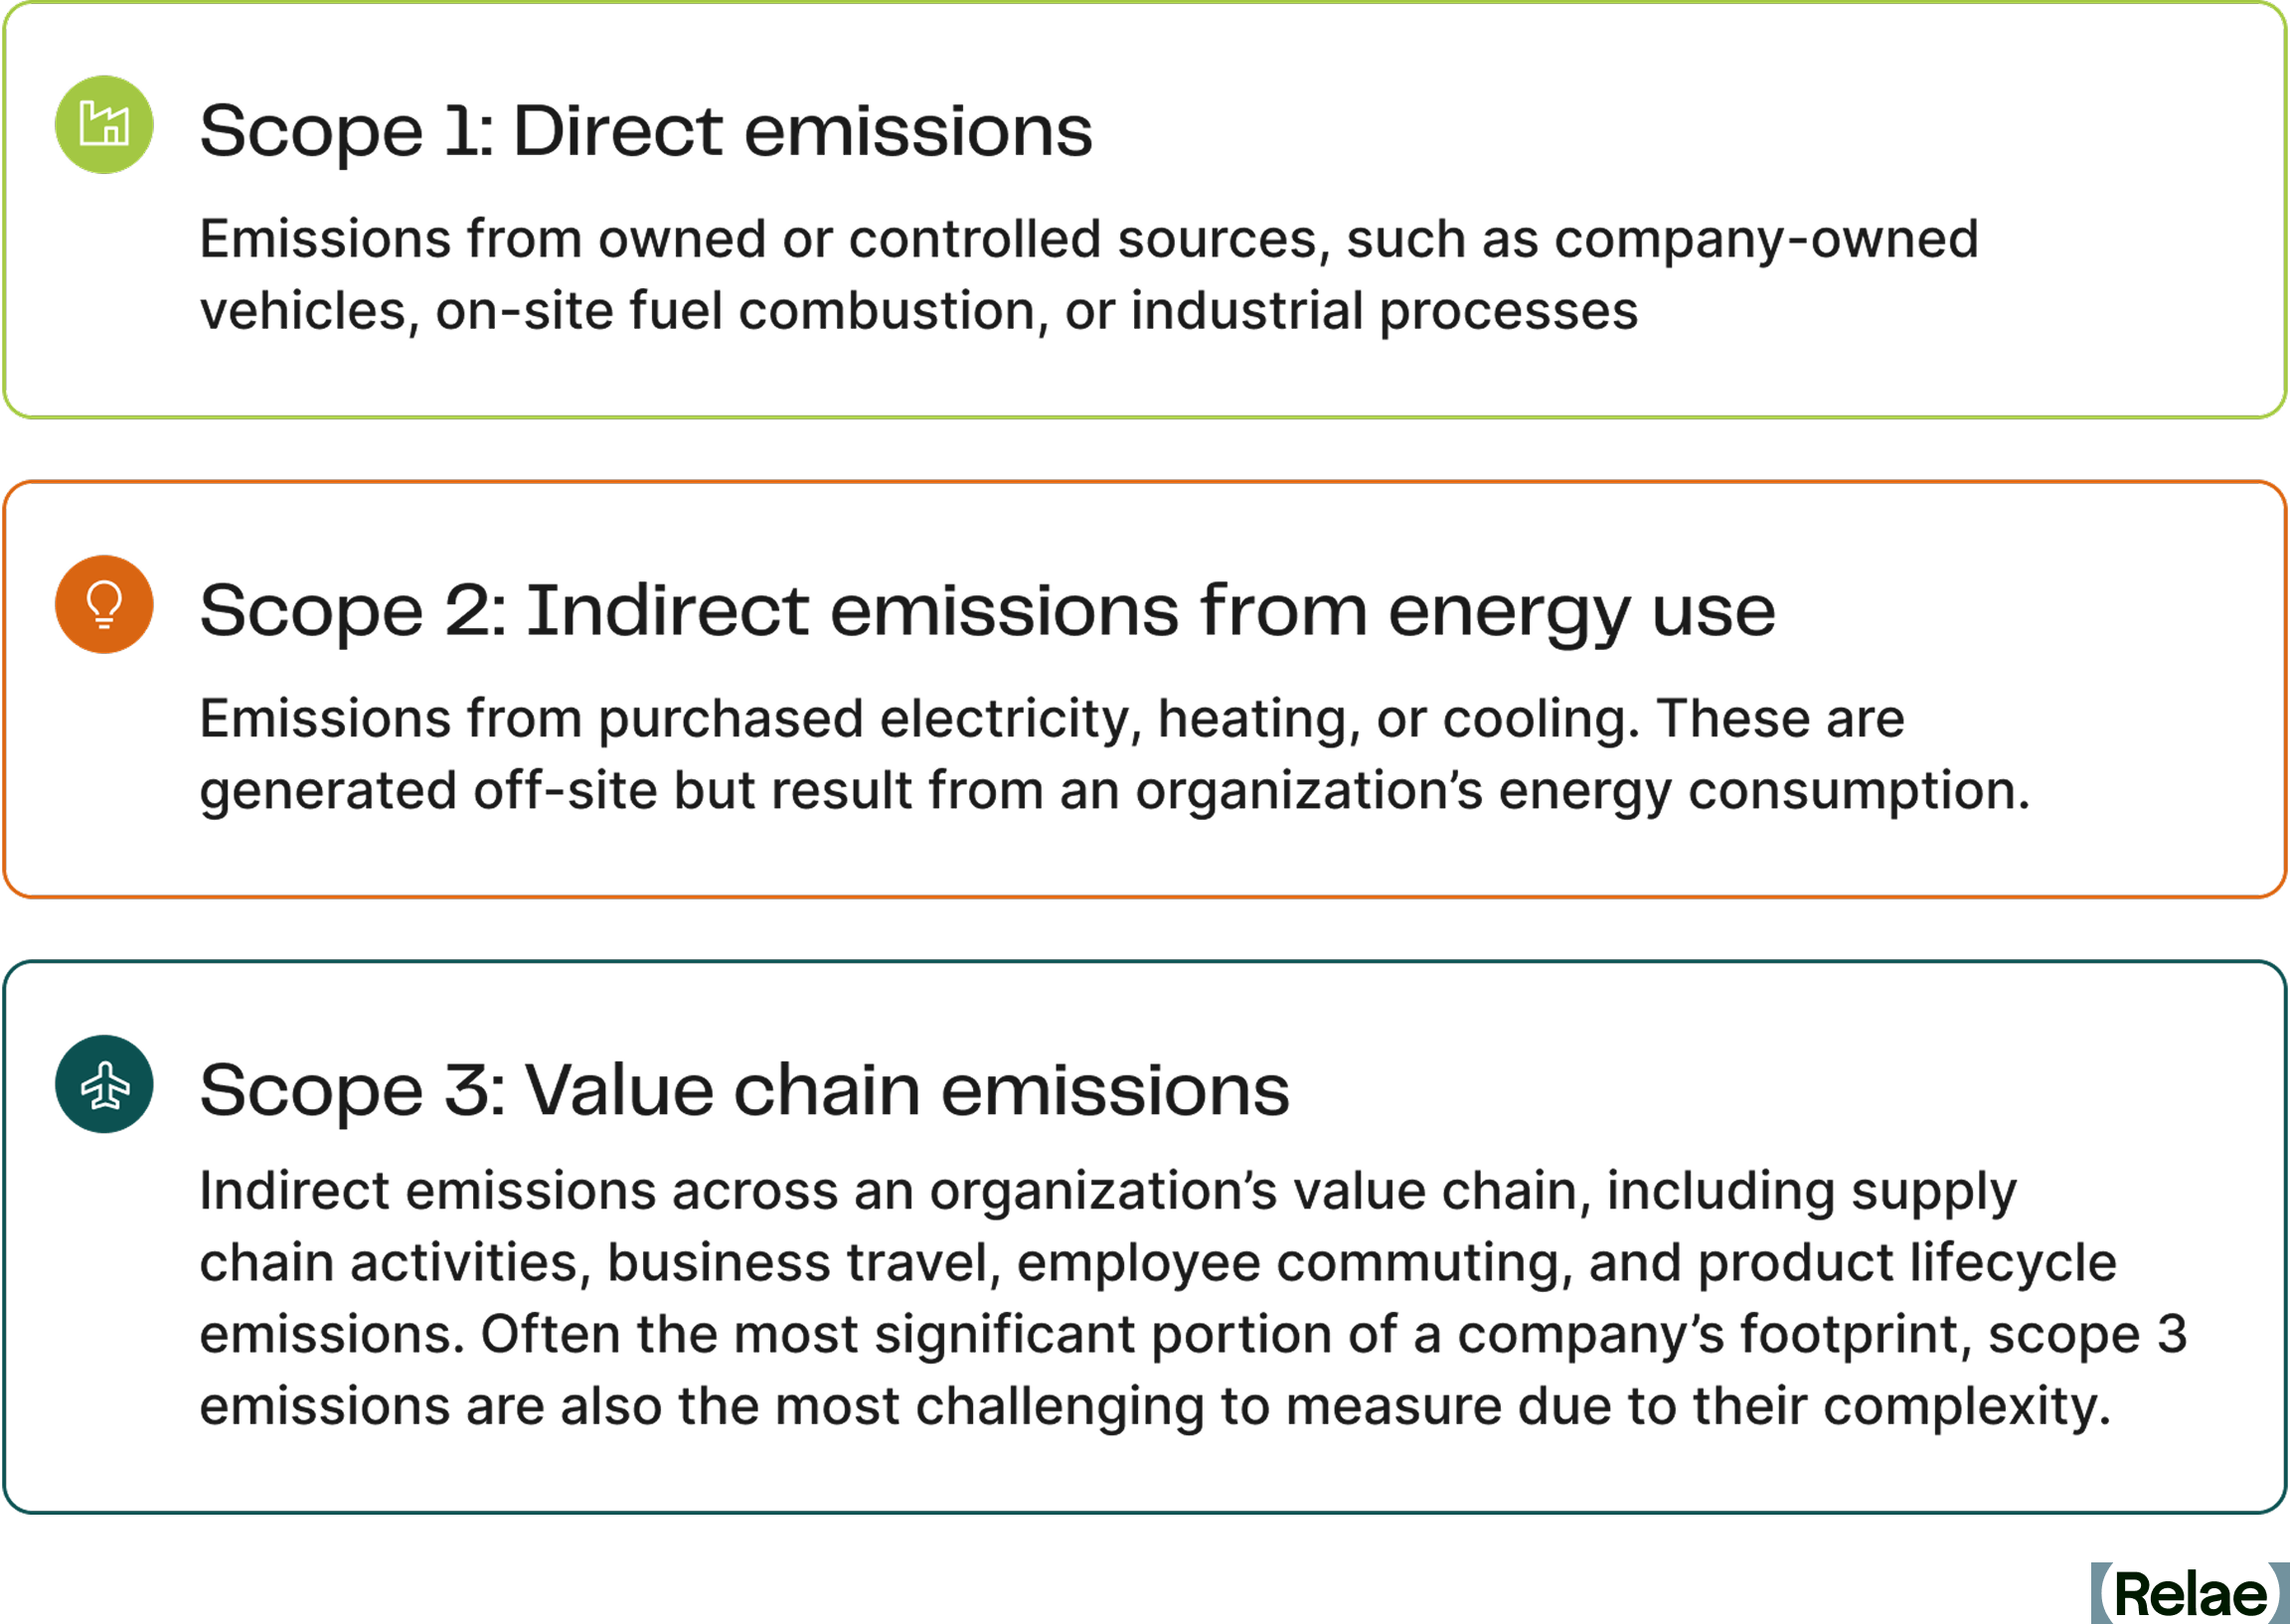
Keep in mind that scope 2 emissions are increasingly difficult to quantify using traditional methods, which fail to account for real-time grid fluctuations and locational energy variations. Cutting-edge, advanced carbon accounting methodologies now provide more precise tracking, particularly benefiting large power consumers like enterprise data centers and hyperscalers.
Scope 3 emissions also continue to pose a great challenge, requiring extensive data collection and supplier coordination, complexities that are difficult to navigate without expert guidance.
The Corporate Carbon Accounting Process: A Step-by-Step Guide
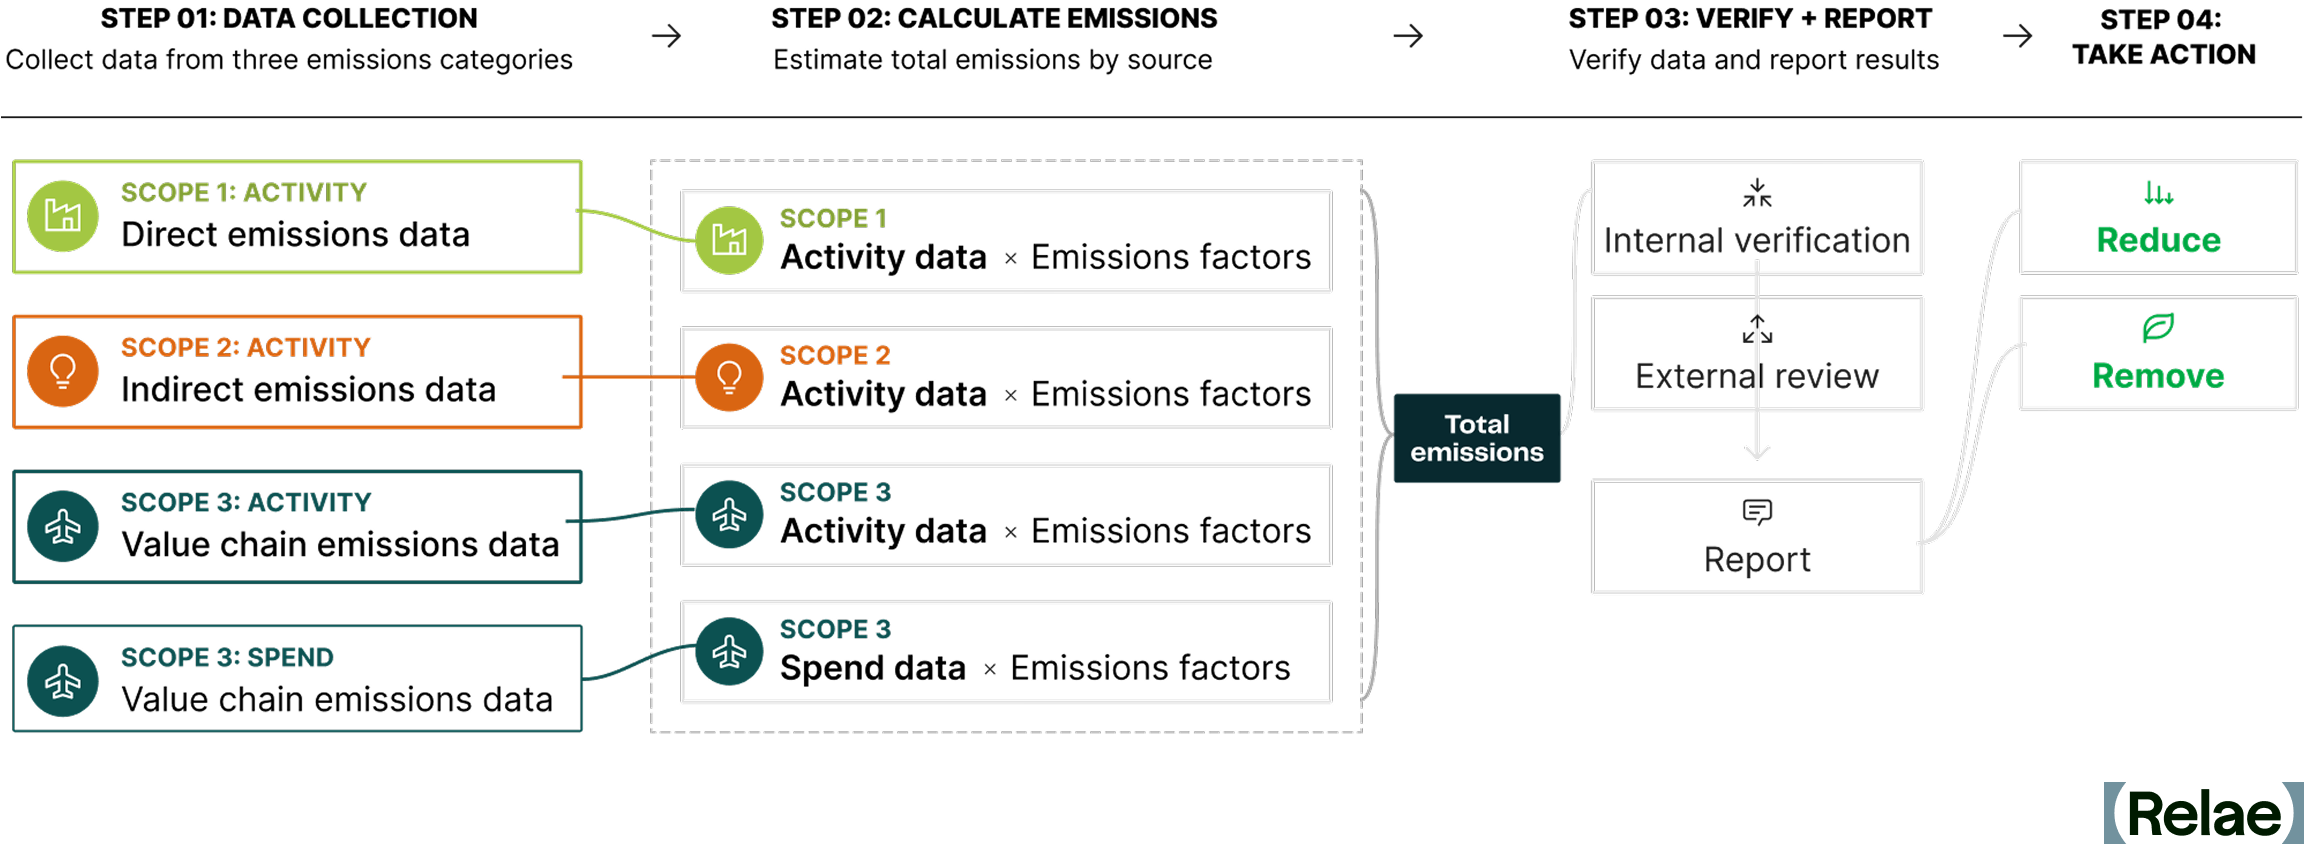
The carbon accounting process involves systematically measuring, analyzing, and managing an organization’s greenhouse gas emissions across its operations, supply chain, or product life cycle.
- Collect emissions data across all three scopes (scope 1, scope 2, and scope 3).
- Categorize and quantify emissions from each source to estimate the total impact.
- Verify data and report findings to promote compliance, accuracy, and transparency.
- Develop and implement reduction strategies based on insights from the data.
Activity Data Versus Spend Data
Carbon measurement primarily relies on two data types: activity data and spend data.
- Activity data includes direct measurements reflecting the physical amount of an emitting source, such as fuel consumption (in liters or gallons) or travel distance (in kilometers or miles). It accurately represents emissions from a particular operational emission source and allows for measurable decarbonization strategies.
- Spend data serves as an alternative when activity data is unavailable. It estimates emissions based on financial expenditures related to goods, services, or travel. While less precise, it is useful for approximating scope 3 emissions, where direct measurement is often challenging.
Tips for Accurate Data Collection
Effective carbon accounting relies on seamless collaboration across departments, suppliers, and external data sources. Key strategies include:
- Stakeholder engagement: Finance, operations, procurement, and sustainability teams must coordinate to track and validate emissions data. Engaging suppliers is essential for capturing and reducing scope 3 emissions.
- Addressing data gaps: When data is unavailable, proxy data can be used to estimate emissions, but it should be a temporary solution while organizations work toward obtaining accurate, real-world data.
- Standardization and verification: Implementing consistent methodologies and third-party audits enhances the credibility of carbon reporting, building stakeholder trust.
By leveraging precise data, understanding emission scopes, and adopting structured data collection methods, organizations can create a transparent, science-based approach to carbon accounting and lay the foundation for meaningful climate action.
Climate Standards Businesses Need to Know
Global standards and regulations define carbon accounting methodologies by establishing guidelines for how organizations set boundaries, measure, and disclose emissions. Several key frameworks and policies guide both the international and regulatory levels.
Guidance frameworks
GHG Protocol: The Foundation of Carbon Accounting
- The GHG Protocol is the most widely adopted framework for measuring and managing emissions across organizations globally.
- Developed by the World Resources Institute (WRI) and the World Business Council for Sustainable Development (WBCSD), it provides common standards for businesses, governments, and supply chains.
- Sector-specific guidance has been developed for industries such as energy, finance, manufacturing, and agriculture, which face stricter reporting requirements than service-based sectors.
- The GHG Protocol is currently undergoing its first major revision since its launch. Partnering with the International Organization for Standardization (ISO) to co-develop a consolidated corporate standard that merges the Corporate Standard, Scope 2 Guidance, Scope 3 Standard, and Actions and Market Instruments standard with ISO 14064-1. As of mid-2026, the effort is in active technical development, with a draft opening for public consultation targeted for mid-2027 and a final published standard expected by the end of 2028. Current standards stay in effect until that replacement is finalized, so nothing changes for reporting yet.
ISO 14064: Standardized Emissions Quantification and Reporting
- The ISO 14064 series, created by the International Organization for Standardization (ISO), offers detailed methodologies for greenhouse gas accounting.
- It includes guidelines for organization-level emissions quantification, reporting, and reduction projects.
- ISO 14064 serves as the foundation for independent verification and compliance with voluntary carbon markets, enhancing the credibility of emissions reduction projects.
Policies
EU CSRD: Expanding Mandatory Climate Disclosure
- The Corporate Sustainability Reporting Directive (CSRD) enforces detailed sustainability reporting requirements for companies operating in the EU.
- Following the EU's 2025 to 2026 Omnibus simplification package, CSRD's scope narrowed sharply. It now applies to roughly 5,000 large companies, with new thresholds of more than 1,000 employees and more than 450 million euros in net turnover (up from the original 250 employees and 50 million euros)
- In scope companies must still report scope 1, 2, and 3 emissions data aligned with the EU Taxonomy and European Sustainability Reporting Standards (ESRS).
California SB 253: State-Level Mandatory Emissions Disclosures
- California’s SB 253 Climate Corporate Data Accountability Act sets strict emissions reporting mandates within the US.
- It applies to companies with over US$1 billion in revenue doing business in California, requiring scope 1 and 2 emissions reporting by November 2026..
- CARB has said scope 3 reporting and third-party assurance requirements will be addressed in a subsequent rulemaking covering 2027 and beyond.
EU CBAM: Preventing Carbon Leakage and Promoting Decarbonization
- The Carbon Border Adjustment Mechanism Requirements (CBAM) requires importers of specific carbon-intensive goods to disclose embedded emissions to prevent carbon leakage and promote global decarbonization by ensuring that domestic and foreign producers face comparable carbon costs.
- During the transitional phase (2023–2025), importers were required to submit quarterly reports on embedded emissions.
- As of 2026, they must purchase CBAM certificates to compensate for the carbon footprint of imported goods.
Although carbon accounting requirements vary across regions and industries, they are all fundamentally rooted in the principles established by the GHG Protocol and ISO 14064. As global regulations like the EU CSRD and state-level legislation evolve, organizations must proactively align with these stricter standards to mitigate regulatory risks and support compliance with emerging sustainability expectations.
What Are the Industry-Specific Challenges of Carbon Accounting?
Carbon accounting presents unique challenges across industries due to varying operational structures, emissions sources, and reporting requirements. While the challenges outlined below focus on financial services, data centers, and philanthropies, similar complexities exist across manufacturing, transportation, healthcare, and other sectors. Tailored strategies are essential to effectively addressing these complexities.
Data Centers: Measuring and Reducing Scope 2 and 3 Emissions
Data center operators consume vast amounts of electricity making scope 2 emissions a major concern. In addition, data center developers and owners face significant scope 3 emissions from embodied carbon from the building materials and the IT hardware required to develop these assets. Effective strategies to reduce data center emissions include:
- Optimizing computing needs and power usage: Use real-time metering and AI-powered analytics to optimize electricity usage across time and locations.
- Procuring low-carbon electricity: Secure long-term access to compliant low-carbon electricity through power purchase agreements (PPAs) or high-impact renewable energy credits (RECs).
- Tracking life cycle emissions: To provide a comprehensive emissions assessment, account for embodied carbon in server manufacturing and end-of-life disposal.
Financial Services: Assessing Emissions From Investments and Portfolios
Financial institutions face significant challenges in evaluating scope 3 financed emissions from investments, loans, and asset portfolios. Key strategies to address these challenges include:
- Adopting industry standards: Frameworks like the Partnership for Carbon Accounting Financials (PCAF) can be used to standardize emissions calculations.
- Understanding asset level data: To accurately report on financed emissions, investors need visibility of emissions data, ideally at the company level.
- Prioritizing green investment strategies: Shift toward sustainable finance by integrating sustainability criteria and emphasizing green bonds or low-carbon funds or investments.
- Ensuring regulatory compliance: To enhance transparency, align with global disclosure frameworks like the International Sustainability Standards Board's (ISSB) IFRS S2 climate-related disclosure standard.
Philanthropies: Managing Emissions From Private Financing
Philanthropic organizations face challenges in tracking emissions across diverse funding activities, operational footprints, and investment portfolios. Effective strategies include:
- Assessing grantmaking impact: Many philanthropies support climate initiatives but may not track the carbon impact of grantees or funded projects. Establishing emissions metrics for grants can enhance transparency and effectiveness.
- Measuring operational emissions: While some philanthropies have relatively low direct emissions, travel, events, and office space still contribute to their carbon footprint. Implementing sustainable operations policies can help reduce emissions.
- Decarbonizing investment portfolios: Endowments and investment funds often hold assets with varying GHG emissions. Aligning investments with sustainability goals and engaging with asset managers on emissions reduction can drive impact.
Organizations across these sectors can enhance emissions transparency, improve sustainability efforts, and align with global climate goals by implementing industry-specific carbon accounting methods.
Navigating Evolving Standards and Scope 2 Complexity
Carbon accounting standards are actively evolving. In October 2025, the GHG Protocol released two proposals for scope 2 accounting revisions, with final standards expected by 2027. The proposals shift toward hourly and regional renewable energy matching, moving away from today's annual, region-agnostic approach. They also introduce consequential methodology that calculates actual emissions displaced by renewable projects, which varies significantly by region.
For organizations with 2030 climate targets, timing matters. Existing long-term contracts are expected to be grandfathered in under new rules. Meanwhile, new renewable projects face interconnection delays of 3 to 5 years, and the US power grid is experiencing sustained demand growth driven largely by data centers. These pressures converge: power demand is rising while new clean electricity supply is constrained.
Navigating these changes requires understanding emerging methodologies and their strategic implications. See our companion pieces on Navigating Scope 2 Accounting Changes and Scope 2 Emissions Explained for detailed context.
Frequently Asked Questions
How long does carbon accounting implementation take?
Initial measurement typically takes 3 to 6 months, depending on data availability and organizational coordination. Starting with data you already have (utility bills, fuel records) accelerates the process. Scope 2 and scope 3 require more extensive work than scope 1, so actual timelines vary based on which scopes are your focus.
What are the biggest obstacles to getting accurate emissions data?
Data siloes across departments (finance, operations, procurement track separately). For scope 2, grid-average factors mask location- and time-specific variations that actually drive emissions. For scope 3, extensive data collection and supplier coordination are required. Seamless collaboration across departments is essential.
Do we need to measure all three scopes to start?
Yes. Organizations should measure all three scopes. Start where your business is most materially affected, but eventually measure all three for compliance and complete visibility into your emissions sources.
Carbon Capture for Natural Gas-Fired Power Generation: An Opportunity for Hyperscalers
Key Takeaways
- AI-driven data center demand is outpacing grid capacity, and hyperscalers are bringing more natural gas, which already supplies about 40% of US electricity, online to meet their needs.
- Pairing carbon capture and sequestration (CCS) with natural gas lets data centers source firm power today while cutting plant-level emissions up to 95%—without waiting on multi-year renewable interconnection queues.
- The Google-Broadwing deal demonstrates real progress and commitment toward natural gas with CCS as the first major commercial deployment of this exact pathway
Meeting Electricity Demand and GHG Emission Reduction Targets
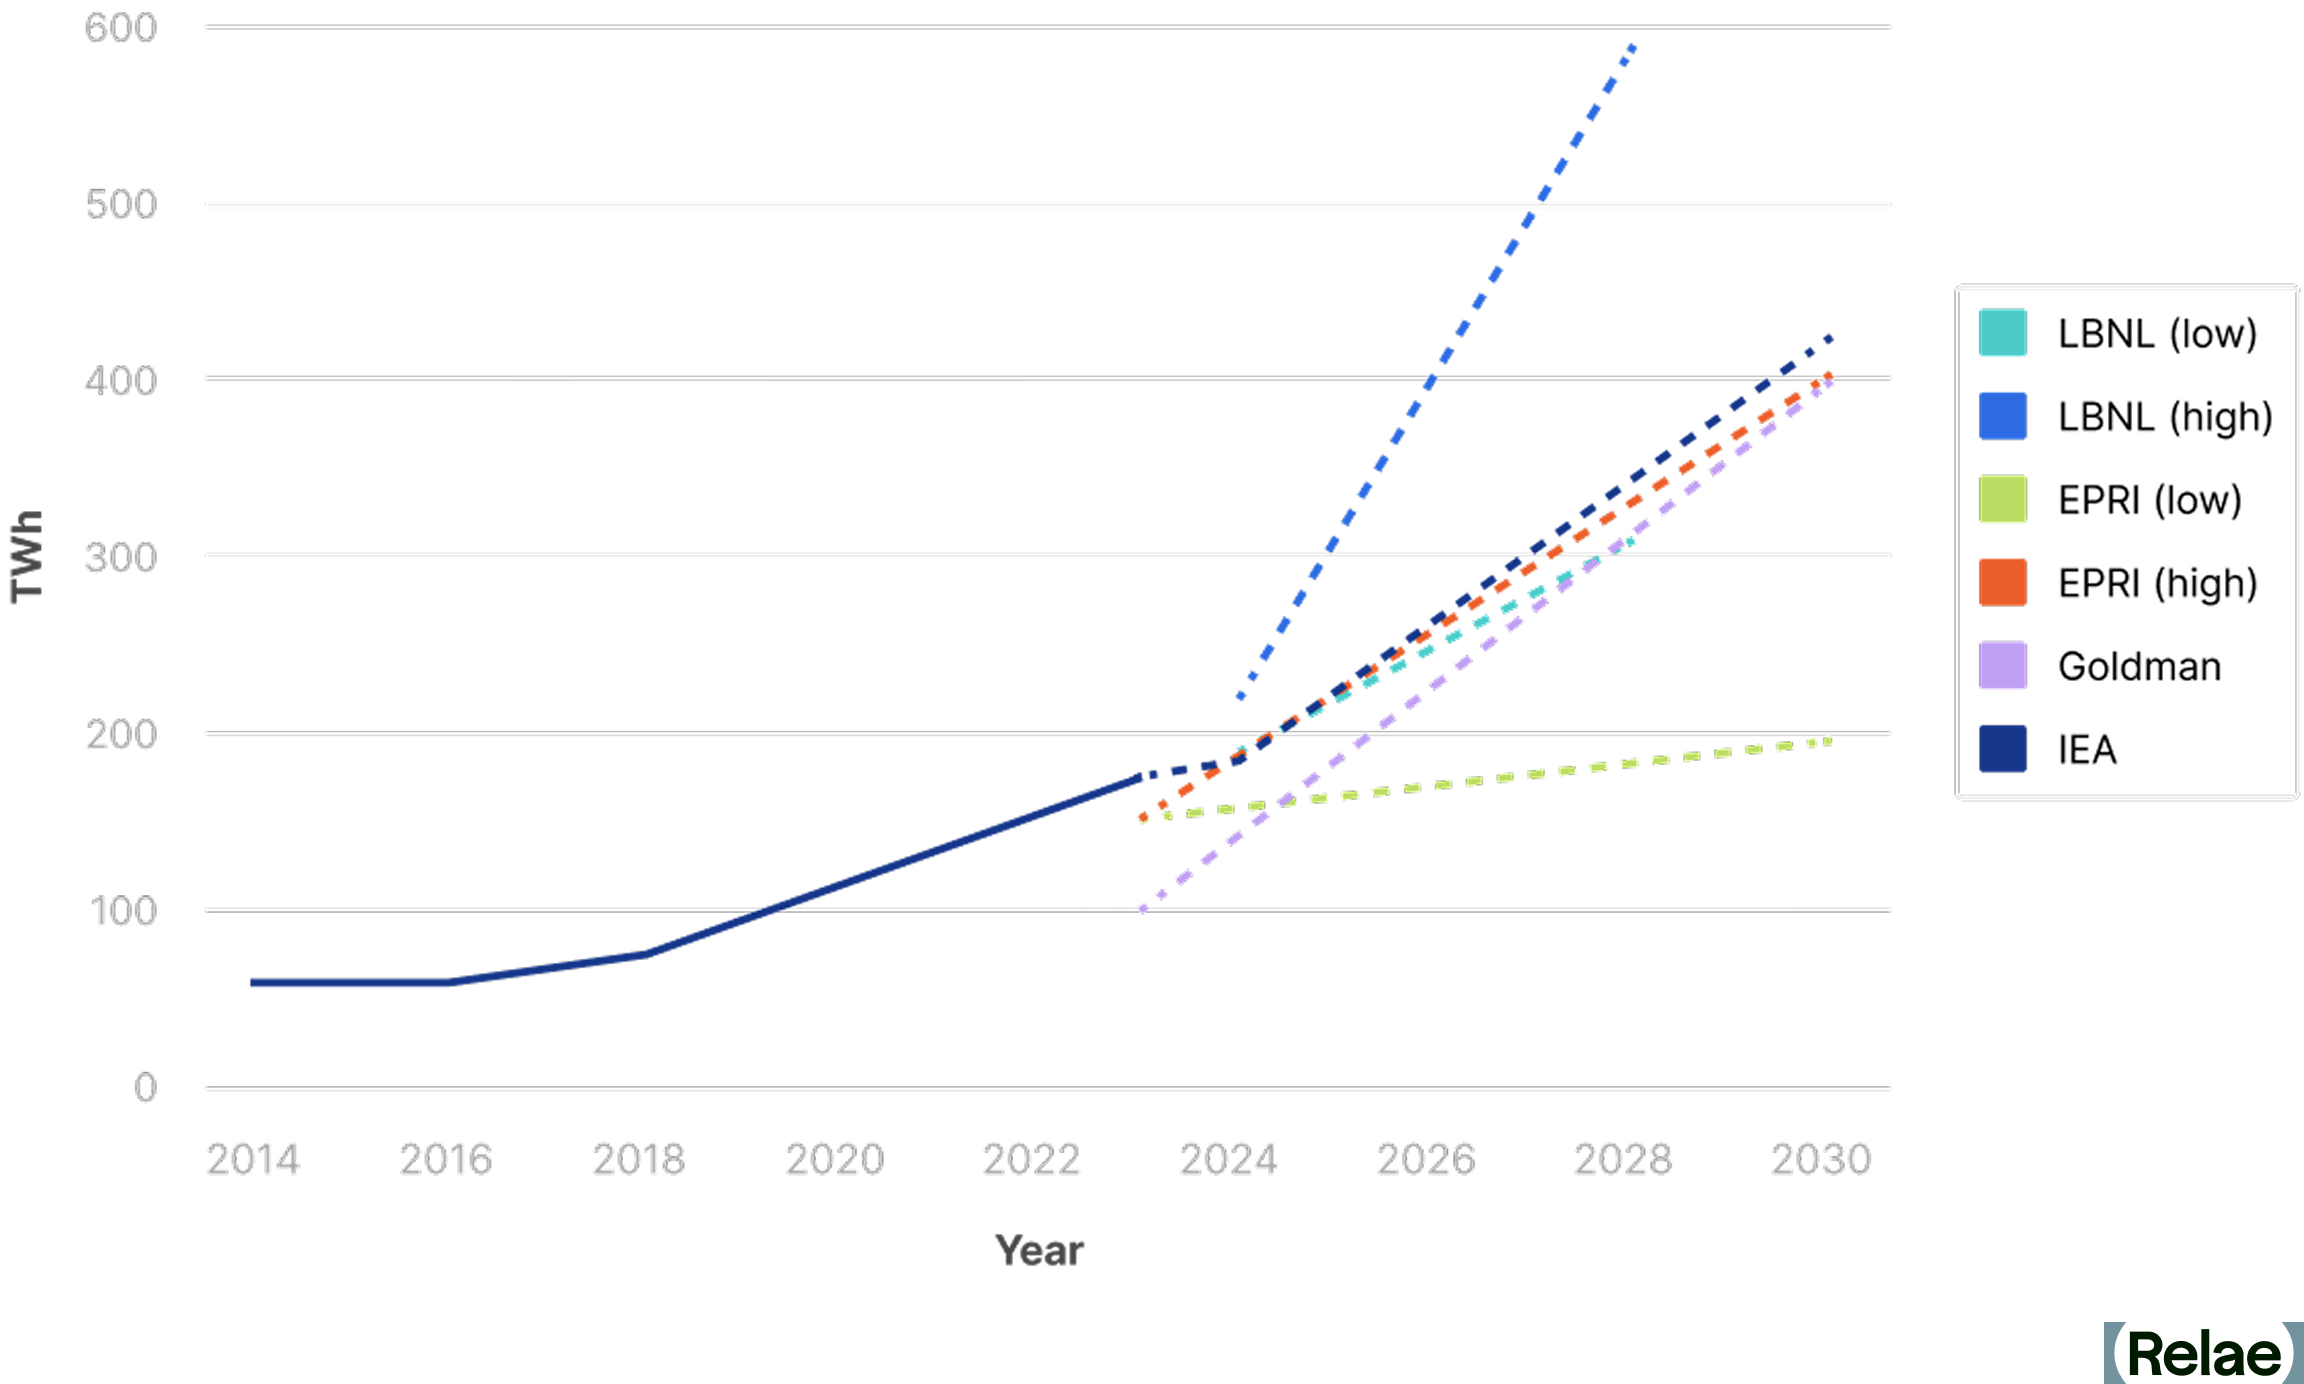
Rapid growth in electricity demand across the US, driven by AI data center expansion and increased industrial electrification, is placing significant pressure on power grids. After decades of stable electricity load, demand has increased significantly since 2022 and is expected to rapidly grow for the foreseeable future. Natural gas currently fuels around 40% of US electricity generation. Its share is expected to grow in the coming years. However, unabated natural gas generation is not compatible with stakeholder targets to reduce greenhouse gas (GHG) emissions. Combining CCS with natural gas-fired generation is one pathway to meet growing electricity demand and achieve GHG emission reduction targets.
[cta]
The Role of Natural Gas in Electricity Supply
Natural Gas Generation Versus Renewable Generation Deployment
Electricity generators can provide multiple products to regional grids, generally providing two services: energy (power production) and reliability (consistent availability). Natural gas-fired plants can provide both, whereas renewable energy sources like wind and solar generate energy but offer less reliability.
As electricity demand rapidly grows, grids will need both energy and reliability to function effectively. However, the interconnection queue for renewable energy assets has a years-long backlog which is delaying their deployment. Grids will need additional reliability assets to support the large amounts of renewables (usually in the form of storage). Some jurisdictions are creating an alternate pathway for natural gas plants to bypass the lengthy interconnection queue which may allow for the rapid development of natural gas generators. Hyperscalers are also pursuing development of large behind-the-meter (BTM) generation of electricity from renewable and fossil sources, but these must also meet high standards for reliability.
The Case for Carbon Capture Deployment
Electric utilities and developers of data center infrastructure are planning to build substantial new natural gas generation assets in addition to maximal deployment of renewable electricity. CCS technology enables natural gas plants to deliver stable, continuous power while significantly reducing emissions by capturing up to 95% of emitted CO₂. Natural gas plants with CCS are viable options to deliver the lower-emission, reliable power needed to respond to rapidly emerging AI data center power demand growth. The 45Q tax credit, a key government incentive for CCS, was preserved and effectively strengthened under 2025's One Big Beautiful Bill Act. The Google-Broadwing deal, the first major commercial deployment of this exact pathway, was signed in October 2025 and serves as a useful proof point.
Benefits of Integrating CCS into Natural Gas Power Generation
Integrating CCS into natural gas-fired power plants provides several advantages for data center stakeholders:
- Reduced carbon emissions: Achieve emission intensities of approximately 80–120 kg of CO₂ equivalent per megawatt-hour (CO₂e/MWh), significantly below the current US grid average of approximately 340–420 kg CO2e/MWh.
- Reliable baseload power: Continuous, predictable electricity delivery.
- Compact infrastructure: Requires less land compared to renewable energy projects, simplifying data center siting near existing infrastructure.
- Cost: CCS integrated with new natural gas-fired generation can deliver low-cost decarbonization. Relae estimates $75-150/MWh, which is competitive in many markets with other firm baseload options such as new nuclear power or wind and solar with battery backup.
Seven Key Considerations for Implementing CCS
Stakeholders considering CCS technology must carefully evaluate seven critical factors:
1. Meeting Rapid Deployment Timelines
Traditional natural gas plants can be operational within roughly 18 months, provided they bypass interconnection queues for reliability purposes and have access to key equipment. Integrating CCS technology extends this by an additional 18–36 months. Designing plants to be "capture-ready" allows for quicker initial deployment and smoother CCS integration in the future. However, deploying a capture-ready plant without a commitment to build the carbon capture portion is inconsistent with serious climate action.
2. Sizing Plants Optimally
CCS is most economically and environmentally optimal at natural gas plants with capacities of 100 MW or greater. It offers significant opportunities for emissions reductions for the forecasted new data center load. CCS is not suitable for smaller or highly variable natural gas plants.
3. Selecting Effective Carbon Capture Technology
CCS technologies such as solvents, sorbents, membranes, and oxyfiring vary significantly in maturity, efficiency, and cost. Choosing the right approach requires thorough evaluations aligned with specific project requirements. These will vary by setting and configuration (e.g., turbine class, reciprocating engines, number of units, water availability, etc.).
4. Navigating CO₂ Transportation Logistics
The safe and efficient transport of captured CO₂ via pipelines, rail, or barges is critical. Aligning infrastructure planning with overall project timelines prevents delays.
5. Ensuring Safe and Effective Sequestration
If there is no CO₂ storage, there is no project. Permanent CO₂ storage in Class VI injection wells requires detailed geological studies and regulatory permitting. Early collaboration with experienced sequestration operators is essential to success.
6. Conducting a Comprehensive Life Cycle Analysis
Full life cycle emissions analyses, including upstream methane leakage, construction impacts, and CO₂ transportation, are critical for accurate environmental assessments and ensuring low-carbon electricity supply. Prioritizing low-leakage, third-party verified natural gas supply enhances positive climate impacts.
7. Performing Siting Feasibility Early
An early and quick feasibility assessment is critical to identifying promising opportunities and key barriers at candidate CCS sites. Important factors include available transmission capacity, the potential to expedite approval of interconnection for thermal resources, regulatory barriers, state and local incentives, the sufficiency of natural gas infrastructure, and water supply.
Frequently Asked Questions
How much longer does adding carbon capture take compared to building a natural gas plant alone? Traditional natural gas plants can be operational within roughly 18 months, provided they bypass interconnection queues for reliability purposes and have access to key equipment. Integrating CCS technology extends this by an additional 18–36 months.
Is a "capture-ready" natural gas plant a legitimate climate strategy if the capture portion isn't committed yet? Designing plants to be "capture-ready" allows for quicker initial deployment and smoother CCS integration in the future. However, deploying a capture-ready plant without a commitment to build the carbon capture portion is inconsistent with serious climate action. “Capture committed” is a better stance than “capture ready”.
How does the cost of natural gas-fired power with CCS compare to nuclear or renewables with battery storage? CCS integrated with new natural gas-fired generation can deliver low-cost decarbonization. Relae estimates $75-150/MWh, which is competitive in many markets with other firm baseload options such as new nuclear power or wind and solar with battery backup.
Has any hyperscaler actually deployed natural gas-fired power with CCS at scale yet? The Google-Broadwing deal, the first major commercial commitment of this exact pathway, was signed in October 2025 and serves as a useful proof point. Others are in development.
[cta]
How Relae Supports Data Center Decarbonization
Natural gas-fired generation combined with CCS is a proven solution for meeting the urgent electricity demands of data centers while significantly reducing emissions. Relae helps stakeholders navigate the complexities of CCS deployment through deep, science-backed expertise and strategic advisory services. Our experienced team provides comprehensive support throughout CCS project planning and execution, including technology selection, life cycle emissions analysis, infrastructure assessment, project viability, regulatory compliance, and risk management.
SBTi Emphasizes Near-Term Carbon Removal in Revised Corporate Standard Draft
Key Takeaways
- Near-term role for carbon removals: The revised Science-Based Targets Initiative (SBTi) Corporate Net Zero Standard (CNZS) v2.0 proposes requiring or recognizing interim carbon dioxide removal (CDR) targets before companies reach net zero. This shift aims to scale up the CDR industry in line with climate science and ensure companies address residual emissions earlier rather than deferring action until their net-zero target year.
- Revised target frameworks and increased accountability: The draft standard introduces key changes, including separate targets for scope 1 and 2 emissions, enhanced scope 3 target-setting guidelines, and the recognition of market-based mechanisms for indirect mitigation of scope 3 emissions. It also requires companies to publicly disclose transition plans and assess implementation progress against targets.
- Potential for stronger action on removals: While the proposed updates are a step forward, the final standard should make near-term CDR targets mandatory rather than optional and should expand to include those for projected scope 3 residual emissions, not just scope 1. Without these stronger mandates, demand for early-stage CDR investments may remain limited, potentially slowing progress toward net-zero goals.
- Companies should prepare now: Businesses should start integrating CDR into their climate strategies now so they are equipped to navigate procurement of high-quality removal credits in the voluntary carbon market. Preparing ahead of the final CNZS v2.0 release will help companies align with science-based decarbonization pathways and demonstrate climate leadership.
What the Latest SBTi Update Means for Corporate Climate Action
On 18 March, 2025, the Science Based Targets Initiative (SBTi) released its draft Corporate Net Zero Standard (CNZS) v2.0, significantly updating its framework for corporate net-zero target setting for the first time since 2021. The draft proposes new approaches for companies to support carbon dioxide removal (CDR) in the transition to net-zero emissions, a move that could help scale the nascent CDR industry.
This release is part of a broader revision, with key proposed updates including:
- Requiring public disclosure of transition plans after companies set targets.
- Separating targets for scope 1 and 2 emissions.
- Enhancing the scope 3 target-setting framework using an impact-based prioritization process.
- Recognizing indirect mitigation (e.g., book-and-claim commodity certificates) for hard-to-trace scope 3 emissions.
- Defining a role for emissions removals in the transition to net zero.
- Providing options to recognize company leadership in beyond value chain mitigation (BVCM).
- Assessing corporate progress against targets to bolster accountability.
While formal recognition of removals in the transition to net zero is a positive step, stronger incentives will be needed in the final CNZS to ensure companies take meaningful early action on CDR. The draft standard is open for the first of two public consultations until 1 June, 2025, with a finalized version expected to launch in 2026.
What Remains the Same From the Current Standard?
SBTi’s framework remains focused on three core requirements for companies:
- Reducing emissions year-on-year to reach an approved science-based target (SBT) by 2050 or earlier.
- Investing in beyond value chain mitigation (BVCM) in the transition to net zero to support near-term global decarbonization efforts.
- Neutralizing remaining emissions from the net-zero year (achieved after at least 90% emissions reductions) and onwards with high-quality, permanent carbon removal.
Carbon credits representing emissions reductions and removals remain ineligible for meeting reduction targets within a company’s value chain (SBTs).
What’s New in CNZS v2.0 for Carbon Removals?
Until now, the SBTi encouraged companies to invest in CDR through mechanisms such as BVCM, but has not proposed requiring removal before their target net-zero year. As a result, organizations had little clarity or incentive to invest in CDR ahead of their net-zero target date, dampening near-term demand for carbon removal and delaying the industry's growth.
The new draft changes this by proposing three options for the V2.0 Standard that address the impact of residual emissions during the transition to net zero:
- Option 1 (requirement): Companies are required to set near- and long-term removal targets, including interim CDR milestones,¹ to address projected residual emissions.
- Option 2 (optional with recognition): Companies can set and receive recognition for removal targets to address projected residual emissions.
- Option 3 (flexibility of mechanism): Companies have the flexibility to address expected residual emissions either entirely through additional emissions reductions within their value chain, entirely through removals, or via a combination of both.
Notably, all three approaches apply only to residual scope 1 emissions.
On top of these approaches, SBTi has suggested two options for the minimum durability threshold of CDR purchases in their draft standard. Removals will either need to follow a ‘like for like’ approach,² where CDR storage must match the atmospheric lifetime of residual emissions, or a gradual transition approach, where carbon storage durability increases over time.
Why Mandating CDR Matters
Mandating near-term CDR reinforces the need for immediate climate action, ensuring that carbon removals complement emissions reductions rather than being deferred until the net-zero target year. The urgency of early CDR investment is clear:
- Limiting global warming to well below 2°C above pre-industrial levels requires removing billions of tonnes (gigatonnes) of carbon dioxide annually by mid-century.
- The CDR industry is in its early stages and requires sustained investment today to scale in time.
- If companies wait until their net-zero year to purchase CDR, the supply of high-quality removal credits is unlikely to be sufficient.
As part of the proposed removal targets in Option 1 (above), the CNZS v2.0 would require companies to gradually increase CDR purchases over time, ramping up to 100% of a company’s projected residual scope 1 emissions in the net-zero target year (<10% of baseline year emissions).³
What More Can Be Done?
The potential introduction of required removal targets would be a significant and welcomed step, reinforcing the importance of near-term CDR investment to support industry maturation and climate goals. However, mandatory near-term CDR targets represent only one of three potential pathways for the V2.0 standard. Moreover, neutralization of residual emissions on the path to net zero is only proposed for scope 1 emissions. While the SBTi provides clear rationale for this,⁴ SBTi should not let the complexity of projecting scope 3 emissions be a barrier to climate change mitigation. Scope 3 emissions represent the majority of emissions from SBTi-aligned companies. Furthermore, companies with high scope 3 emissions typically have a higher ability to pay compared to their industrial counterparts with high scope 1 emissions.
If interim removal targets are made optional, and scope 3 emissions remain excluded, the demand signal for near-term CDR will be limited. The public consultation (and advice of Expert Working Groups that SBTi is convening) will be essential in determining which proposed guidance matures into the final standard; consultation feedback can be provided here prior to June 1, 2025.
How Businesses Can Prepare for CNZS v2.0
Companies aligning with SBTi’s evolving guidance should begin to integrate CDR into their climate strategy now. This means:
- Understanding their residual emissions forecast and planning early investments.
- Developing a company-specific climate strategy to incorporate CDR into their sustainability roadmaps in tandem with plans to reduce value-chain emissions.
- Engaging early in the voluntary carbon market to implement these strategies and develop procurement processes to support high-quality removal projects.
- Ensuring credibility by selecting removal projects aligned with scientific best practices.
Conclusion: A Step in the Right Direction, But More Certainty Is Needed
The CNZS v2.0 draft represents a critical turning point for corporate climate action with options to formalize the role of early CDR investment through interim removal targets for signatories. However, SBTi must take a stronger stance in the final version of the revised standard by choosing to adopt requirements for near-term neutralization (rather than leaving this optional), including projected residual scope 3 emissions in near-term CDR targets, aligning durability requirements with climate science, and defining removal quality standards to ensure these efforts drive meaningful climate impact. Organizations seeking to align with this guidance should prepare by developing a comprehensive climate strategy that accounts for science-based decarbonization pathways and recognizes the role of early-stage investment in CDR solutions.
Understanding the Carbon Footprint of AI and How to Reduce It
Key Takeaways
- AI's carbon footprint has two distinct parts: embodied emissions from building data centers and operational emissions from running them, both accelerating as global data center electricity use is set to double by 2030, and AI-focused use to triple.
- Managing that footprint will require deliberately steering technology architecture, power sourcing, and materials choices, instead of leaving them to react to demand after the fact.
- Eight concrete strategies, from smarter chip design to firm clean power and carbon removal, can cut AI's footprint today, without waiting on new regulation.
- US data centers used 4% of the USA's total electricity in 2024, and are projected to use as much as 15% by 2030.
Introduction
The rapid growth of artificial intelligence (AI), particularly large-language models (LLM) and generative AI, has taken many by surprise. This surge has led to escalating electricity demands at data centers and raised concerns about the strain on the power grid. It has also sparked the construction of new, larger data centers, resulting in growing embodied emissions tied to building and maintaining AI physical infrastructure.
Managing the risks of increased greenhouse gas (GHG) emissions from AI requires investment, expertise, and new approaches to building and operating many aspects of AI operation and supply chains. The immediate task is to understand these risks, gather the necessary information, and to avoid poor outcomes by proactively managing construction, operation, and emissions associated with the growth in AI. In parallel to that work, it's important to recognize that AI can itself be a real force to reduce emissions incrementally and dramatically across a wide range of sectors.
What Is the Carbon Footprint of AI?
The carbon footprint of AI consists of two main parts: "embodied" emissions that come from manufacturing IT equipment and constructing data centers, and "operational" emissions that come from electricity consumed by servers, memory and networking equipment as they perform AI-related calculations. Both of these aspects of emissions are growing as more data centers are built and existing data centers increase their share of power-hungry AI applications like generative LLM searches, AI agents, and AI image generation.
Understanding Electricity Demand for Data Centers
Today, the electricity demand from AI-specific applications is estimated to be less than 1% of global electricity use. To understand this number, it helps to start with the electricity consumed by the 12,000+ data centers worldwide, which was about 1.5% of global electricity consumption in 2024. (This excludes another 0.4% from cryptocurrency mining.) However, most of the computation at these data centers is not AI; instead, it's more conventional applications like e-commerce, video streaming, social media, and online gaming.
The amount of AI-based computation at data centers is hard to determine, but AI-dedicated accelerated servers consumed about one third of overall data center electricity in 2025, or roughly 0.5% of global electricity. Notably, this is projected to grow at 30% annually, much faster than conventional (non-AI) data center electricity use. However, that electricity use results in a relatively small share of greenhouse gas emissions: about 0.5% of global fuel combustion emissions, with AI data centers representing only a small portion of that value.
Still, the demand for AI applications is rapidly growing, and this is likely to drive up the electricity used by data centers and the associated greenhouse gas emissions. The most important implications of this trend are in the US, which hosts about half the world's data centers. Currently, data centers use about 4% of US electricity, but projections for the future range from a low of 9.5% to a high of 15.3% in 2030.
[cta]
How Electricity Sources Impact Data Center Emissions
A large increase in electricity use doesn't necessarily result in a similarly large increase in greenhouse gas emissions. Currently, a significant portion of the electricity powering data centers comes from zero-carbon sources such as wind and solar. This is partly because of large, corporate power-purchase agreements (PPAs) signed by leading data center operators, particularly Amazon, Meta and Google.
US technology companies have been buying renewable energy for years. Global corporate clean energy procurement hit a record 62 GW in 2024, then fell to 55.9 GW in 2025, the first annual decline in nearly a decade, as elevated power prices and policy uncertainty made even large buyers more selective. Meta, Amazon, Google, and Microsoft still accounted for roughly 49% of global clean energy procurement in 2025, with Meta and Amazon alone securing 20.4 GW combined, including 4.7 GW of nuclear power.
The use of low-carbon power means that the net emissions from these data centers is smaller than the electricity consumption numbers might suggest. Of course, a crucial consideration is whether this low-carbon power is truly "additional," meaning that it is being added to the grid and not simply taken away from other uses. Data center operators are also expanding beyond their traditional wind and solar PPAs by exploring novel approaches to try to meet this standard, including geothermal projects in the US and Taiwan.
However, the projected electricity demand from AI applications at data centers will be difficult to meet entirely with low-carbon power, at least in the near term. Despite installing over 43.2 GW of wind, solar and battery projects in the US in 2025, these generators face a long wait for interconnection approval in many parts of the country. Geothermal and hydro power, which offer steady ("baseload") low-carbon electricity, remain constrained in the near term. And the interest in scaling up nuclear power, from restarting full-scale reactors to novel small modular reactors (SMRs), faces significant regulatory, cost, and supply chain hurdles.
One important source of low-carbon electricity that has not received enough attention is natural gas-fired power equipped with carbon capture and storage (CCS). This technology has the potential to significantly reduce emissions from existing power plants and enable new projects to achieve near-zero emissions.
The Role of Embodied Emissions in Data Center Construction
Embodied emissions include all emissions associated with the extraction, production, transportation, construction, and disposal of materials used in construction.
The embodied emissions from constructing data centers are substantial, and include concrete, steel, and IT hardware. Scope 3 GHG emissions for data centers—which include embodied emissions—range from approximately one-third to two-thirds of overall lifetime emissions. At Microsoft, Scope 3 emissions made up about 86% of the company's total FY2025 footprint and grew roughly 12% year over year, with capital goods driving most of that increase. In FY2024, capital goods alone accounted for about 41% of Microsoft's Scope 3 emissions, and purchased goods and services (including IT hardware) accounted for another 34%. In response, Microsoft has started using wood in some data center construction to reduce this impact. While using wood offers a partial solution, it cannot fully offset the emissions of even a single facility, and wood supply chains remain limited.
Major data center operators are working hard to address this challenge, including emphasizing the need for standardized emissions measurements and disclosures for key building materials. Ultimately, achieving deeper decarbonization will require further action to address both operational and embodied emissions.
Eight Strategies to Reduce the Carbon Footprint of AI
1. Adapt Technology Architecture
Efficiency is the foundational strategy in any clean energy approach. As such, chipmakers are developing ways to cut energy use from the outset, such as incorporating more memory directly onto computer chips or hard-wiring basic calculations. These innovations have already reduced energy consumption in new computer chips substantially, in some cases a 96% improvement. Examples of this include NVIDIA's Blackwell platform and the company's newer Rubin platform, launched in 2026, continues that trajectory. Likewise, servers are being designed with new architectures that minimize internal data transfers, delivering additional efficiencies. Even more efficiency gains may be possible with emerging technologies like photonic computing.
2. Optimize Training Geography
There are also significant opportunities to manage AI's energy use through time and space optimization. For example, a large portion of the energy consumption for LLMs occurs during the training phase, prior to a model's deployment for inference. Because these training tasks are not location-dependent, they can be carried out in regions with abundant, low-cost, low-carbon electricity, as part of broader efforts to dynamically move computing tasks to reduce emissions, known as carbon-aware computing. Additionally, server requests for generative AI tasks, like ChatGPT searches, can potentially be routed through systems powered by low-carbon electricity. Although this may add only a few milliseconds of latency, it could substantially reduce emissions from computing operations.
3. Select Appropriately-Sized Models
Not all generative AI tasks, like ChatGPT queries, are equal in terms of energy demand. Leading AI companies are increasingly focusing on using smaller, more efficient AI models to perform these tasks, achieving nearly equivalent quality for far less energy consumption. A notable recent test of that idea came in January 2025, when China's DeepSeek released a model with competitive performance that was trained using less powerful chips and far fewer computing hours than its established rivals. Similarly, many AI applications, such as digital twinning and satellite-based pattern recognition, consume far less electricity than generative LLMs, because of their specialized, relatively efficient models. This can even save energy compared to non-AI approaches: for example, some of the most advanced AI-driven weather prediction models require far less energy than traditional weather simulations, running on a laptop rather than a supercomputer.
4. Address Fugitive Methane Emissions
As data center operators increasingly plan on using natural gas for new electricity supply, reducing upstream emissions from gas production and transmission will be crucial. In the U.S., the Environmental Protection Agency (EPA) 2024 Methane Rule was designed to cut these non-carbon dioxide greenhouse gas emissions by approximately 80%. However, Congress repealed the rule's methane fee in 2025 and barred the EPA from collecting it until 2034. The EPA has since extended compliance deadlines and loosened flare and vent-gas requirements, with litigation over those changes still ongoing. Meanwhile, tools from companies like Kayrros and organizations like Carbon Mapper help detect methane leaks and attribute them to specific operators. The best actors in the industry emit minimal methane, less than 0.5% of what is produced. This standard is achievable for nearly all gas producers.
5. Use Carbon Capture on Power Plants
For both new and existing natural gas-fired power plants, carbon capture and storage technology offers the potential for generating firm, low-carbon power. While many plants currently in operation continue to emit unchecked, this doesn't have to be the case: their emissions can be captured and securely stored geologically. Hyperscalers and project developers should pursue new investments and business models for CCS to reduce existing emissions by 95% or more. For new generation projects, options like NetPower, Arbor, and CES will soon enable emissions abatement of 100%, or even more if combined with biopower to deliver carbon dioxide removal as well. Achieving this will require the development of carbon dioxide pipelines, barges, and storage facilities, which face their own challenges, such as permitting and community approval, that must be addressed directly.
6. Add More Zero-Carbon Power to the Grid
Roughly 8,200 solar, wind, and battery projects in the U.S. are seeking grid interconnection. By the end of 2025, the interconnection queue held roughly 2,060 GW of proposed generation and storage across thousands of projects, and its composition shifted meaningfully. Solar, wind, and storage volumes in the queue all declined year over year (although remained at high absolute levels) while natural gas capacity in the queue grew by 86%. Our blog post, The $5.5 Billion-Dollar Case for Enabling Data Center Load Flexibility, covers one way hyperscalers are working around the wait rather than simply enduring it. These delays need to be addressed, and permitting reform remains an unresolved, live debate. The Manchin-Barrasso bill, which once looked likely to pass, was tabled in December 2024 and never became law. As of 2026, no comprehensive federal permitting law has replaced it. One potential innovation is to use AI to accelerate the development of power flow models and streamline the paperwork required to complete the regulatory process.
7. Invest in Low-Carbon Building Materials
While wood is a promising low-carbon building material, we'll also need glass, concrete, steel, aluminum, and computer chips with minimal embodied carbon emissions. Hyperscalers currently face significant challenges accessing low-carbon versions of these materials, which will eventually be produced using low-carbon hydrogen, carbon capture and storage, and low-carbon electricity. However, these systems require significant investment, workforce development, and permitting to be built. Without these advancements, the embodied emissions from data centers will increase rapidly and significantly in the US, Europe, and globally.
8. Increase Carbon Dioxide Removals
It's already clear that AI applications at data centers will generate emissions from electricity use and embodied carbon that cannot be avoided in the near term. Estimates of current greenhouse gas emissions exceed 300 million tons per year and are likely to grow this decade. These emissions should be measured using full life-cycle analysis and then offset through high-quality carbon removal projects, preferably those with high durability.
To effectively reduce the environmental impact of AI, all eight strategies discussed must prioritize the communities most affected: frontline communities near new infrastructure, consumers facing price increases, and tribal authorities with limited legal protections. Our own research on community opposition to AI data centers found that transparency, not cost or environmental impact alone, is the dominant driver of pushback across 46 stalled or blocked projects. We explore this concern further in our blog, Who Pays for the AI? The Hidden Costs of Rising Data Center Demand, including how ratepayers, not just data center operators, often absorb the cost of new grid infrastructure. Planning should begin by understanding the needs of these communities, ensuring that efforts focus on minimizing harm while maximizing benefits. Equity and justice must be embedded in every stage of planning, production, and permitting across all strategies.
AI's Power Demand Is Indicative of Broader Electricity Demand
AI is just one part of a broader trend of rapidly growing electricity demands, including from electric vehicles, heat pumps, industrial electrification, green hydrogen, and various e-fuels. The challenges AI presents to hyperscalers, communities, regulators, and investors serve as a preview of the complex, far-reaching impacts emerging in other sectors. The same questions keep recurring. Who secures reliable, affordable power fast enough? Who ends up carrying the cost and emissions burden of getting there the wrong way?
Managing AI's power demand will require building the technology architecture, clean firm power supply, and materials strategy to meet that demand deliberately, rather than reactively. AI's carbon footprint underscores the critical need for expertise in clean electricity, grid management, decarbonization, and carbon removal—expertise that will become increasingly vital as more companies realize the complexity and cost of the journey ahead.
Fortunately, AI itself can be part of the solution. With applications in grid management, material science, and advanced manufacturing, AI has the potential to play a powerful role in the climate response.
Read the full 2025 report: ICEF Sustainable Data Centers.
Frequently Asked Questions
How much electricity do AI data centers actually use?
AI-specific computation likely accounts for around 0.04% of global electricity use today, but data centers overall (most of it non-AI computation) used about 1.5% of global electricity in 2024. In the US, which hosts roughly half the world's data centers, Lawrence Berkeley National Laboratory puts current usage at 4% of US electricity, projected to reach 9.5-15.3% by 2030 as AI-specific demand grows.
Will more efficient AI models like DeepSeek reduce data center energy demand?
Not necessarily. DeepSeek's 2025 debut showed that competitive models can be trained with less powerful chips and fewer computing hours, but whether that translates into lower total energy demand is contested. Historically, efficiency gains in computing have tended to get absorbed by increased usage rather than reducing total consumption, so the honest answer is that it depends on whether demand growth outpaces the efficiency gained.
What is being done about the embodied emissions from building AI data centers?
Embodied emissions, from concrete, steel, and IT hardware, can account for one-third to two-thirds of a data center's lifetime emissions. Strategies include using lower-carbon materials like wood where feasible, developing low-carbon concrete, steel, and chips, and standardizing emissions disclosures for building materials so operators can compare and choose lower-footprint options.
How to Measure Your Carbon Emissions
Key Takeaways
- Inventory before you calculate: carbon accounting means collecting activity or spend data across scope 1 (direct), scope 2 (purchased energy), and scope 3 (value chain) emissions for a full year of operations, then converting the results into CO2e using GHG Protocol-aligned emission factors.
- Measurement matters even as rules shift: disclosure requirements like California's SB253 and the EU's CSRD keep evolving, but many companies measure and report emissions voluntarily anyway, to set a baseline for climate targets and meet investor and customer expectations.
- Scope 2 is getting more complex: rising electricity demand from AI and data centers, combined with upcoming GHG Protocol changes to how renewable energy purchases are counted, make an accurate, current scope 2 measurement more valuable than ever.
- Verify before you report: independent review, internal or external, catches errors like double counting and miscategorization before emissions data goes to stakeholders or regulators.
- Annual measurement is what makes the strategy real: repeating the process every year turns a one-time emissions snapshot into a carbon management plan you can track, report, and act on over time.
What Is the Carbon Accounting Process?
Carbon measurement, or carbon accounting, is the process of estimating the greenhouse gas (GHG) emissions from business activities by taking an inventory of a company’s operations. The process calculates greenhouse gas emissions, measured in metric tonnes of CO2 equivalent (CO2e), to provide a holistic picture of emissions over an entire year of operations.
Why Measure Your Greenhouse Gas Emissions?
Climate disclosure regulations continue to shift. California's SB253 is now active law, with an initial scope 1 and scope 2 reporting deadline in November 2026. The EU's CSRD remains in effect, though 2026 reforms narrowed which companies fall under it. In the US, the SEC's 2024 climate disclosure rule is now the subject of a formal rescission proposal. Even as these rules evolve, many companies continue to measure and report emissions voluntarily to meet investor and customer expectations.
Scope 2 accounting for purchased electricity is entering its own period of change. AI and data center growth is driving unprecedented demand on the grid: NERC's January 2026 Long-Term Reliability Assessment projects North American summer peak demand rising 24% (224 gigawatts) over the next decade, with new data centers cited as the primary driver. At the same time, the GHG Protocol is revising its scope 2 guidance toward hourly, regional matching of renewable energy purchases, with final standards expected by 2027. A clear, current measurement of your scope 2 emissions puts you in a stronger position to adapt your electricity and renewable energy strategy as these rules take shape.
Measuring emissions also provides a baseline for setting climate targets and deciding where to start reducing emissions. Repeating the measurement process annually allows you to track and report progress in a clear, transparent way to ensure that stakeholders—regulators, employees, investors, and customers—are informed about your climate action and impact.
How to Measure Your Carbon Emissions
Step 1: Collect Data
A company’s emissions represent the greenhouse gases emitted from everyday activities such as heating an office, shipping merchandise, traveling to a conference, or producing a physical product.
Emissions Sources: Scope 1, 2, and 3
To calculate your organization’s carbon emissions, you’ll need to collect data from all emissions-generating sources. These sources are divided into three categories, defined by scopes, according to the GHG Protocol:
- Direct emissions (scope 1): Produced from owned or controlled sources such as fuel purchased and consumed onsite for operating facilities and vehicles.
- Indirect emissions (scope 2): Generated from purchased energy such as purchased electricity for powering offices and facilities.
- Value-chain emissions (scope 3): Generated from the direct and indirect emissions from upstream and downstream value chains including purchased goods and services, business travel and employee commutes, and investments.
Types of Emissions Data
For all three emissions categories, there are two broad types of data to collect: activity data and financial spend data:
- Activity data uses units of measurement associated with the emissions-generating activity. For example, the liters of fuel consumed in a year, or the number of kilowatt-hours of energy used.
- Financial spend data, typically sourced from accounting teams and software systems, is used to estimate emissions from spending. Financial spend data may, for example, use the amount spent on business travel to estimate emissions.
Sourcing both activity data and spend data typically requires the help of a range of stakeholders across an organization. For example, facilities and office managers may provide fuel and electricity bills, while a company’s accountant may provide financial data.
While both approaches are valid under the GHG Protocol, there can be costs and benefits to the organization associated with different data sources and methodologies. You must weigh these carefully before aligning on an approach. Not all companies have the data infrastructure in place to support activity data across all of the scopes. While spend data is generally more accessible, it may not deliver a complete picture of emissions reductions—for example, if a company’s employees traveled fewer miles this year than last, but spent more on flights, using a spend data approach might result in an overestimate of emissions compared to an activity data approach.
Step 2: Calculate Your Emissions
To start calculating your emissions, you’ll need to determine the emission factor—the ratio between pollutants emitted and activity conducted or amount spent. For example: Because a gallon of gasoline emits 8.78 kg of CO2 when burned in an engine, the emissions factor would be 8.78 kg CO2 per gallon of gasoline.
Emissions factors are then multiplied by the associated activity or spend data, and the results are summed to estimate a company’s total emissions. To ensure consistent year-on-year reporting and auditability, the emissions factors used should be carefully documented and aligned with the GHG Protocol.
Step 3: Verify Data and Report Your Results
Once calculations are ready, the final step is to verify your information. Have a second internal team or an external expert carefully review the data to check for gaps and ensure it is correctly categorized by emissions source. This can help avoid errors like double counting and miscategorization. Under certain reporting requirements such as CSRD, an external audit is required.
Once data is verified, you can report your findings to internal stakeholders, and disclose it externally if you choose. This information should be presented in a clear, consistent format that includes both emissions data and final calculations broken down by source, as well as links to relevant data to back up your claims.
Step 4: Take Action and Track Progress
Now that you’ve reported the results, your internal stakeholders will be armed with the data they need to do the most critical next step: Set climate targets and take action. Reporting carbon emissions estimates establishes the climate impact of your business activities, allowing you to set realistic, informed targets.
From there, you might compare your total emissions with your competitors and identify your top emissions sources. Reports also help you identify the most achievable reduction opportunities and consider how to address your harder-to-abate emissions, helping you develop a comprehensive carbon management plan.
The carbon accounting process doesn’t stop once you’ve set your plan in motion: Tracking progress requires ongoing emissions measurement to produce annual emissions reports. Action coupled with ongoing carbon measurement is the foundation of an integrated carbon management strategy: It’s what allows you to assess, adapt, and optimize your sustainable transition plan. This gives you the data you need to see and prove your long-term progress, and confidently share your results with customers and investors.
[cta]
Carbon Removal, Reduction, and Avoidance Credits Explained
Key Takeaways
- Trust in carbon credits remains low. In part, this is because many mistakenly treat every credit type as interchangeable.
- Reduction, removal, and avoidance credits are verified against fundamentally different baselines, so credit quality must be judged based on type and project specifics, never with one blanket standard.
- The Integrity Council for the Voluntary Carbon Market's Core Carbon Principles now give buyers an independent bar to check against, including 44 methodologies approved across 13 eligible crediting programs, as of August 2026.
- Removal credits still make up only 5–6% of the market, even as compliance-driven demand accelerates, per our 2026 State of the Voluntary Carbon Market report.
Three Types of Carbon Credits: Reduction, Removal, and Avoidance
A carbon credit is a mechanism that allows one party to compensate another for their carbon mitigation activities. Based on their net emissions impact, there are three types of carbon credits: reduction, removal, and avoidance.
- Reduction credits reflect activities that decrease greenhouse gas emissions, compared to prior practices.
- Removal credits reflect activities that remove carbon dioxide already present in the atmosphere and oceans and lock it away for decades, centuries, or millennia.
- Avoidance credits reflect activities that prevent greenhouse gases from being emitted in the first place. For all three types, credits are assessed and issued by measuring or estimating how much carbon is reduced, removed, or avoided as a result of a credit purchase and its associated activities.
While credits are assessed in different ways depending on the type, one of the most important indicators of quality is a project's baseline - the emissions that would be present in a business-as-usual scenario, without action being taken to reduce, remove, or avoid them. Project developers use baselines as a means of comparison to assess the net emissions impact of a project.
- Baselines must be accurately set and data-driven.
- Emissions impacts of a project must be correctly calculated against its baseline.
Reduction, removal, and avoidance projects involve very different activities and, for some types of projects, it may be more challenging to establish an accurate baseline. However, without accurate baselines, climate impacts cannot be reliably determined.
Across the voluntary carbon market, Reduction credits represent roughly 20% of the purchases. Removal credits represent roughly 5% of the purchases. The remainder, roughly 75%, are avoidance credits.
Carbon Reduction Credits
Carbon reduction must drive the majority of our push to net zero, but translating carbon reduction activities into carbon credits that can be purchased is challenging. Examples of activities represented by carbon reduction credits include reducing fossil fuel use by improving fuel efficiency, or programs that reduce the methane that is generated from farms or municipal waste processing.
Reduction credits are measured and quantified against the baseline emissions of an existing technology or process. Some reduction credits are easy to track and measure, such as efficiency investments or destruction of fugitive methane. Other projects are more complex. For example, low-emission cookstove projects in developing regions rely on tracking patterns of cookstove use and quantifying emission factors for various fuel and stove combinations, both of which are hard to do. The result, as studies have shown, sometimes leads to overcrediting in reduction projects.
Superpollutant Credits
One class of reduction credit, superpollutant credits, has garnered recent attention. These credits involve the reduction of non-CO2 greenhouse gases with very strong radiative forcing, such as methane, nitrous oxides, or fluorinated gases like chlorofluorocarbons. These are not a substitute for CO2 removal, but can provide rapid and profound reductions at modest cost. Many different kinds of superpollutants exist in today’s market, worth roughly $60M today. Recent purchases by tech companies and others have highlighted the potential of these reduction credits.
Another class of reduction credit, transition credits, involves the deliberate early closure of emitting assets like coal-fired power plants or heavy manufacturing facilities. Early efforts by governments, banks, and companies around the world under the Just Energy Transition Partnership agreement jump-started transition credits as a concept at COP26. The Kinetic Coalition, in partnership with many groups including Relae, has launched work to bring transition credits to market with several pilot efforts, including closing a coal plant in the Philippines 10 years early.
Carbon Removal Credits
Projects that remove carbon come from a diverse set of solutions, from nature-based solutions like reforestation, to hybrid solutions like biochar, to engineered solutions such as direct air capture and storage. Roughly 5–6% of credits on the voluntary carbon market today are classified as removals, up from roughly 3% a few years ago.
Carbon removal baselines are determined differently depending on whether a project uses an engineered, hybrid, or nature-based solution. For engineered removals, the baseline is zero, because no carbon removal was occurring in the absence of the project. The credited removal will be the difference between the quantity of carbon removed and any emissions that occur to facilitate the removal (determined through a carbon credit life cycle assessment). Baselines for hybrid and nature-based removals can be more challenging. In natural systems, changes in carbon stocks created by removals must be measured and approximated over time, and creditable removals represent the additional carbon removed by the intervention relative to the baseline (e.g., fallow land versus a reforestation project).
Another important consideration for carbon removal credits is project durability, a measure of the likely duration of carbon storage. Stored carbon can re-enter the atmosphere either through deliberate actions (e.g., deforestation) or accidental ones (e.g., wildfires). Nature-based removals are especially vulnerable to being re-released and are usually considered less durable (i.e., stored for less than 50 years). In contrast, engineered solutions offer high durability (i.e., stored for hundreds to thousands of years), and hybrid removals also offer durability periods that are typically longer than those of nature-based removals.
While less durable, nature-based solutions are effective, cost-effective, and widely available today. They made up over 95% of all carbon removal credits issued in 2025. Engineered and hybrid solutions are more expensive and scarce but offer longer durability. Prices of engineered carbon removal are likely to fall with innovation and increased market participation, but are currently much higher than most nature-based credits. With SBTi's finalized Corporate Net-Zero Standard V2.0, this balance is likely to shift. Large companies must now purchase removal credits covering 1–100% of scope 1, scope 2, and scope 3 emissions between 2035 and their net-zero year, with an explicit focus on more durable CO2 removal credits.
Carbon Avoidance Credits
Examples of carbon avoidance include avoiding deforestation that would result in the release of carbon dioxide into the atmosphere or clean energy projects that avoid the release of emissions from burning fossil fuels in possible facilities. This can be confusing, since many avoided credits are called reduction credits, as is the case with projects under the Reducing Emissions from Deforestation and Forest Degradation (REDD+) framework. Avoidance credits make up roughly 75% of certified credits on the voluntary carbon market today - an overwhelming majority - in part due to high availability and low price.
Avoiding emissions is an important goal with numerous environmental, climate, community, and other benefits. Relae works with clients and customers across industries on developing and implementing strategies to avoid emissions within their value chain. However, there are significant challenges with the way that many carbon avoidance credits are created.
- Carbon avoidance credits are based on an estimate of the emissions that might have existed had a project not been funded. Because it is impossible to observe what might have happened in the absence of a project, carbon avoidance estimates are determined by considering historic data and contextual information. Statistical models can be used to create a presumed baseline that represents what would have happened in the absence of the project.
- Because the baseline is not observed in an avoided emissions project, there is uncertainty in calculating the number of carbon credits it produces. If the baseline is not set accurately, a project can overcredit. While the lack of a directly observed and measured baseline means avoidance credits will always have some degree of uncertainty, high-quality avoidance projects present compelling evidence to support their baselines, greatly reducing uncertainty.
New datasets, statistical techniques, and methodologies are providing opportunities for developing avoidance credits with more certainty. Three REDD+ methodologies have now cleared the Integrity Council for the Voluntary Carbon Market (ICVCM) assessment for its Core Carbon Principles (CCPs), a concrete sign that credit quality standards for avoidance projects are maturing.
Defining and Standardizing Quality in the Voluntary Carbon Market
Carbon credits are intended to reduce, remove, or avoid emissions. They pay for an environmental service that must be delivered. Companies working to generate climate benefits through credit purchases must grapple with the differences and uncertainties of credit quality to ensure that the intended benefits are realized.
While high-quality credits exist for all types of projects, a rich understanding of the differences in methodologies, geographies, physics, and ecology is required to identify high-quality projects and understand varied certainty, durability, and risk terms. Identifying high-quality carbon projects demands extensive and project-specific diligence beyond carbon market certification.
Our own diligence work reveals that high-quality projects can be hard to find. Fewer than 10% of the carbon removal projects we assessed for our 2026 State of the Voluntary Carbon Market report met our quality criteria. This diligence work now has an additional, independent backstop. As of August 2026, the ICVCM has approved 44 methodologies across 13 programs, as eligible for its CCP label, including ACR, Gold Standard, and VCS. For buyers, considering projects that are CCP-eligible should be used as a first filter—not a substitute for project-level diligence, but representing a legitimate floor.
While realized emissions impacts may be difficult to prove in some cases, it is important to remember that some projects provide additional co-benefits. REDD+ projects, for example, may have a positive impact on conservation and biodiversity, and cookstove projects may offer clear human health and social welfare benefits. However, these benefits should be assessed separately from carbon reduction, removal, or avoidance benefits.
Frequently Asked Questions
What's the difference between a carbon credit and a carbon offset?
A carbon credit represents one verified tonne of emissions reduced, removed, or avoided. A carbon offset describes how a buyer uses that credit, typically to counterbalance emissions it has not yet accounted for. The credit itself does not change type based on how it's claimed.
Which type of carbon credit—reduction, removal, or avoidance—is highest quality?
No single type is inherently highest quality. Each project, regardless of type, is verified against a defined baseline. Quality depends on how rigorously that specific baseline was set and how well the project meets other quality criteria. Removal credits from engineered sources have the most straightforward baseline (zero), and avoidance credits carry the most baseline uncertainty by design, but these are only one determinant of credit quality.
Do carbon removal credits automatically meet the ICVCM’s Core Carbon Principles?
No. The ICVCM assesses methodologies and programs, not individual projects. If a project uses a methodology that is eligible for the CCP label, this can be a useful floor but is not a guarantee of high quality.
How does SBTi's near-term removal mandate change which credits I should buy now?
SBTi's finalized Corporate Net-Zero Standard V2.0 doesn't require removal purchases until 2035, but it sets the ramp now (i.e., 1% of scope 1, scope 2, and scope 3 emissions in 2035, scaling to 100% by the net-zero year). This means the highest-durability removal supply that is scarcest and most in demand today is the same supply that many companies will need later. The SBTi guidelines are still changing, so buyers and project developers must track them closely.
What Is Environmental Justice?
Key Takeaways
- Environmental justice rests on four pillars: distributive, procedural, recognitional, and restorative justice. These apply to any project shaping a community, from a carbon removal project to an AI data center.
- The federal environmental justice architecture was dismantled in 2025: the Justice40 Initiative, which covered more than 500 federal programs across 19 agencies, was rescinded, EPA's EJScreen tool was taken down, and EPA's environmental justice offices were eliminated. The burdens those programs were designed to address still remain, and community organizers and state governments are turning to local solutions to address environmental justice issues.
- Community benefits plans can be one tool to help advance distributive justice. For example, in the US, community opposition has blocked, stalled, or withdrawn more than $170 billion in announced AI data center capacity since January 2024, making community benefit plans an essential aspect of any large infrastructure project.
Introduction
The EPA reports that in the US, the most severe impacts of climate change fall disproportionately on low-income and Black, Indigenous, and people of color (BIPOC) communities. This climate burden is part of an ongoing legacy of inequity, including redlining and the disenfranchisement of Indigenous peoples, that has excluded these communities from financial and natural resources over generations. As a result, disinvested and underserved communities are experiencing cumulative effects on their health and livelihoods that may be exacerbated by climate change.
Climate mitigation and adaptation efforts do not automatically correct this pattern. Solar panel adoption, electric vehicle adoption, urban forest cover, and FEMA buyouts do not always meaningfully benefit marginalized populations. Climate solutions like carbon dioxide removal are gaining traction, and they carry real social, economic, and ecological benefits. But if communities are excluded from the decision-making processes around these solutions, they cannot realize those benefits. It doesn't have to be this way: decarbonization interventions like carbon dioxide removal are still early enough in their development to center community needs and distribute benefits equitably, before historical inequities are institutionalized again.
Environmental Justice Explained
Environmental justice promotes the equitable distribution of environmental harms and benefits through the meaningful involvement of community members as stakeholders, where their decisions are recognized and acted on. As a practice, environmental justice can encompass anything from promoting equal access to safe, clean drinking water to encouraging equitable design and development of climate mitigation efforts, including carbon removal projects. Environmental justice also promotes resiliency for disinvested communities in a changing climate through inclusive, equitable, and ongoing participation in environmental decision-making. For many, environmental justice is a framework and political project of building a better world for the communities most impacted by the legacies and ongoing realities of environmental racism and industrial development. This movement is led by leaders from Native American Tribes, organizers from communities of color with major roots in Black and Latinx communities, and activist-academics. Policymakers have worked to institutionalize this movement to varying degrees of success and the environmental justice movement has also traveled globally.
History of Environmental Justice in the US
The US environmental justice movement grew out of the civil rights movement. In 1968, Black sanitation workers in Memphis went on strike over unsafe conditions and unequal pay after two workers were crushed to death by a malfunctioning garbage truck; Dr. Martin Luther King, Jr. went to Memphis to support the strikers and was assassinated there. The strike remains a landmark in the linking of civil rights, labor, and environmental health.
In 1982, residents of Warren County, North Carolina, a majority-Black rural county, organized to block a PCB landfill sited in their community. More than 500 people were arrested, and the protests became the recognized spark of the national movement. It was there that civil rights leader Rev. Benjamin Chavis coined the term "environmental racism" to describe the deliberate concentration of pollution and waste facilities in disinvested communities. Warren County prompted the evidence that made the pattern undeniable: a 1983 Government Accountability Office study found that three of four hazardous waste landfills in the Southeast were sited in majority-Black communities, and the United Church of Christ's 1987 report, Toxic Wastes and Race in the United States, found race was the single strongest predictor of hazardous waste facility siting nationwide.
Dr. Robert Bullard, a leader in environmental justice scholarship, observed: "Whether by conscious design or institutional neglect, communities of color in urban ghettos, in rural 'poverty pockets,' or on economically impoverished Native-American Reservations face some of the worst environmental devastation in the nation."
Over the following decades, and as the result of rigorous community organizing led primarily by Black leaders in the South, environmental justice institutions took shape. The US National Environmental Justice Advisory Council (NEJAC), chartered in 1993, advised the EPA for more than three decades. From 2021 to 2025, the Justice40 Initiative committed 40% of the benefits of select federal investments, spanning climate, clean energy, energy efficiency, and clean transit, to communities that are marginalized, underserved, and overburdened by pollution.
Principles of Environmental Justice
Federal initiatives such as Justice40 drew from the original 17 Principles of Environmental Justice adopted by delegates to the First National People of Color Environmental Leadership Summit in Washington, DC, in October 1991. The US Department of Energy, responding to concerns environmental justice stakeholders raised around carbon management and hydrogen, organized its project design guidance around four types of energy and environmental justice: distributive justice, procedural justice, recognitional justice, and restorative justice. These four pillars remain the working framework for practitioners today, whether or not a federal program funds them.
Distributive Justice
Distributive justice addresses the equitable distribution of burdens and benefits across geographies and populations. Distributive justice is concerned with factors such as distribution of income, wealth, jobs, opportunities, utilities, food security, and water and air quality. This type of justice also refers to the perceived fairness of the distribution of burdens and benefits, or how people evaluate what they receive relative to social and historical contexts.
Procedural Justice
Procedural justice addresses the meaningful involvement of affected communities as stakeholders in environmental decision-making processes. Procedural justice contributes to distributive justice by informing the policies and procedures that determine how environmental harms and benefits are distributed to individuals, nations, and generations.
Recognitional Justice
Recognitional justice accounts for the social, historical, and cultural contexts of a geography or population, and how those contexts have determined the geography's or population's relationship to power. Recognitional justice aims to facilitate the recognition of all community members as actors, affirming their intrinsic value and equal moral standing.
Restorative Justice
Restorative justice directly responds to historical harm, and through equitable decision-making and participation, facilitates opportunities to improve health, safety, and environmental conditions. Restorative justice promotes resolution and remediation, in consideration of distributive, procedural, and recognitional justice.
The Federal Retreat, and What Remains
That federal architecture was dismantled in 2025. On January 20, 2025, Executive Order 14148 rescinded the order that created Justice40, ending a commitment that had grown to cover more than 500 programs across 19 federal agencies. In February 2025, EPA removed public access to EJScreen, the screening and mapping tool practitioners nationwide used to identify overburdened communities; a working reconstruction is maintained by Public Environmental Data Partners. In March 2025, EPA terminated NEJAC and announced the elimination of its Office of Environmental Justice and External Civil Rights along with all ten regional environmental justice offices, and moved to cancel billions of dollars in environmental justice grants. Federal courts have ruled some of those grant terminations unlawful, most recently in June 2026, though the same court declined to restart the program because its staff was already gone. In December 2025, the Department of Justice repealed the Title VI disparate-impact regulations that had served as a principal federal civil rights tool against practices with discriminatory environmental effects.
Yet, the environmental justice movement is enduring, and increasingly, state legislatures are now where environmental justice policy lives: New Jersey's cumulative impacts law still empowers regulators to deny permits for new facilities in overburdened communities; New York adopted implementing regulations for its environmental justice siting law in June 2026; Virginia enacted laws in April 2026 requiring environmental justice strategies in local comprehensive plans; Illinois created a state Office of Environmental Justice in May 2026; and Massachusetts' cumulative impact regulations took effect in July 2026. The movement built its evidence and its principles long before any federal program existed, and both outlast the programs.
Environmental Justice and Carbon Dioxide Removal
From climate resilience to carbon dioxide removal, climate action strategies must center environmental justice to deliver both meaningful and equitable outcomes. And with continued investment in carbon dioxide removal, now is the time to embed environmental justice in every stage of carbon project development from the start.
For communities, doing so can unlock socioeconomic and ecological benefits, from job creation to ecosystem services. For project developers as well as buyers of carbon dioxide removal, incorporating environmental justice helps to ensure the long-term viability of projects by delivering higher quality carbon removal credits that not only have community support but also mitigate risks that could halt project development.
How to Center Environmental Justice in Carbon Removal
By incorporating equitable practices for environmental decision-making, carbon dioxide removal can equitably distribute environmental burdens and benefits, support meaningful community engagement, and remediate past harms.
Equitable Distribution of Burdens and Benefits
In carbon dioxide removal, distributive justice addresses the equitable distribution of environmental burdens and benefits across a geography or population as it relates to a carbon dioxide removal project. Beyond minimizing environmental burdens, carbon dioxide removal projects can also maximize benefits for local communities. Environmental burdens and benefits vary by carbon dioxide removal pathway, and therefore should be assessed on a project-by-project basis, but broadly include the following categories:
- Health & safety: Historical and potential pollutants, contaminants, and other safety considerations, and their impacts on public health
- Ecosystems & biodiversity: Impacts on surrounding ecosystems and associated resources, like soil health, biodiversity, and water
- Sustainable livelihoods: Viability of sustainable livelihoods through job creation, fair and transparent compensation, and project ownership
Meaningful Community Engagement
In carbon dioxide removal, procedural justice represents the meaningful involvement of local communities so that they are present and future stakeholders in carbon project development. This should include direct engagement and community benefit plans that incorporate community needs and priorities. For community members to be involved, project developers must show how they directly, transparently, and periodically engage with local communities throughout the project's lifetime.
Additionally, project developers may actively involve community members in project development, implementation, and subsequent monitoring. Doing so can help to reconfigure those community members' relationships to power, and affirm their role as actors in environmental decision-making.
Remediating Past Harms
For carbon dioxide removal to advance restorative justice, projects must also consider how to address and resolve prior harms. This includes remediating the historic burdens of pollution and greenhouse gasses on health and wellbeing; advancing land and water rights for communities who have been stewards of forests, lands, and coastal environments since time immemorial; and promoting opportunities for inclusive economic growth.
Environmental Justice and AI Data Centers
Current waves of infrastructure development in the US are catalyzing significant environmental justice concerns. Relae (formerly Carbon Direct) analyzed 46 AI data center projects that were blocked, stalled, or withdrawn due to community opposition since January 2024, together representing more than $170 billion in announced capacity. The analysis found that the strongest predictor of project failure is not the technology but the process: how early, how transparently, and how meaningfully developers engage the communities they build in.
[stat]
There are two central findings. First, the communities organizing against data centers span the political spectrum, which shows that procedural justice (i.e., the demand for a real say in what gets built) has become a mainstream expectation for large infrastructure, not a concern confined to any one kind of community. Second, the distributive burdens still fall where they have always fallen: research on EPA-regulated data centers finds air pollution burdens rise with the share of people of color living nearby.
A real community benefit plan for a data center covers the same ground carbon removal projects already assess, adapted to what a data center actually changes in a community:
- Grid and rate impact: How the project affects local electricity demand, reliability, and rates, disclosed before permitting rather than after residents notice their bills changing
- Water use: How much water the project's cooling systems require and what that means for local supply, addressed up front rather than in response to a lawsuit
- Jobs and local revenue: What the project actually creates for the community, in construction jobs, permanent operating jobs, and tax revenue, stated plainly rather than implied
The Future of Environmental Justice
Without addressing community concerns, meaningfully engaging local stakeholders, or properly assessing project impacts, projects get stopped, whether they are carbon dioxide removal facilities or AI data centers. Stakeholders across both landscapes, from policymakers to project developers, need equitable decision-making strategies to promote the principles of environmental justice today and to prevent the escalation of social injustices in a warming world.
Like the physical science of climate change, environmental justice can also be a data-driven practice. Implementing environmental justice frameworks requires consistent, accurate, and repeatable processes measured against verifiable benchmarks, and those benchmarks must evolve with the best available data, especially now that practitioners can no longer rely on federal tools to supply them.
The federal programs are gone, but the question they were built to answer is being asked in more places than ever, at county commissions, zoning boards, and utility hearings across the country: who carries the burdens of new infrastructure, who receives its benefits, and who decides? Communities are no longer waiting to be asked.
[cta]
Frequently Asked Questions
What is a community benefit plan, and what should it include for a large infrastructure project?
A community benefit plan is a set of specific, public commitments a developer makes to the community hosting a project, developed through direct engagement rather than announced after decisions are made. For a large infrastructure project it should address local community priorities through direct community engagement and cover health and safety impacts, effects on local ecosystems and water, grid and utility rate impacts, jobs and local hiring, tax revenue, and a defined process for ongoing community input over the project's lifetime. The strongest plans are negotiated with community representatives and include enforceable terms, often formalized as community benefit agreements.
How are community benefit plans used to put environmental justice principles into practice?
Community benefit plans translate the four pillars of environmental justice into project terms: distributive justice through the fair sharing of benefits like jobs, revenue, and infrastructure improvements; procedural justice through the community's role in shaping the plan itself; recognitional justice by grounding commitments in the community's specific history and needs; and restorative justice through commitments that remediate existing burdens. They turn principles into commitments a community can hold a developer to.
Why are community benefit agreements becoming standard due diligence for carbon removal and data center developers?
Because skipping them has a measurable cost: community opposition has blocked, stalled, or withdrawn more than $170 billion in announced AI data center capacity since January 2024, and process and transparency failures, not technology concerns, are the most consistent drivers. With federal environmental justice programs dismantled and states writing their own siting and cumulative impact laws, a credible community benefit plan is now both the practical path to permits and the clearest signal that a developer intends to be a long-term neighbor.
How can companies apply environmental justice practices developed for carbon removal siting to AI data center projects?
There are a few key ways: engage communities early, before land is optioned rather than after permits are filed; assess and disclose distributive impacts, including grid and rate effects, water use, and air quality, up front; and build benefit plans around what the community identifies as its needs rather than what is convenient to offer. Carbon removal developers adopted these practices because community support determines project viability, and the same is proving true, at much larger dollar values, for AI data centers.