



Research, Analysis, & Point of View
Original insights from the Relae team on the forces reshaping power systems, GHG emissions, environmental markets, nature, and the capital and policies behind them.
In-Depth Research

Criteria for High-Quality Low Carbon Fuels 2026
Community Opposition to AI Data Centers: Lessons Learned
Carbon Capture for Gas-Fired Power Generation
Blogs
Why Behind-the-Meter Power Emissions Belong in Scope 2
Key Takeaways
- Larger power users are securing behind-the-meter (BTM) power to bypass grid constraints, pairing data centers with third-party-owned generation assets that deliver electricity through a private line rather than the grid.
- BTM power arrangements can create confusion about electricity emissions classification: the power users neither own the generating asset nor purchase electricity from the grid, leading some to misclassify those emissions as scope 3 in their corporate GHG inventories. But the GHG Protocol's Corporate Standard is clear: BTM electricity emissions belong in scope 2.
- Misclassifying BTM emissions can create reputational and regulatory risk. Relae can help organizations get this right before the contract closes.
Why Large Power Users Are Turning to Behind-the-Meter Power
Large power users are consuming more electricity due to data center growth and are looking to add capacity faster than the grid can support, which is having a direct impact on corporate emissions. For example, between 2020 and 2024, Microsoft’s location-based scope 2 emissions rose 130%, and Google’s rose 92%, driven almost entirely by soaring electricity demand from AI infrastructure.
To bypass grid congestion and long interconnection queues, many are turning to behind-the-meter (BTM) power. It’s a pragmatic solution to a real supply problem, but it’s opening an urgent carbon accounting question: when the BTM asset is owned and operated by a third party, where should we account for those emissions?
There has been some confusion that has resulted in companies pursuing an interpretation that would place those emissions in scope 3. The GHG Protocol’s Corporate Standard says otherwise, and the stakes of getting this wrong are high.
What Is Behind-the-Meter Power Generation?
Behind-the-meter refers to electricity generated on the power consumer’s side of the utility meter, bypassing the grid, and typically located on or near the site where the power is consumed.
In most BTM arrangements for a data center, a third-party developer builds and operates a generation asset, such as natural gas, geothermal, or renewable energy, and delivers electricity directly to the facility through a private transmission line. There is no utility meter, no grid connection, and no standard energy invoice.
This structure allows companies to access large, reliable blocks of power without waiting years for grid interconnection approvals. Since the company does not own or operate the generation asset and is not purchasing electricity through a conventional utility relationship, this arrangement has created some uncertainty around how to account for the associated emissions.
Can BTM Electricity Emissions Be Classified As Scope 3?
In this scenario, no. The GHG Protocol's Corporate Standard is unambiguous: BTM electricity emissions belong in scope 2, not scope 3. Yet, some companies have been confused about this classification.
There is broad agreement that since the power users do not own or operate the generating asset, those emissions do not belong in scope 1. Divergence starts when we consider that the company is purchasing BTM power, i.e., not from the grid. Since no electricity is acquired from the grid, some argue that rather than accounting for these emissions in scope 2, they are better placed in scope 3, category 8: emissions from leased assets.
The appeal is obvious for BTM power consumers. Scope 3 emissions face less scrutiny from investors, auditors, and regulators who focus most of their attention on scopes 1 and 2. Classifying BTM emissions as scope 3 would reduce near-term pressure to act. However, the GHG Protocol is unambiguous in its stance.
What the GHG Protocol Actually Says
The GHG Protocol’s Scope 2 Guidance states that “organizations must quantify emissions from the generation of acquired and consumed electricity, steam, heat, or cooling (collectively referred to as ‘electricity’).” The method of delivery, whether grid or BTM, does not change the classification.
If a company consumes electricity from a BTM source, the emissions from generating that electricity belong in scope 2. Section 5.4 of the Scope 2 Guidance addresses BTM power generation directly: “the company with operational or financial control of the energy generation facility reports those emissions in scope 1, following the operational control approach, while the consumer of the energy reports the emissions in scope 2.”
This resolves the question completely. The emissions sit in scope 1 if the company has operational or financial control of the asset, or in scope 2 if a third party controls it.
The GHG Protocol’s Corporate Value Chain (Scope 3) Accounting and Reporting Standard reinforces this conclusion. “Category 8 includes emissions from the operation of assets that are leased by the reporting company in the reporting year and not already included in the reporting company’s scope 1 or scope 2 inventories.”
Because BTM electricity emissions are captured by the Scope 2 Guidance, the scope 3 category 8 does not apply.
Get the Accounting Right Before the Contract Closes
The GHG Protocol is unambiguous: behind-the-meter electricity emissions belong in scope 2 for companies that consume, but do not control the generating asset. This means that BTM contract terms are crucial to determining how the emissions will be classified, since the GHG Protocol assigns scope based on who holds operational or financial control of the generating asset.
Companies that move fast on BTM capacity without understanding this distinction risk locking in a scope 1 or scope 2 obligation they didn't anticipate or building a reporting strategy around a scope 3 interpretation the GHG Protocol doesn't support. This can become a reputational or even a regulatory liability that is far harder to address after the contract is signed.
[cta]
The $5.5 Billion-Dollar Case for Enabling Data Center Load Flexibility
Key Takeaways
- The electricity demand surge is real and accelerating. Just last year, data center load in the US was projected to increase from 25 GW to 120 GW by 2030. Today, Texas’ preliminary long-term load forecast projects over 187 GW of data center load by 2030, more than double today’s total peak demand of approximately 91 GW.
- Flexible loads that respond dynamically to policy signals are becoming a regulatory requirement. Texas Senate Bill 6 (SB6), signed into law in June 2025, is the clearest signal yet. It makes remote curtailment equipment a condition of interconnection for new loads of 75 MW or more, so utilities can disconnect them during declared firm load shed events, and separately creates a voluntary demand response program that those loads can elect to join.
- Relae’s power system modeling puts a dollar value on what data center load flexibility is worth. Our ERCOT analysis shows that data center demand response can eliminate forced load shedding risk, even at 40 GW of data center buildout – preventing $5.5 billion in annual consumer welfare losses by curtailing an average of 5% of demand for under 1% of operating hours.
- Flexible load curtailment and compute uptime do not need to be in conflict. In our modeling, demand response operates as a "ghost battery" at the data center's grid node, absorbing grid stress as a physical battery would. That construct has a direct real-world analog: on-site battery storage lets data centers draw from stored energy during grid stress events rather than curtailing workloads. Technologies such as those demonstrated by Emerald AI have shown 25% load curtailment at cluster scale while preserving compute service quality.
Data Center Electricity Demand is Testing Grid Limits
Electricity demand in the United States is growing at its fastest pace in decades. Leading the surge is a rapid buildout of data centers, driven by the expansion of artificial intelligence. ERCOT, the grid serving most of Texas, is projecting up to 187 GW of new data center load by 2030, against a total peak demand today of approximately 91 GW.
The scale of this shift extends across the country. According to NERC's 2025 Long-Term Reliability Assessment (LTRA), summer peak demand across the US bulk power system is forecast to grow by 224 GW over the next 10 years, 69% above the prior year’s 10-year projection of 132 GW, with data centers as the dominant driver. As previously explored by Relae, data center energy capacity in the US is projected to increase from 25 GW to 120 GW by 2030, characterizing it as the first wave of a longer demand surge that electrification of buildings and transport will reinforce.
Policymakers are responding in real time, and regulatory responses like Texas SB6 are already rewriting the rules for how data centers connect to the grid. The pace of change is fast, but the siting, infrastructure, and interconnection decisions made today will have lasting consequences: they will determine whether data centers are grid assets or grid liabilities, and the financial difference between the two is measured in billions.
New Solutions for Data Center Demand Response: Texas SB6 as a Test Case
The rapid nature of this new wave of load growth means traditional approaches to managing the grid may not be sufficient. In the past, lead times on new sources of electricity demand allowed utilities to procure supply-side resources in advance. The scale and immediacy of data center deployment is revealing limitations of this approach. States, utilities, independent system operators (ISOs), and regulators are actively pursuing novel approaches for grid management in response.
Texas has become a focal point of US data center expansion, with SB6 as a leading policy response. The bill, which took immediate effect upon Governor Greg Abbott's signature on June 20, 2025, is the most significant restructuring of large-load interconnection rules in ERCOT's history. It requires large loads over 75 MW to install remote curtailment equipment as a condition of interconnection, so grid operators can disconnect them during declared firm load shed events, and creates a separate voluntary demand response program, procured competitively with at least 24 hours’ notice, that those loads may elect to join. If data centers are adding substantial new load to the grid, this reasoning goes, they should also contribute to grid stability by demonstrating load flexibility—reducing power draw at times of peak demand.
While demand response programs currently exist, incentivizing voluntary curtailment from data centers is challenging. In an AI compute arms race, the value of uninterrupted compute time far exceeds any available curtailment payment, such as via PJM’s capacity market mechanisms.
Approaches to bridge that gap are coming to fruition: EPRI’s DCFlex program is working with hyperscalers and utilities to develop the technical protocols, measurement standards, and contractual frameworks that would make large-load demand response a routine grid service. Innovators like Emerald AI have demonstrated a 25% power reduction across a 256-GPU cluster over three hours during an Arizona grid stress event, while preserving compute service quality, helping to bridge the valuation asymmetry between energy and compute.
Hyperscalers are already putting a flexible load commercial strategy into action. In March 2026, Google announced 1 GW in demand response contracts with multiple US utilities, including Entergy Arkansas, Minnesota Power, and DTE Energy.
The conversation has shifted from whether data centers can be flexible to how that flexibility gets structured and deployed.
Putting a Dollar Value on Data Center Load Flexibility
For developers, investors, and grid operators navigating data center growth, the challenge has been making high-stakes siting and interconnection decisions without a clear picture of what load flexibility is actually worth, what inflexibility costs the system, or how curtailment requirements will reshape the regulatory landscape.
Prior research has established that flexible data center load can absorb substantial grid stress. For instance, research from Duke University’s Nicholas Institute found that 22 of the largest US balancing authority areas could absorb approximately 98 GW of new flexible load if 0.5% of that load’s annual energy is curtailed, or 76 GW at a stricter 0.25% curtailment level.
Relae’s analysis goes further by quantifying the economic cost at each increment of flexible load growth, and the precise threshold at which that flexibility stops being optional. We zeroed in on ERCOT, a region with high data center load growth and immediate regulatory stakes, determining the value of implementing flexibility and, conversely, the system risk of failing to do so.
How We Modeled It
Assessing the impacts of load growth and flexibility solutions requires a systems-level analysis, best achieved via power market modeling. At Relae, we deploy our in-house power system modeling framework to navigate this complexity.
Our toolkit includes CD-PyPSA-USA, used for this analysis, which is built on the Python for Power System Analysis (PyPSA) platform. This grid model simulates how power networks operate and evolve over time by solving for the least-cost optimization of the entire power system. Critically, our model is customized to explicitly represent complex, real-world dynamics, including data center load flexibility, co-located generation, and various policy constraints.
For this analysis, we simulated ERCOT operations under a range of data center growth scenarios. We modeled loads from 5 GW up to 40 GW in 5 GW increments, pairing each with sufficient on-site gas generation to cover roughly 70% of data center energy needs–a conservative estimate on the approach developers are taking today.
We ran each scenario under two conditions: no load flexibility (“flex00”, the baseline) and 25% emergency curtailment capability (“flex25”), consistent with solutions exhibited by Emerald AI. This approach allowed us to determine the system's response to step-changes in electricity demand.
Voluntary Curtailment, Forced Outages, and the Value of Lost Load
This analysis makes an important distinction between three curtailment types: one voluntary and two involuntary electricity demand reductions.
- Demand response or load flexibility (voluntary reduction): This involves industrial consumers curtailing their power requirements in response to pricing or regulatory incentives. Participation is optional.
- Mandatory curtailment (targeted reduction): This is a required, controlled reduction of power draw by a specific consumer group (e.g., data centers under Texas SB6) when directed by grid operators during declared emergencies. This is a deliberate policy directive aimed at grid stability.
- Load shedding (forced outage): This is a non-targeted, involuntary outage event, such as a rolling blackout, where the system operator must cut power to prevent grid failure. These events affect all types of consumers, including residential and commercial electricity demand.
Grid operators in Texas use a value of lost load (VoLL) of $35,000 per megawatt-hour (MWh) to measure the welfare cost borne by businesses and households who lose power involuntarily. That figure, the standard benchmark applied by ERCOT in reliability and market design analysis, is what we use as the basis for valuing shedding events in our modeling. At $35,000 per MWh, even a small number of unplanned outage hours produces welfare losses in the billions.
What Our Analysis Reveals
Before doing the analysis, we expected to see load flexibility become more important as more data center load is added to the grid, preventing forced load shedding with high lost-load costs. But we didn’t know how large this effect would be, or what amount of new data center load would start to trigger it.
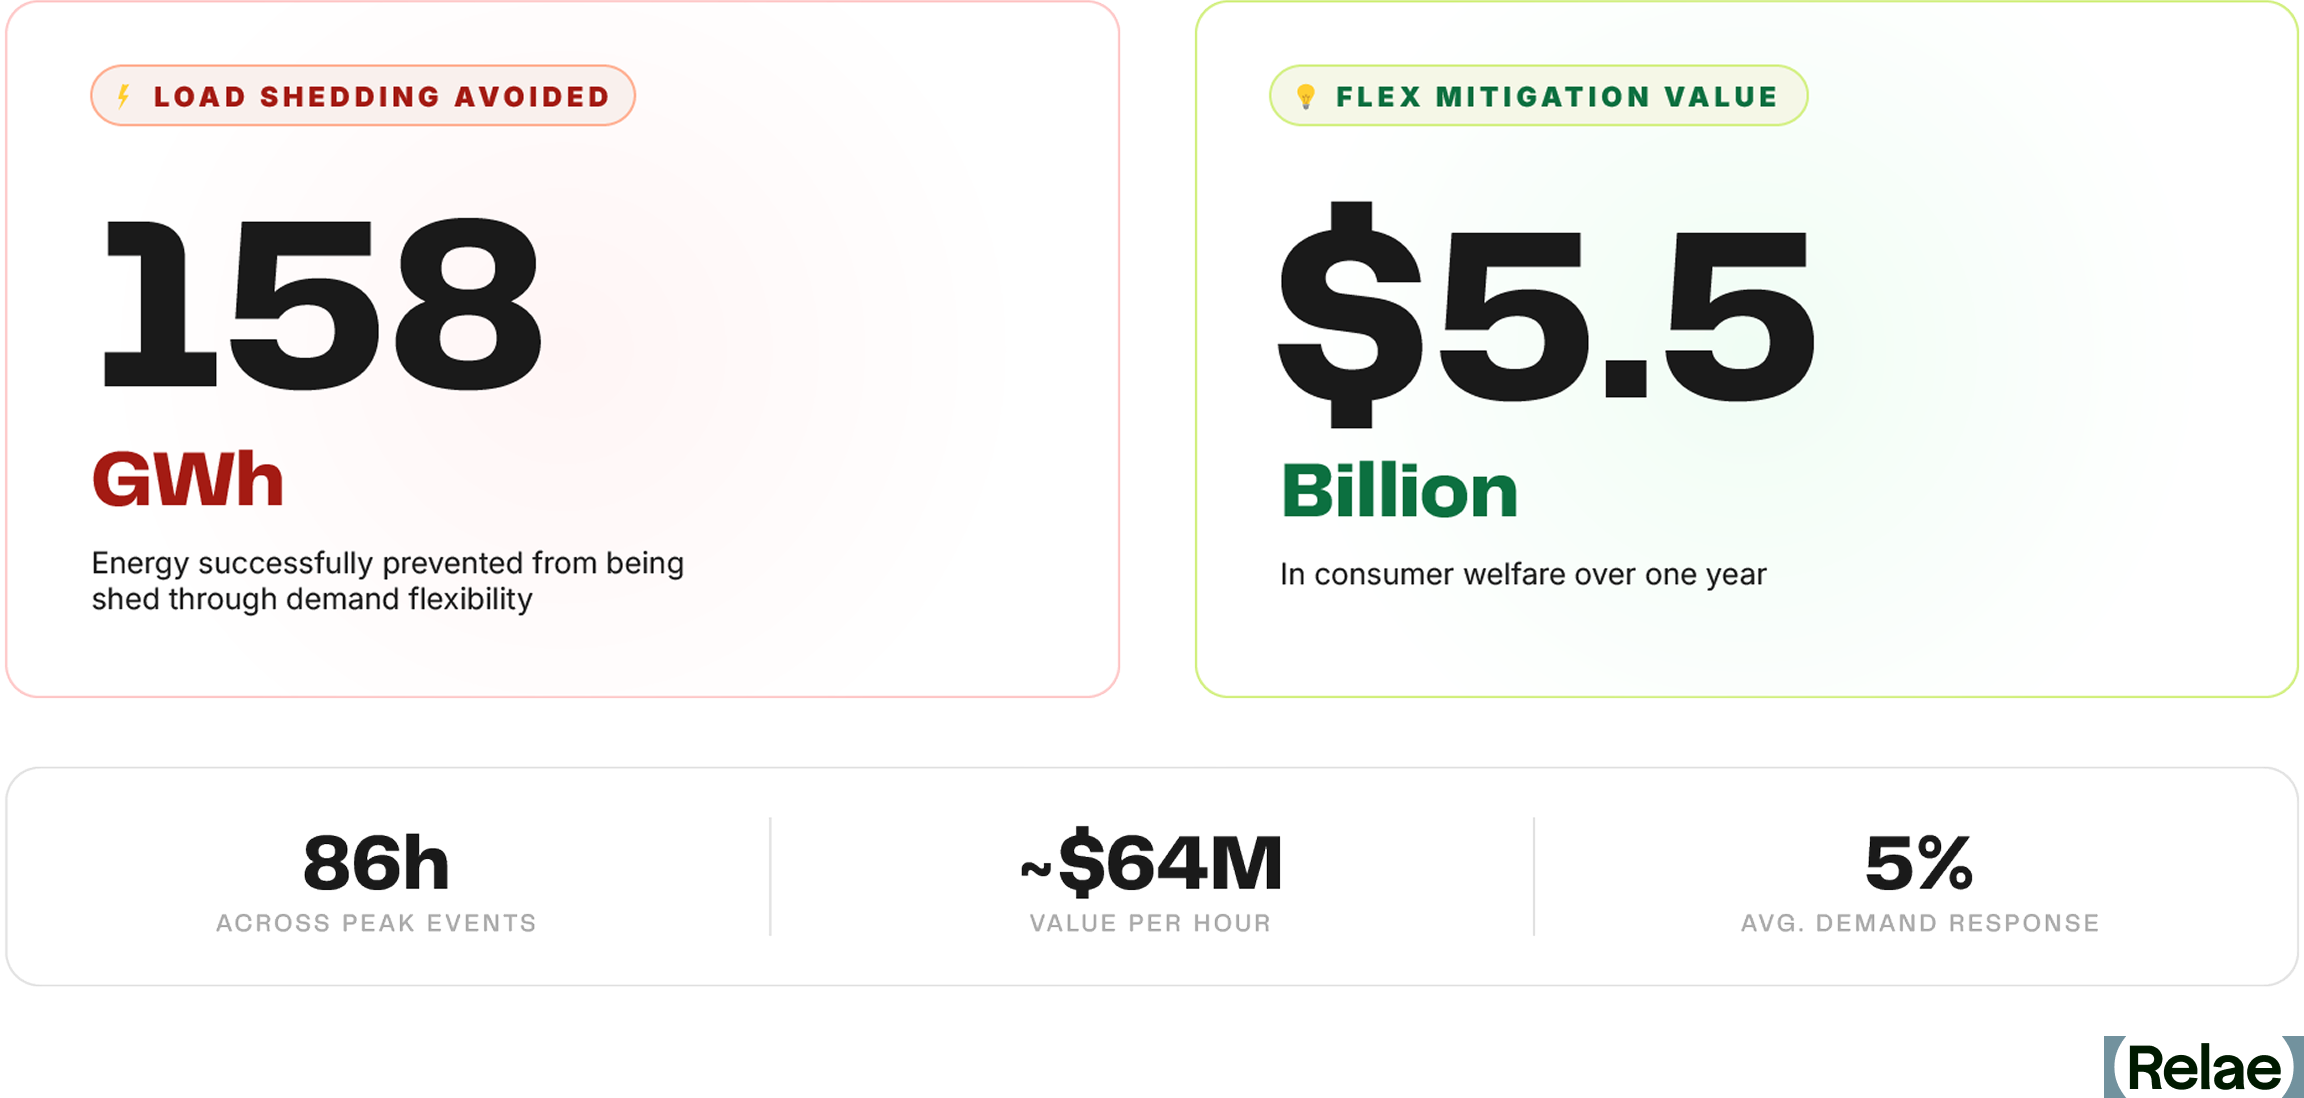
Our analysis found that without flexible load management, forced load shedding first appears at 30 GW, small in scale at first (4.4 GWh over 3 hours) but growing sharply as load increases. At 35 GW, we observe 50 GWh of shedding across 39 hours. At 40 GW, shedding reaches 158 GWh across 81 hours, equivalent to nearly three times ERCOT’s average hourly energy consumption, with an economic cost at VoLL of approximately $5.5 billion.1
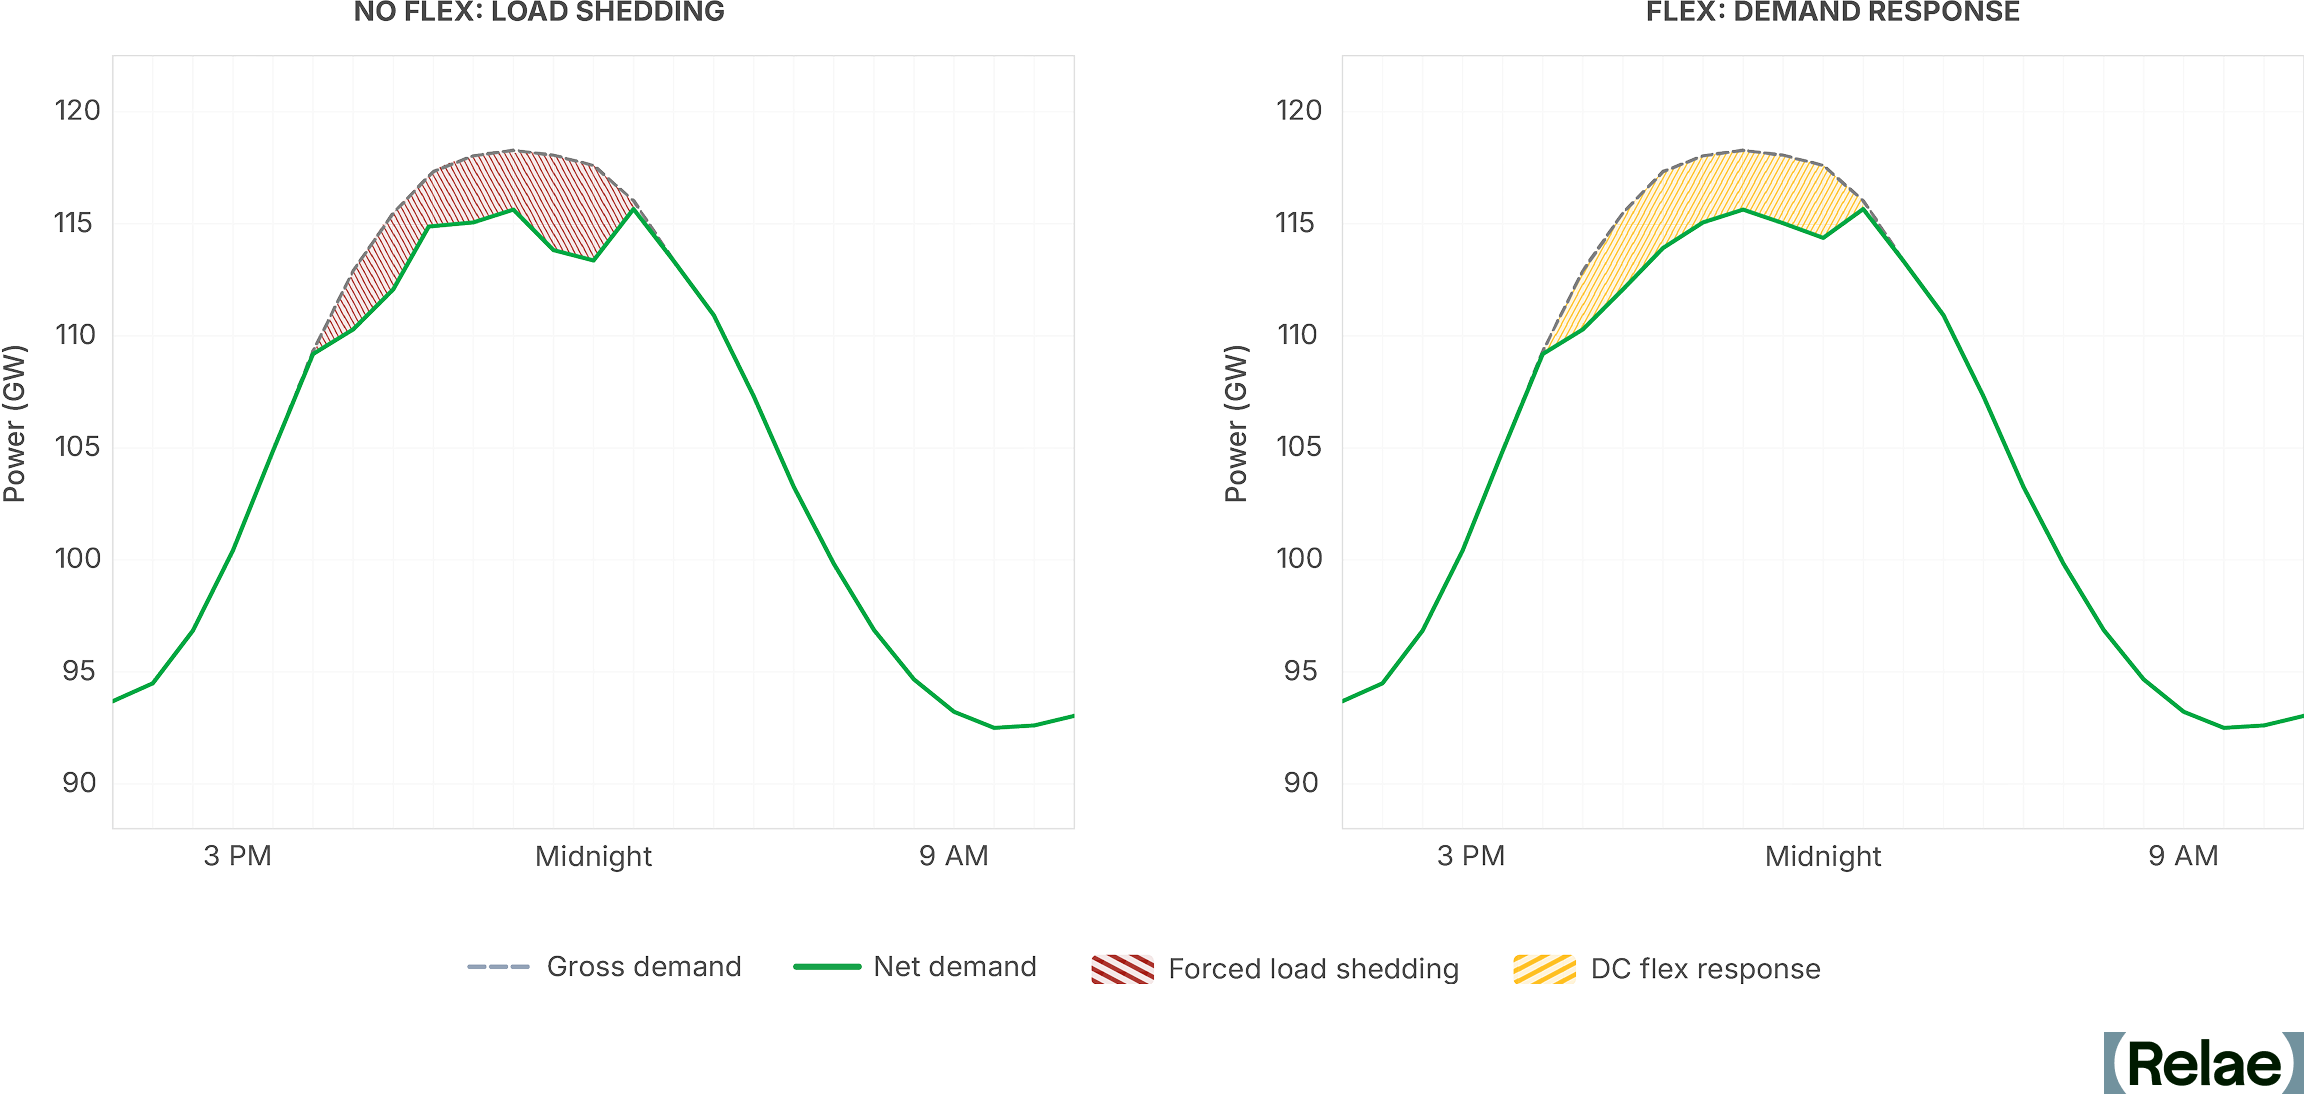
By enabling on-demand data center load flexibility, forced load shedding is eliminated in every scenario we tested. The same 40 GW case instead sees 165 GWh of controlled, short-duration curtailment spread across 86 hours, less than 1% of hours in a year. Further, the average demand response in these hours was less than 5% of the nameplate data center load, with the largest event reaching 14% of data center load. The grid stays balanced, consumers remain connected, and data centers deliver substantial value to the system via flexible loads.
Load Flexibility Is High Value and Presents an Opportunity for Storage
Our modeling puts a dollar figure on what flexible load is worth. At a VoLL of $35,000/MWh, each hour of demand response in the 40 GW scenario delivers approximately $64 million in avoided consumer welfare losses. Over a full year, that adds up to $5.5 billion, achieved through an average of just 5% demand response across the 86 hours of curtailment needed to eliminate all forced load shedding.
That value points directly to an opportunity for storage. In our model, demand response functions as a “ghost battery” at the data center’s grid node, absorbing grid stress exactly as a physical battery would, without any electrons needing to flow. That virtual battery can become a real one. On-site battery storage allows a data center to dispatch stored energy during grid stress events rather than curtailing workloads, maintaining compute continuity while relieving grid pressure.
The implications point in two directions.
- For the hyperscaler or data center operator, physical storage converts a compliance obligation into an uptime guarantee: the curtailment event becomes a battery discharge, with negligible impact to the compute stack.
- For the storage developer, co-location with large data center loads represents a high-value deployment opportunity with a clear commercial case. The avoided welfare costs per curtailment hour our model quantifies is the value a well-positioned battery asset, co-located at a data center node, can credibly claim to preserve.
The Data Centers of Tomorrow Need to be Grid Assets
The data center buildout underway is large enough to reshape grid reliability across entire regions, and the regulatory environment is beginning to reflect that scale. Texas SB6 is the most prescriptive example to date: it requires new large loads above 75 MW to install remote curtailment equipment operable during firm load shed events.
Our modeling quantifies what load flexibility is worth across this landscape: data centers with curtailment capability can provide significant value and avoid billions in consumer welfare losses annually. For developers and investors, designing that capability in from the start can convert a compliance requirement into a long-term grid asset.
The federal picture has moved in the same direction since this analysis was published. In May 2026, NERC issued a rare Level 3 Alert on computational loads; in June, FERC ordered six RTOs and ISOs to revise or justify their large-load interconnection rules, and in July, FERC directed NERC to develop mandatory computational-load reliability standards by the end of the year. We covered what that means for grid modeling and interconnection in Inside NERC’s Level 3 Alert on data center loads. Flexibility is no longer only a Texas statutory question; it is becoming part of the federal reliability framework.
Frequently Asked Questions
What is data center load flexibility, and how does it work?
Load flexibility is a data center’s ability to reduce the power it draws from the grid on short notice, during the small number of hours when the system is under stress. In practice, that means shifting or pausing deferrable compute, drawing on on-site batteries or generation, or pre-cooling the facility ahead of a peak. The point is not to consume less overall—it is to move a thin slice of demand out of the hours when the grid can least afford it.
What does Texas SB6 require of large data centers in ERCOT?
Texas Senate Bill 6, signed June 20, 2025, makes remote curtailment equipment a condition of interconnection for new loads of 75 MW or more in ERCOT, so utilities can disconnect them during declared firm load shed events. Separately, it creates a voluntary, competitively procured demand response program those same large loads can elect to join, with at least 24 hours’ notice. The mandatory piece is the disconnection capability; paid participation in demand response is a choice.
What does data center inflexibility cost? How much curtailment avoids it?
Relae’s ERCOT modeling found that without flexibility, forced load shedding first appears at 30 GW of data center load and reaches 158 GWh across 81 hours at 40 GW—roughly $5.5 billion a year in consumer welfare losses at ERCOT’s $35,000/MWh value of lost load. Enabling curtailment eliminated forced shedding in every scenario we tested, at an average of under 5% of data center demand across 86 hours, less than 1% of the year. Each hour of demand response in the 40 GW case is worth about $64 million in avoided losses.
Is data center load flexibility proven today, and how does it compare to on-site batteries?
Data center load flexibility is past proof of concept and into commercial deployment: Emerald AI cut power to a 256-GPU cluster by 25% for three hours during an Arizona grid stress event without degrading compute service quality; EPRI’s DCFlex initiative is building the protocols and contracts, and Google has signed 1 GW of data center demand response with US utilities.
On-site batteries reach the same result from the other direction—instead of curtailing workloads, the facility discharges stored energy, which is why our modeling treats demand response as a “ghost battery” at the data center’s grid node. For operators who cannot pause compute, storage turns the same compliance obligation into an uptime guarantee.
GHG Protocol Releases New Land Sector and Removals Standard
Key Takeaways
- On January 30, 2026, the Greenhouse Gas Protocol (GHG Protocol) released its long-awaited Land Sector and Removals (LSR) Standard v1.0 following a 5-year consultation process. The LSR Standard is set to take effect on January 1, 2027.
- The release of the LSR Standard represents a notable development for companies in the food and agriculture sector looking to report on land-based GHG emissions in their annual GHG inventory, as well as companies that plan to report on carbon dioxide removals (both land-based and technological).
- The accompanying Land Sector and Removals Guidance, which will provide further direction on operationalizing and implementing the LSR Standard, is expected in Q2 of 2026. However, companies with significant land-based activities may want to begin assessing the impacts of the LSR Standard on their emissions accounting procedures and decarbonization strategies today.
Why the Land Sector and Removals Standard Matters Now
Emissions from agriculture and land use change account for roughly a quarter of global emissions. Yet, for years, food, fiber, and fuel companies have lacked a clear framework for accounting and reporting on GHG emissions and carbon dioxide removals from land use. This has significantly limited their ability to demonstrate progress toward climate targets within their operations and value chain. The GHG Protocol’s Land Sector and Removals (LSR) Standard, which was released on January 30, 2026, changes that, and in doing so raises a new set of questions.
The LSR Standard provides greater clarity on what is required of companies to transparently track and report against their emissions reduction and removal targets, and opens new pathways to report on supply chain decarbonization interventions. It also represents an important advancement for companies seeking to report on carbon dioxide removals within their emissions inventory, including both land management removals and technological removals with geologic storage.
While the LSR Standard contains notable new requirements compared to the draft released in 2022, companies still face a number of open questions related to implementation and the implications for their decarbonization strategies.
The GHG Protocol’s accompanying Land Sector and Removals Guidance, scheduled for Q2 2026, is expected to offer more practical direction for implementing the LSR Standard. However, companies with significant land-based activities that require sufficient lead time to prepare should consider assessing the impacts today.
Below, we provide an overview of the LSR Standard, key changes from the 2022 draft, and actionable next steps for food, fiber, and fuel companies considering the impacts on their target-setting and emissions reporting.
What Is the Land Sector and Removals Standard?
The LSR Standard, taking effect on January 1, 2027, sets requirements and recommendations for corporate GHG accounting that cover emissions and carbon removals from agricultural and land use activities. It builds on existing GHG Protocol standards for corporate carbon accounting. Notably, the LSR Standard does not cover the forestry sector, a key break from the 2022 draft. Forest carbon accounting guidance remains under development and will be the subject of a stakeholder consultation/request for information process expected later in 2026.

Land Sector and Removals Standard vs Land Sector and Removals Guidance
The LSR Standard establishes the core requirements companies must follow, while the accompanying Land Sector and Removals Guidance, expected in Q2 of 2026, will provide more detailed implementation support. In short, the LSR Standard sets the "what" while the Land Sector and Removals Guidance will explain the "how," helping companies put those requirements into practice.
Who Should Be Using the Land Sector and Removals Standard?
The LSR Standard applies to two groups of companies:
- Any company with significant1 land-sector activities within its own operations or value chain (most notably the food, feed, fiber, biofuel, and advanced biomaterials sector).
- Any company looking to report on carbon dioxide removals within their scope 1 and scope 3 inventories (including both land management removals or technological removals).
Land management carbon dioxide removals include those from carbon sequestration through farming practices, agroforestry, or silvopastural systems on productive agricultural land. Technological carbon dioxide removals, by contrast, refer to more engineered approaches such as direct air carbon capture and storage (DACCS) or bioenergy carbon capture and storage (BECCS).
What Changed From the 2022 Draft?
Among other provisions, the LSR Standard contains notable breaks from the 2022 draft, including specific changes related to traceability, carbon dioxide removals, leakage, and land use change.
Traceability: A New Approach
Under the LSR Standard, companies that account for scope 3 emissions, removals, and other metrics must apply a spatial boundary. This boundary is determined by the level of traceability they can establish to known lands or regions (from least to most granular): global, jurisdictional (e.g., country), sourcing region (e.g., supply shed), land management unit (LMU) (e.g., farm), or harvested area. For more granular spatial boundaries, such as sourcing region and LMU, companies are required to establish physical traceability, which can be demonstrated through various chain of custody models.
The LSR Standard defines sourcing regions as predefined, spatially-explicit land areas that supply a raw material to its first point of aggregation or first processing facility in the value chain. The GHG Protocol allows some flexibility in how these boundaries are drawn. They can be defined at a tier of the value chain that includes multiple first points of aggregation or first processing facilities whose supply areas overlap.
Alongside higher integrity chain of custody models such as identity preserved, segregated, and controlled blending, the LSR Standard opens to mass balance as a chain of custody model that can be used to demonstrate physical traceability at the sourcing region-level with appropriate safeguards.
This is notable because mass balance is the most common chain of custody model for large volume agricultural commodities, and physical traceability is required to report removals according to the LSR standard. While challenges for reporting removals at sourcing region spatial boundaries still exist, this change unlocks new opportunities to decarbonize commodities and report removals within non-segregated supply chains through insetting programs.
Carbon Dioxide Removals: Clarity on Spatial Boundaries
The draft LSR Standard introduces key principles for companies choosing to report land management carbon dioxide removals, including traceability, data quality, and permanence. Translating those principles into practice remains challenging given the dynamic nature of agricultural supply chains and limited farm-level traceability.
Among other requirements, the LSR Standard maintains that companies electing to report on removals must do so as a separate accounting category from emissions. They must also identify the specific lands where carbon is stored, and conduct ongoing storage monitoring to detect and report on reversals if and when they occur.
The LSR Standard does, however, resolve one of the more consequential open questions left by the 2022 draft: where companies are to draw the spatial boundary for reporting land management carbon dioxide removals. By formalizing and permitting traceability at the sourcing-region level (with appropriate safeguards), it offers a workable middle ground between farm-level precision and the broader supply chain realities that most food and agricultural companies face.
The LSR Standard also opens to using alternative approaches to traceability, such as impact traceability, which allows companies to trace removals back to the LMU through a pathway that is separate from the physical GHG inventory. This is notable as it provides companies with optionality for recognition of farm-level supply chain investments even when physical traceability cannot be established, and inventory recognition is therefore not feasible.
Land Use and Leakage: Stronger Requirements
Finally, the LSR Standard significantly strengthens land use and economic leakage requirements compared to the 2022 draft. While the draft gave companies flexibility to choose among land-tracking metrics, the LSR Standard mandates that all companies report land occupation for both scope 1 and scope 3 in hectares and quantify land carbon leakage whenever “high leakage risk activities”2 displace food or feed production. This includes companies developing crop-based biofuels and bio-based feedstocks.
Leakage must be quantified using the Carbon Opportunity Cost, a calculation aimed at capturing how much carbon could have been stored in the absence of land management activities.
What Should Companies Do Now?
For entities reporting in accordance with the GHG Protocol’s Corporate Standard and Scope 3 Standard, the new LSR Standard goes into effect on January 1, 2027. However, the GHG Protocol’s Land Sector and Removal Guidance is not set for publication until Q2 2026, leaving many open questions related to implementation amid a short data collection and reporting cycle
In the interim, companies may consider a continuous improvement approach, evolving and improving their internal measurement and reporting mechanisms to enable more granular accounting over time. Companies may also consider running analyses to assess the impact of new requirements on the design and cost of decarbonization strategies, with a specific focus on data collection and monitoring approaches.
Ultimately, while implementation of the LSR Standard may evolve over time, it need not delay action on value chain intervention. Companies that continue investing in supply chain decarbonization are building the data infrastructure, supplier relationships, and operational resilience that yield greater visibility into supply chain risk and drive long-term value, independent of reporting standards.
As the LSR Standard's requirements develop, companies that have already begun assessing their emissions footprint and strengthening supply chain traceability and data quality are likely to be better positioned to align their reporting procedures accordingly.
How to Reduce Grid-Wide Emissions for Carbon Capture and Storage
Key Takeaways
- The opportunity: Clean, firm power is a strategic priority for large electricity buyers. Natural gas-fired generation equipped with carbon capture and storage (CCS) is emerging as a key tool in meeting this demand. The existing gas-fired power fleet in the US should be assessed to identify plants well-positioned for carbon capture retrofits that would benefit grid decarbonization.
- The challenge: The climate benefits of CCS-equipped natural gas plants depend entirely on how often they actually run. Adding carbon capture technology increases the cost to operate the equipment. These higher running costs can make the plant less competitive in auctions where the grid operator picks the cheapest power first. Without mechanisms to keep these plants running continuously, they may be outbid by cheaper, higher-polluting plants, causing grid-wide emissions to stay the same or even increase.
- The solution: Hyperscalers and other large energy buyers are creating a robust market for clean, firm power. By paying a "clean, firm premium" through long-term offtake agreements, these buyers can offset the higher operational costs of CCS, ensuring these plants are continuously utilized. This corporate leadership not only maximizes the grid-wide climate impact of each retrofit but also provides an important hedge against policy volatility, securing the investment case for clean innovation even when the future of subsidies like the 45Q tax credit is uncertain.
We Need Clean, Firm Power Now
The market signals for clean, firm power are clear. Meta’s nuclear energy projects and Microsoft’s Crane Clean Energy Center demonstrate growing interest in reliable, low-carbon electricity to support the rapid expansion of AI. Similar commitments by Google and Meta to advanced geothermal power also illustrate this trend.
One of the near-term options to meet this demand is natural gas with carbon capture and storage (CCS). As explored by Relae (formerly Carbon Direct), retrofitting existing gas facilities offers a path to reliable baseload power with low direct emissions, leveraging existing infrastructure to bypass the years-long delays typical of new grid interconnections.
Recent initiatives from Google and Calpine are already working to prove this concept at scale. This type of corporate leadership is driving the market; over the last decade, voluntary corporate procurement led to more than 40% of new clean energy capacity in the US. Further, recent procurement decisions illustrate that these players are willing to pay a “clean, firm premium” to secure round-the-clock, low-emissions sources of power.
Why Systems-Level Analysis Matters for CCS
While news of corporate procurements often makes headlines, recent analysis finds the number of supply contracts for natural gas power with CCS may outpace the number of secured offtake agreements. Without a power purchase agreement (PPA) to ensure competitive operation, or strong policy support, a generator may need to operate as a “merchant plant” in power markets, competing solely on cost.
A power plant’s ultimate climate impact is determined primarily by how it is positioned in the market, not just its facility-level technology.
How Power Markets Determine Which Plants Run
Understanding the potential of CCS to deliver clean, firm power and grid-wide decarbonization requires looking beyond the technology performance at a single facility. A retrofitted plant does not operate in isolation; its impact depends on how it interacts with the broader power market’s merit order.
The merit order is the ranking system in competitive power markets where the grid operator dispatches the cheapest offers first. Since carbon capture units are energy-intensive, the retrofitted natural gas plant incurs higher operating costs. This cost increase can inadvertently price the lower-emitting plant out of the market. Without mechanisms to ensure continuous utilization, the CCS plant is potentially outbid by cheaper, more carbon-intensive resources. This creates a risk of increased overall grid emissions.
To illustrate this dynamic, we’re sharing the results of our detailed grid modeling analyses of the Electric Reliability Council of Texas (ERCOT), which serves most of Texas, and the Southwest Power Pool (SPP), which covers parts of 14 states across the central US. Our analysis highlights the value of corporate “clean, firm premiums” in achieving maximum climate benefit and mitigating policy risk present in government subsidy support.
This type of systems-level grid modeling is necessary in understanding how facility-level reductions translate into real climate benefits. Support to incentivize continuous operation, such as corporate offtake agreements or the 45Q tax credit, is key to ensuring that retrofitting a gas power plant with CCS reduces overall grid emissions.
Offtake Agreements and Policy Support as Solutions
Power offtake from CCS retrofitted gas plants can meaningfully reduce system-level emissions. By directly matching electricity demand with the supply of power, large energy buyers – the offtakers – ensure the power plant is effectively utilized. This type of arrangement helps ensure any changes to reduce emissions intensity at the facility level translate into broader emissions reductions on the grid.
For these offtakers, the decision to pay a premium for clean power is driven by the goal of additionality – ensuring their procurement has a measurable, additional emissions reduction impact. Beyond physical energy, buyers secure Energy Attribute Certificates (EACs) for CCS, which serve as the verified proof of low-carbon generation required to satisfy corporate zero-emissions targets. As seen in the recent Google and Calpine agreement, these certificates allow buyers to claim the specific climate benefit of the CCS retrofit, justifying a premium over standard wholesale market rates to secure firm, clean delivery.
In the absence of offtake agreements, policy frameworks like the 45Q tax credit (up to $85 per ton of CO2 sequestered) serve a similar function by offsetting production costs.
However, access to this credit is not a guarantee and carries operational hurdles. To unlock the full credit value, facilities must meet stringent prevailing wage and apprenticeship requirements. Furthermore, the credit is limited to a 12-year window once the facility is placed in service, and requires construction to commence by 2033.
Beyond these eligibility requirements, the long-term outlook for 45Q involves inherent uncertainty. Recent regulatory shifts, including potential changes to the Greenhouse Gas Reporting Program (GHGRP), pose risks to the verification mechanisms required to substantiate captured tons.
Corporate offtake agreements offer a crucial private-sector complement to this landscape; they provide a stable revenue model independent of policy cycles, ensuring the investment case remains robust over the full life of the asset.
Understanding the Merit Order in Power Markets
Most US power plants operate in competitive deregulated markets, where grid operators dispatch generators based on their marginal cost of production – the cost of generating one additional unit of electricity. The operator ranks these offers from lowest to highest price, creating the "merit order.”
In these auctions, the cheapest resources (typically renewables and base load) are dispatched first. Progressively more expensive units (gas and peaking plants) are called upon until demand is met. The price of the final, most expensive unit required sets the market-clearing price received by all generators in that period.
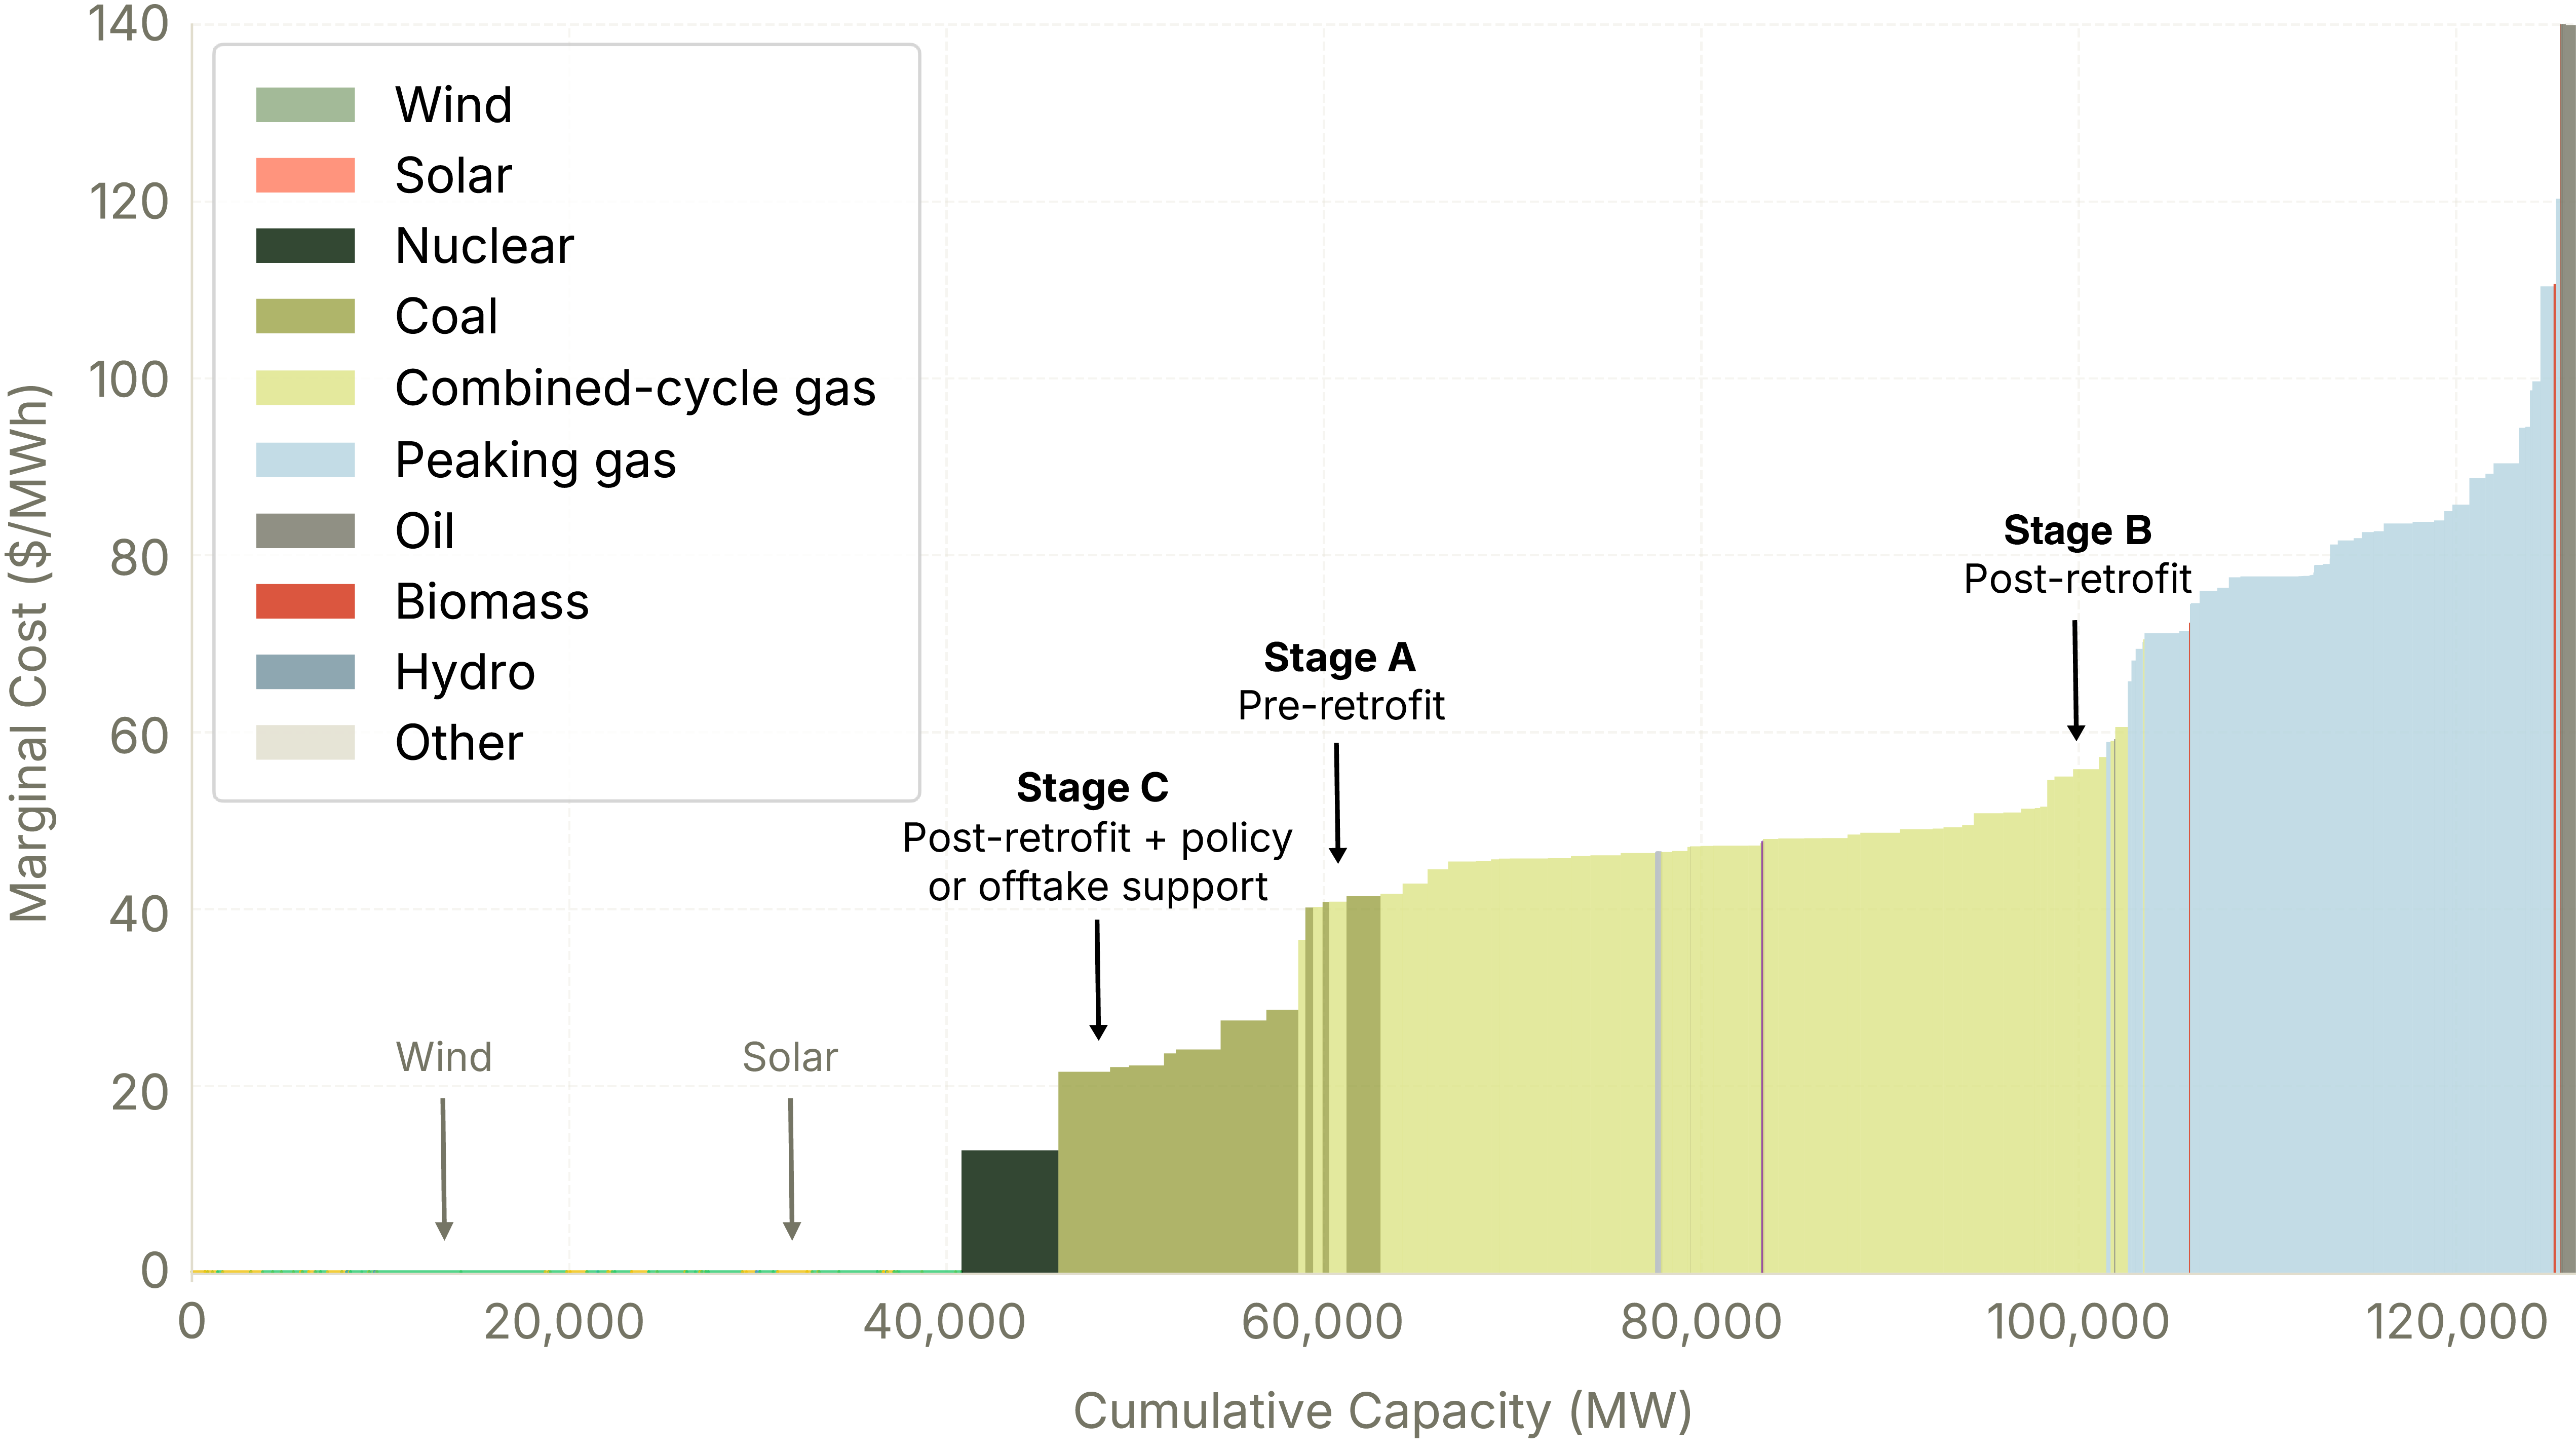
The Figure below shows an example generation merit order in the ERCOT energy market.
Case Study: How Support Structures Influence Dispatch
The merit order figure illustrates a hypothetical scenario for a natural gas generator, showing how its market position changes based on technical and policy variables:
- Pre-Retrofit (Stage A): The plant operates with standard marginal costs, sitting competitively in the middle of the supply stack.
- Post-Retrofit (Stage B): Retrofitting with CCS introduces higher operating costs due to the energy-intensive nature of carbon capture. Without external support, the plant’s marginal cost increases (A to B), making it less competitive. The retrofitted plant may be utilized less while cheaper units are dispatched to meet demand.
- Post-Retrofit + policy or offtake support (Stage C): Financial support, whether through the 45Q tax credit (approx. $33/MWh1) or a corporate offtake agreement, can effectively offset the plant’s higher operational costs (B to C). This effect restores the plant’s competitiveness, ensuring it dispatches consistently.
Testing This With Grid Modeling
At Relae, we apply state-of-the-art grid analysis tools to answer these and more complex analytical questions related to the future energy system. Our custom modeling framework has been used to simulate clean power strategies, assess data center demand response programs, and understand how procurement decisions today impact the future energy system.
While the theoretical impact of a CCS retrofit, a PPA agreement, and the 45Q tax credit on a plant’s dispatch is clear, it’s important to put the theory to the test by modeling their effects on system-wide emissions.
Our Modeling Approach
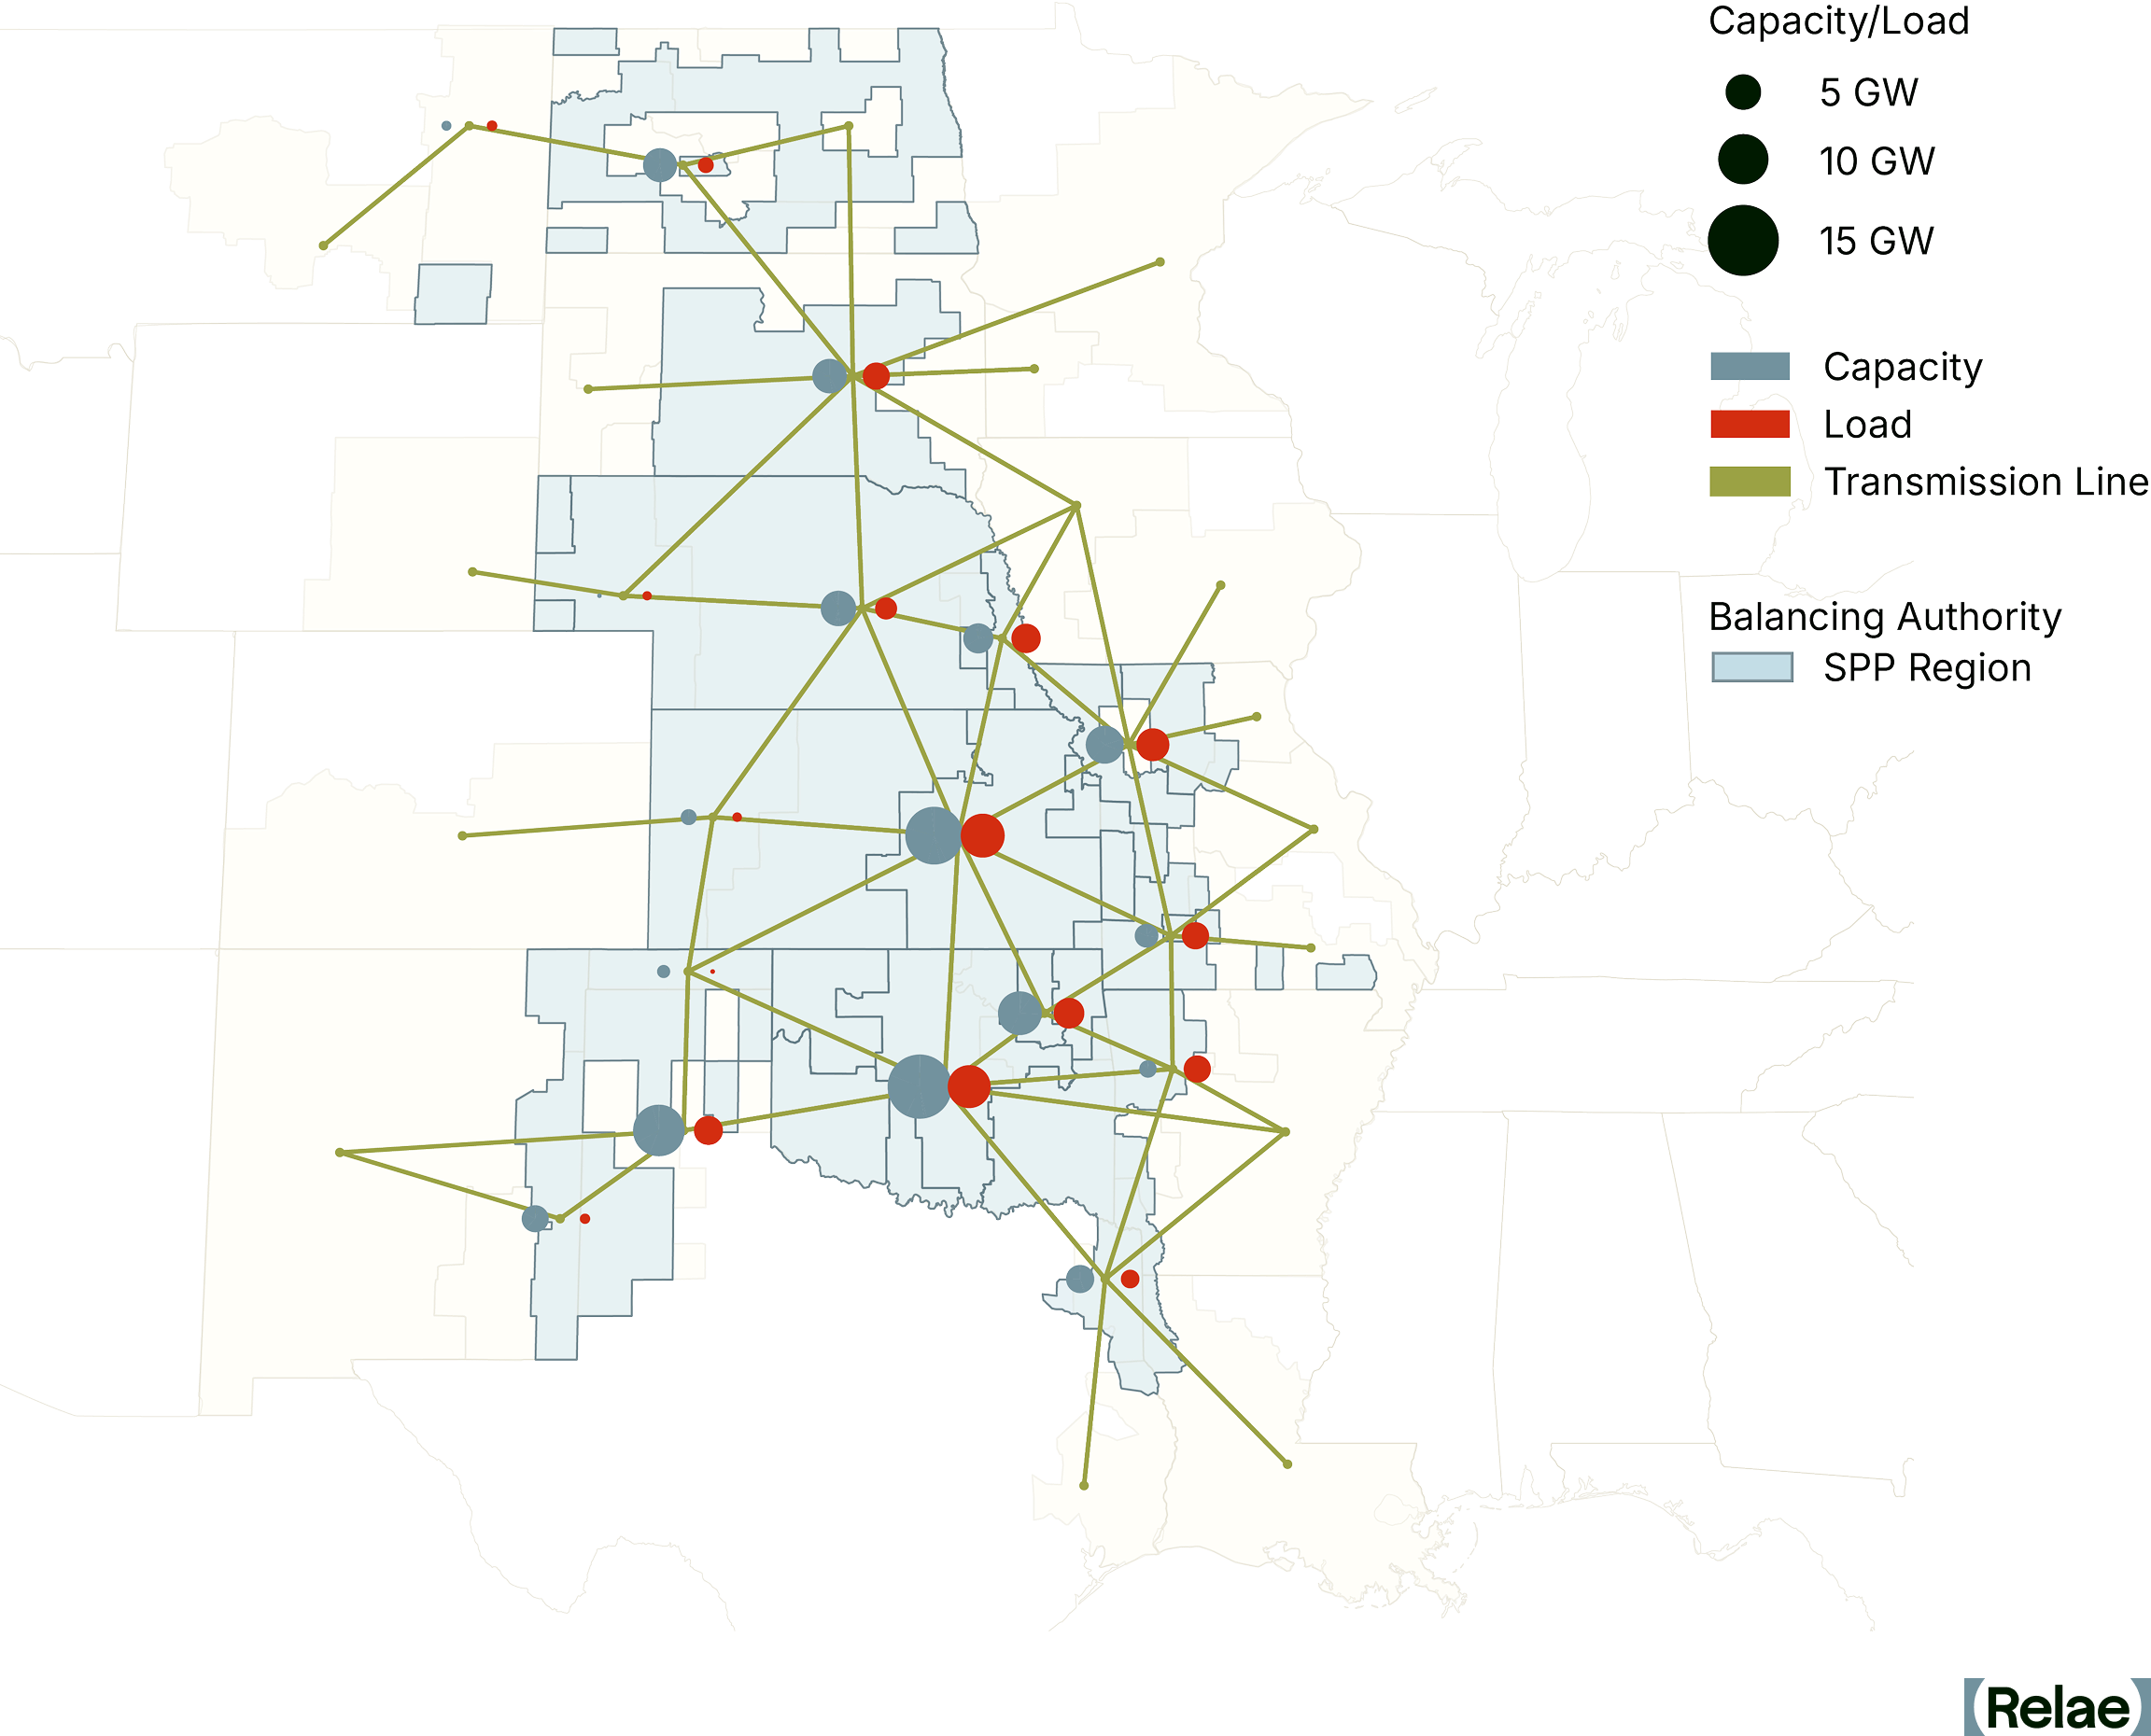
Because each grid region has distinct power plants and load requirements, they must be modeled separately. For this analysis, we chose to model the ERCOT and SPP power markets to determine the region-specific, grid-wide emissions impact of hypothetical CCS retrofits of natural gas power plants.
As part of this modeling, we:
- Deployed detailed hourly simulation: We used our custom PyPSA-USA grid model to produce a set of hourly simulations of the ERCOT and SPP electricity markets.2
- Identified suitable retrofits: We identified suitable combined cycle gas power plants for a CCS retrofit in each of the markets, based on key commercial and operational criteria, including size, age, generation profile, and proximity to CO2 transport/storage.
- Modeled plant and energy assumptions: To reflect the retrofit, we adjusted generator cost and energy use for the identified plants (up to 1.4 GW capacity), fitting all combustion turbines with capture and requiring each plant to consume 20% more fuel per unit of electricity produced to power CCS.3
- Carried out comparative scenario analysis: We simulated several scenarios, including (1) pre-retrofit, business-as-usual, (2) post-retrofit, with and without a PPA, and (3) post-retrofit, with and without the 45Q tax credit, to isolate the impact of different procurement agreements and policy landscapes on grid-wide emissions.
What Our Analysis Reveals
Results of this analysis reveal how CCS deployment in the power grid interacts with market economics and the role mechanisms that drive high utilization of CCS retrofit plants can have in ensuring system-wide emissions reductions:
CCS With a Firm Offtake Agreement Can Significantly Reduce Grid-Wide Emissions
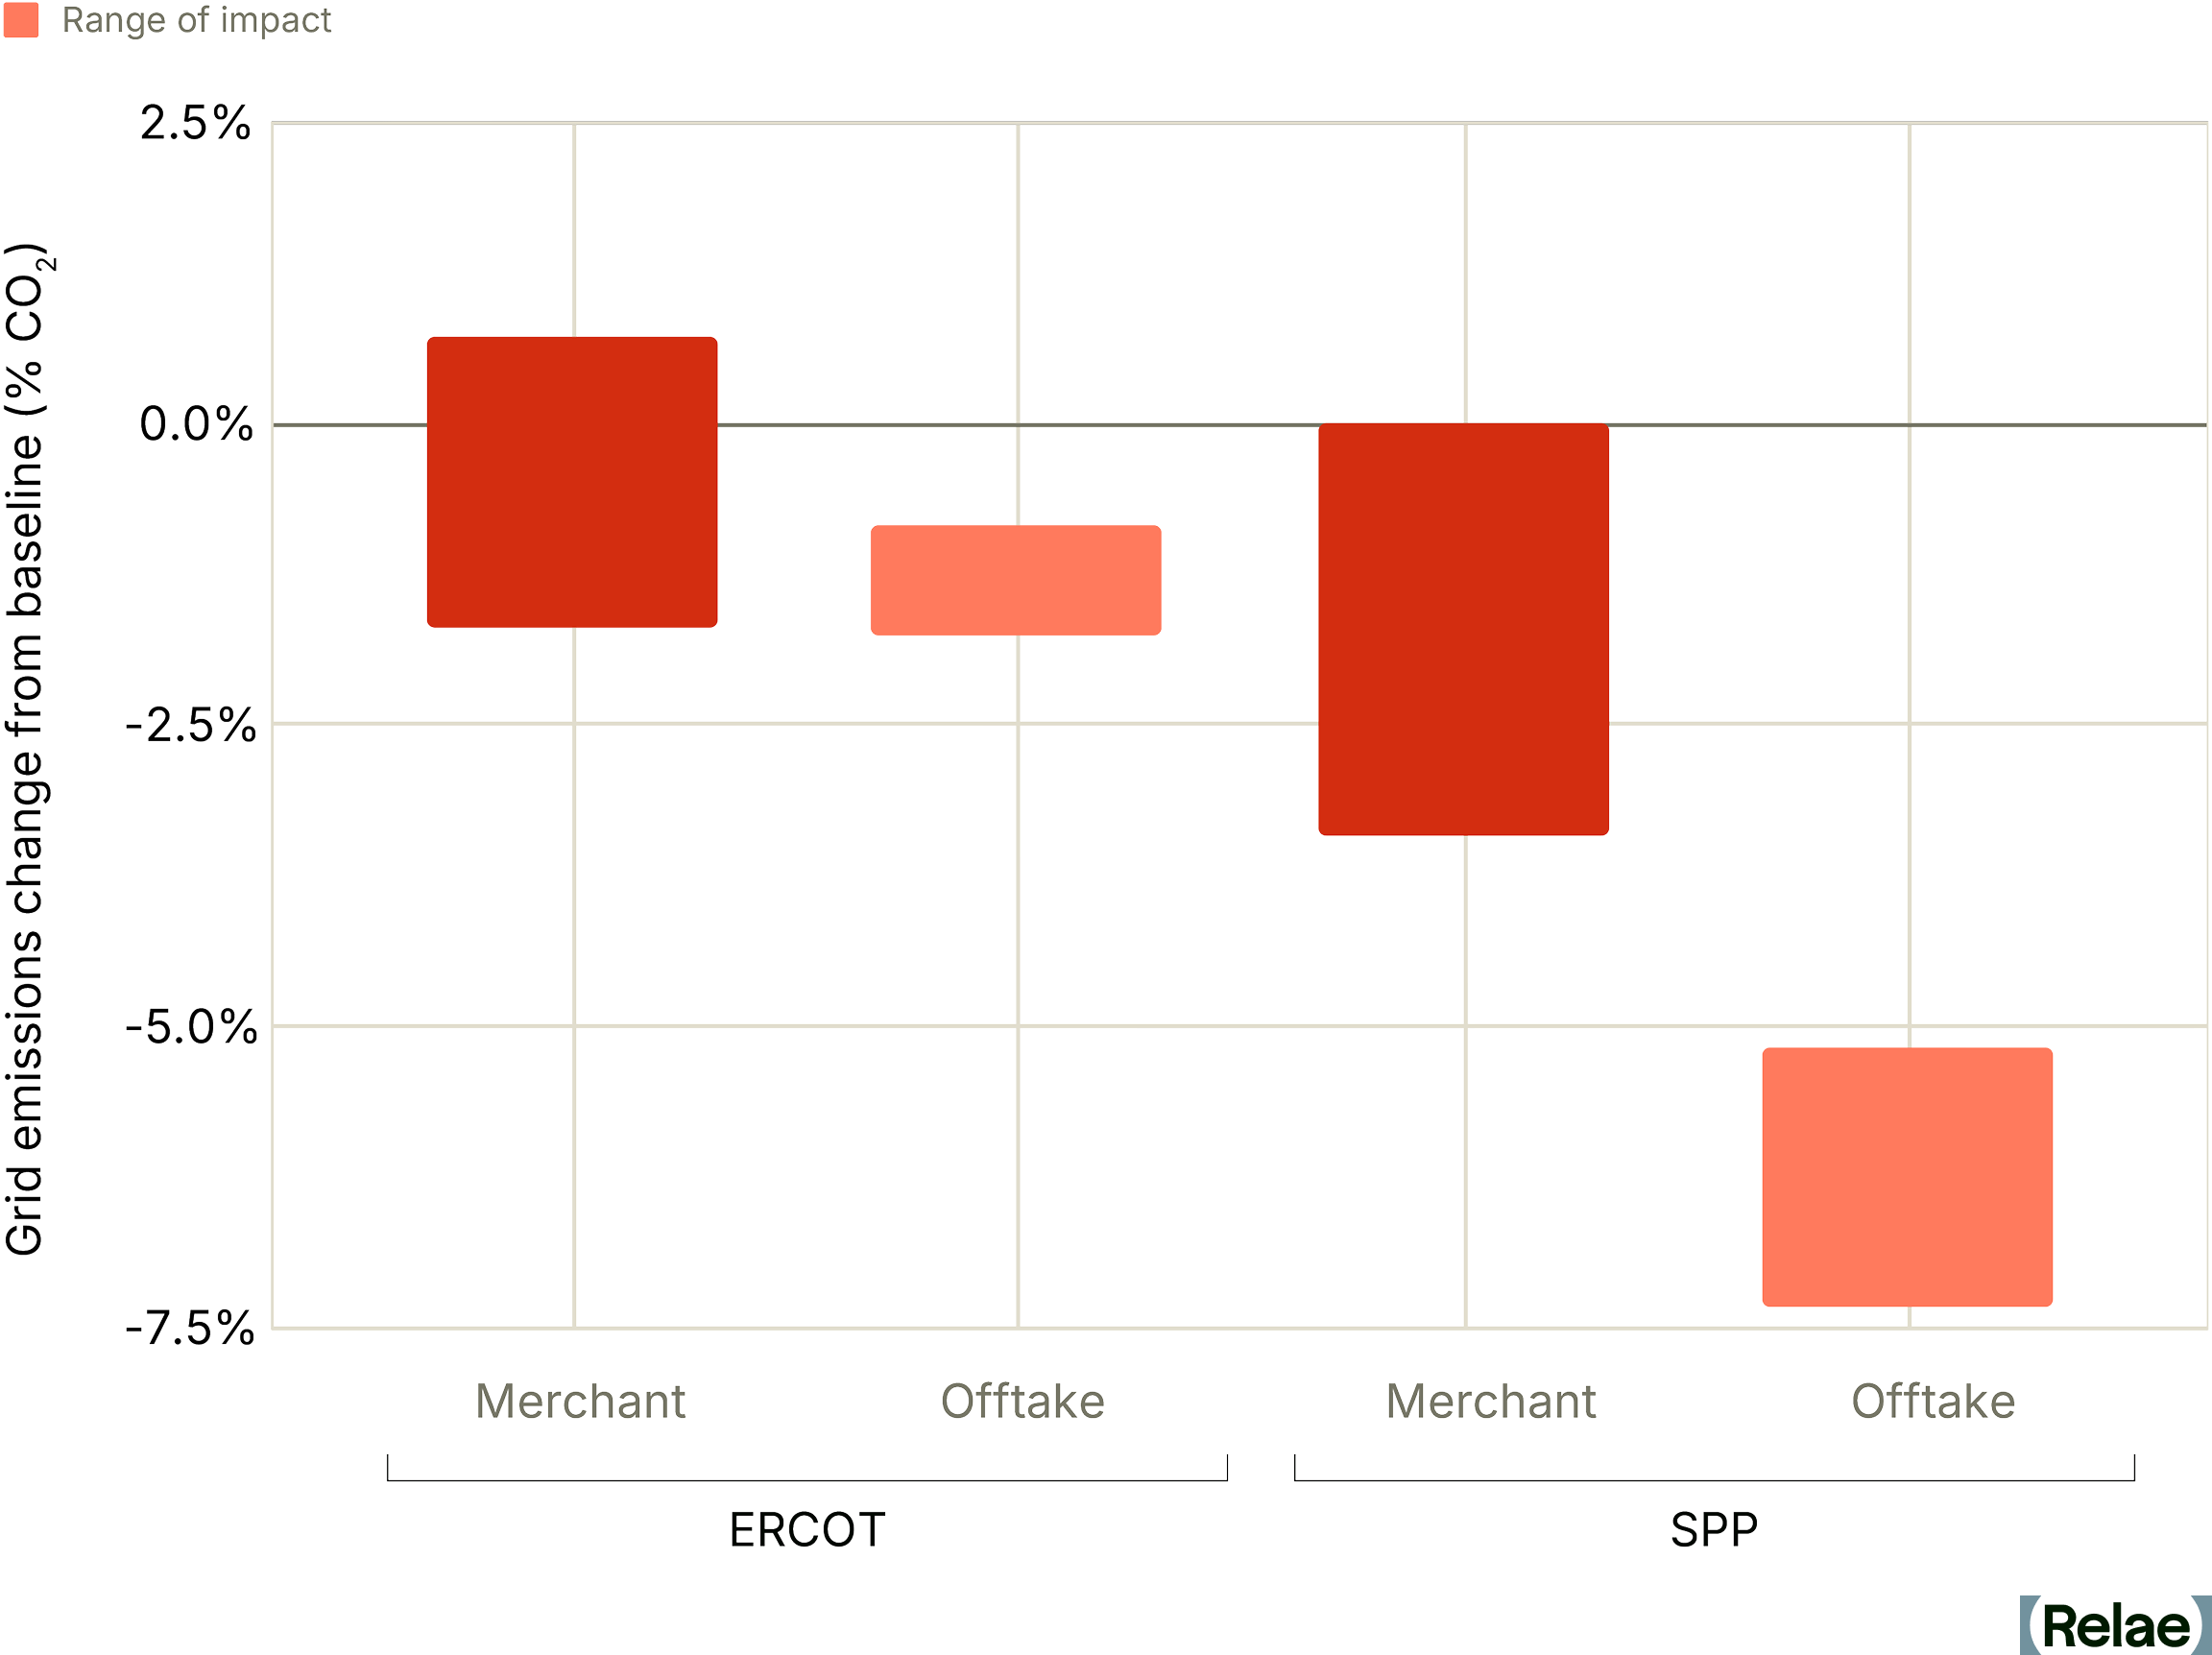
Pairing a retrofitted plant with a dedicated offtaker can drive meaningful emissions reductions in both ERCOT and SPP compared to business-as-usual (-0.8% to -1.7% CO2 in ERCOT; -5.2% to -7.3% CO2 in SPP). Under these arrangements, system-wide emissions fall because the PPA acts as an operational anchor, ensuring the retrofitted plant maintains high utilization rates despite its higher running costs. Ensuring the plant stays utilized prevents the grid from reverting to more carbon-intensive generation to fill the gap.
Our analysis finds the value of the operational “clean, firm premium” for natural gas with CCS power is up to $60 per MWh. This value varies by hour, region and scenario but results generally align with our previous estimate of a $30 per MWh value associated with this type of generation. Other estimates put this value between $19 and $72 per MWh.
CCS Without an Offtake Agreement Can Reduce Emissions, But Is More Reliant on Policy Support
Without a dedicated offtake agreement or policy support, retrofitting natural gas plants with CCS runs the risk of a small increase in grid emissions (+0.7% CO2 in ERCOT; -0.0% CO2 in SPP). System-wide emissions are higher because other power plants displace the plants with carbon capture. The higher operational costs of CCS mean the CCS plants have a less competitive place in the merit order and run for fewer hours in the year.
The story changes with the application of 45Q, and grid-wide emissions are lower for both ERCOT and SPP (-1.7% CO2 in ERCOT; -3.4% CO2 in SPP). Access to the 45Q tax credit improves each CCS plant’s position in the merit order, meaning that it runs for more hours and successfully displaces higher-emitting generation with clean, firm power.
The Path Forward for Clean, Firm Power
Our analysis illustrates that in competitive power markets, the overall carbon emissions impact of natural gas generation with CCS cannot be measured solely at the power plant level. While clean, firm power remains a strategic priority for large electricity buyers, and CCS is a key tool to meet this demand, the overall climate value of a successful retrofit is linked to the availability of offtake agreements and the plant’s position in the merit order.
A systems-level perspective captures what facility-level analysis misses: how market dynamics determine the true climate impact of decarbonization investments. Support mechanisms for the continuous operation of low-carbon power plants, like PPAs and the 45Q tax credit, are important tools that ensure clean, firm power reaches the grid, effectively bridging the competitiveness gap.
Frequently Asked Questions
How can companies ensure CCS retrofits actually reduce grid-wide emissions?
By securing the plant’s dispatch through a long-term offtake agreement, or by utilizing a policy incentive like 45Q. Relae’s modeling found that offtake agreements have a substantial impact on the emissions reduction potential of CCS retrofits.
Why would the dispatch decisions of one power plant affect others?
Power plants dispatch according to marginal cost, and grid stability requires that total supply remain constant at any given moment. So, if one large plant suddenly dispatches less (say, because its operating costs have increased), other potentially dirtier plants may ramp up to fill the gap, increasing total system emissions.
Key Trends in the 2026 Voluntary Carbon Market
Key Takeaways
- What's happening: The voluntary carbon market (VCM) stalled in 2025, with carbon credit retirements falling 7% despite a 227% surge in corporate climate commitments.
- Why it matters: Over 80% of high-durability carbon removal capacity is at risk of not being realized without additional offtake.
- The implication: For corporate buyers with 2030 climate targets, early movers will define market standards and secure the supply they need, while those who wait risk volatility and constrained access to high-quality credits.
Why the Voluntary Carbon Market Needs Action Now
The voluntary carbon market stands at a crossroads. Credit retirements in 2025 fell far below the billion-tonne-scale projections from earlier in the decade. There is a widening gulf between climate ambition and market action.
The VCM transacts credits that avoid, reduce, or remove emissions. Carbon dioxide removal (CDR), the process of removing and durably storing atmospheric CO₂, remains a small but critical segment, accounting for 5% of credits retired. Limiting overshoot of 1.5°C requires a rapid scale-up of CDR.
However, most organizations with 2030 climate goals have yet to engage in CDR procurement. Without clear market signals today, CDR supply will falter. What's missing isn't capability or knowledge, but the commitment to act. Early movers will define the market in its early stages, while latecomers may face volatility and uncertain supply.
Our latest analysis reveals both troubling trends and clear pathways forward for CDR buyers ready to move from commitment to execution.
[cta]
Five Years of Stagnation: The VCM Falls Short of Projections
For five consecutive years, muted growth and persistent oversupply of poor-quality credits have defined the market. In 2025, credit retirements—a proxy for spot-market demand—reached 157 million metric tonnes (Mt), down 7% from 2024.
This incremental growth is far below what market analysts anticipated earlier in the decade, when several projections expected demand to exceed 1 billion tonnes by 2030.
VCM Credit Trends: Concentrated in Avoidance and Reduction
The VCM has historically been concentrated in avoidance and reduction carbon projects, largely dominated by REDD+, renewable energy, and cookstove credits. 2025 marks the first year a new credit type has dominated, though: projects that reduce emissions of superpollutants now make up roughly 20% of all credits issued in the VCM. Superpollutant issuances increased by about 180% between 2020 and 2025, while retirements grew by roughly 150%.
CDR Remains a Small but Critical VCM Segment
In 2025, CDR credits accounted for only 5% of 2025 retirements, but have a more active forward offtake market—where buyers commit today to purchase credits that will be delivered in the future, providing crucial early-stage financing for projects.
Within the CDR category, high-quality credits are still hard to find. Applying our Criteria for High-Quality Carbon Dioxide Removal, we find that less than 10% of the CDR projects we review meet our high-quality threshold with minimal reservations.
Nature-Based CDR Dominates the Spot Market
Of the all CDR credits issued in the VCM in 2025, 95% originated from nature-based CDR pathways, while 5% represented high-durability CDR pathways such as biochar or bioenergy with carbon capture and storage (BECCS). This distribution reflects the mature role that nature-based CDR projects continue to play in the market, alongside the early stage of durable CDR deployment.
Within nature-based credits, supply and demand dynamics differed significantly between afforestation, reforestation, and revegetation (ARR) and improved forest management (IFM).
- For ARR credits, issuances and retirements have tracked closely at a roughly 1:1 ratio, with issuances remaining flat at around 7–8 Mt annually over the past four years, leaving little inventory available for spot purchasing.
- IFM credits, by contrast, have grown 2.5-fold since 2023, making them one of the largest sources of growth within nature-based credits, though high-quality CDR credits from IFM are in much lower supply.
For buyers, this means ARR credits are increasingly difficult to source on the spot market, while IFM credits are more readily available—though careful diligence is needed to identify high-quality projects.
Nature-based offtakes and commitments have expanded in recent years, with more than 90 Mt of future delivery now contracted or committed. The vast majority of these commitments are concentrated in ARR projects, highlighting both the supply constraints facing ARR today and buyers' foresight in securing the supply they will need in the near future.
High-Durability CDR Is Almost Entirely Forward-Looking
The spot market for high-durability CDR credits represents only 0.3% of activity in the VCM, but important dynamics are beginning to emerge as more high-durability CDR technologies reach the market.
From 2021 to 2025, roughly 80% of high-durability issuances and retirements came from biochar and geologic storage. However, the emergence of large-scale geologic CDR projects is beginning to shift the balance, with individual projects capable of delivering hundreds of thousands of tonnes annually. Early-stage methodologies such as enhanced rock weathering (ERW) and ocean alkalinity enhancement (OAE) issued their first credits in 2025, totaling roughly 12,000 tonnes.
While the spot market for high-durability CDR is growing and diversifying, forward offtake agreements continue to define the landscape. The ratio of high-durability spot retirements to volumes committed through forward offtake is 1:70—meaning for every tonne retired today, 70 tonnes have been committed for future delivery.
Forward Offtake Commitments Are Rising Across CDR Pathways
To date, forward offtake agreements, advanced market commitments (AMC), and large contracted deals with intermediaries cover more than 40 Mt of high-durability CDR, in addition to over 90 Mt of nature-based CDR. These cumulative volumes highlight the increasingly central role of forward purchasing in shaping future supply, particularly for capital-intensive, high-durability pathways.
However, the success of forward offtake strategies depends critically on careful due diligence. Without a rigorous assessment of technological readiness, project viability, and delivery risks, forward commitments risk financing projects that fail to deliver, undermining both individual investments and broader market confidence.
Market Concentration of Forward Offtake Remains High
A small group of companies continues to drive the majority of forward offtake activity. In 2025, Microsoft remained the clear market leader, accounting for roughly 60% of contracted nature-based CDR offtakes and more than 80% of high-durability offtakes with a named buyer announced to date. Other active buyers—including Google, JPMorgan Chase, Equinor, and Amazon—have expanded their commitments, but overall market concentration remains high.
This concentration reveals both opportunity and risk: while anchor buyers are proving the market model works, broader participation is needed to unlock the full scale of CDR deployment required.
Growing Gap Between Climate Ambition and Market Action
Corporate climate targets anchor most current VCM activity: All of the top-10 buyers in the market today participate based on either self-declared commitments or net-zero commitments aligned with the Science Based Targets initiative (SBTi).
Demand forecasts based on these future commitments project that total CDR demand could reach 46-110 Mt by 2030, a ~6-14x growth from today. Yet, how companies decide to implement their targets will ultimately affect the composition of CDR demand within the VCM.
Rather than relying solely on public commitments, we analyzed the behavior of companies that are actively purchasing CDR today. Should today's top buyers follow through on their stated CDR commitments, CDR demand could reach a minimum of 28 Mt by 2030, with 6.5 Mt of demand for high-durability CDR.
However, the discrepancy between observed demand and target-led scenarios shows a persistent gap between what companies say and what they do. SBTi reported a 227% surge in companies setting both near-term and net-zero targets in the 18 months leading up to mid-2025, while carbon credit retirements in the VCM fell 7% in 2025.
Shifting from intention to execution will ultimately determine whether the VCM evolves into a durable, functioning marketplace or stalls short of the scale required for credible, net-zero pathways.
Rising Trends of Greenhushing and Anonymity Obscure CDR Demand
In the broader VCM, 55% of tonnes retired on the spot market over the past three years have been anonymous, and that fraction has been increasing. A similar trend is true of high-durability CDR: nearly 40% of all offtake transactions made in 2025 did not disclose the participating buyer. This buyer behaviour could reflect the often-discussed greenhushing phenomenon.
When anonymous actors dominate, it becomes harder to track demand signals, verify corporate progress, and establish clear integrity benchmarks. This opacity creates systemic risk for the entire market.
Market Growth Tipping Points on the Horizon
Several pivotal events on the horizon could mitigate risk and unlock project development, tipping buyers into action after half a decade of limited market growth:
- Voluntary demand: SBTi's Corporate Net Zero Standard V2.0, published in June 2026, confirms credits still can’t count toward scope 1-3 targets, but introduces a voluntary recognition program starting in 2027 and mandatory removal purchasing for large companies from 2035, starting at 1% of footprint.
- Compliance demand: The UK's Emissions Trading Scheme (ETS) Authority has already committed to integrating carbon removals into the UK ETS by 2028 via an auction model. This is the first confirmed large-scale compliance pathway for CDR credits, though credit-type eligibility is still being worked out.
- Regulatory support: Publication of Article 6.4 methodologies under the Paris Agreement and loosening of CORSIA credit supply bottlenecks could expand eligible supply and boost buyer confidence.
These tipping points in policies, standards, and market structures are advancing with clear timelines, creating conditions to move CDR procurement from hesitation to activation.
CDR Supply Faces Critical Challenges
While buyer inaction poses one threat to market growth, the supply side faces its own critical challenges.
30%–220% More Investment Is Needed in Nature-Based CDR Supply
Nature-based CDR would require a 30%–220% increase in finance to support current corporate targets. Relae (formerly Carbon Direct) has identified US$18 billion in publicly committed funds for nature-based CDR announced from 2018 to 2025. If deployed immediately to generate high-quality CDR, this level of funding could translate into up to 32 Mt per year by 2030 and 290 Mt cumulatively through 2040.
This is sufficient to meet the conservative 28 Mt demand floor from today's active buyers—but falls well short of what would be needed if even a fraction of companies with 2030 targets begin executing on their stated commitments.
80% of High-Durability CDR Projects Are at Risk
The situation is more acute for high-durability CDR. We estimate that over 80% of the total 2030 credit supply pipeline is at risk, due to insufficient project offtake and financing agreements.
Without increased offtake and financing support, we expect that the landscape for capital-intensive, high-durability CDR may consolidate
CDR Buyers Will Determine Which Projects Get Built
The supply-side ecosystem features a sufficient number of high-quality CDR suppliers with the potential to scale. These suppliers face purchasing behavior insufficient to meet buyers' own stated climate goals. In this environment, every CDR procurement decision matters. Companies that delay procurement risk missing their own climate targets while also ceding competitive advantage to early movers who secure the limited supply of high-quality credits.
Five Actions to Strengthen the CDR Market
Buyers and investors can play a critical role in reducing project risk and strengthening the CDR market. Our full report details five essential actions:
- Use purchasing power wisely
- Prioritize project diligence
- Construct bankable contracts
- Support market data transparency and CDR goals
- Undertake project assurance
Each action addresses specific market failures and, when implemented strategically, can significantly improve the likelihood that high-quality CDR projects reach operation and deliver credits as contracted.
With 2030 only four years away, the window for action is rapidly closing. Early movers will secure supply and define market standards, while those who wait risk entering a crowded market with limited access to high-quality credits and escalating prices.
[cta]
Frequently Asked Questions
Why did the voluntary carbon market stall in 2025 despite rising corporate climate commitments?
Retirements fell 7% even as SBTi reported a 227% surge in companies setting near-term and net-zero targets. The gap reflects that most companies with 2030 goals haven't yet moved from setting targets to actually procuring credits.
Is carbon dioxide removal a proven market today, or still emerging?
CDR remains a small segment—about 5% of 2025 retirements—but it has an unusually active forward market, with buyers committing today to volumes delivered years from now. High-durability pathways like biochar and geologic storage are still early-stage relative to nature-based credits.
How does the new SBTi Net-Zero Standard affect corporate carbon credit strategy?
Under the new SBTi Net-Zero Standard, credits still can't be counted toward scope 1, 2, or 3 targets. But it introduces a voluntary recognition program starting in 2027, and requires large companies to begin purchasing carbon removals from 2035, starting at 1% of their footprint.
What should CDR buyers prioritize given current market conditions?
Given how concentrated forward offtake activity is today, buyers should prioritize rigorous project diligence and bankable contract structures over simply committing volume—the 2026 State of the Voluntary Carbon Market report details five recommended actions in more depth.
AI Scale and Climate Commitments: A 2026 Outlook
The AI and Climate Execution Challenge
Data center energy capacity in the US is projected to increase from 25 GW to 120 GW by 2030—a fivefold increase. Hyperscalers are projected to invest $7 trillion globally in data center infrastructure through 2030, with approximately $2.8 trillion invested in the US.
While 2025 was defined by a 'scale at all costs' scramble for compute, in 2026, the new mandate is responsible scale: reconciling voracious power demands with aggressive net-zero commitments and rising energy costs.
Grid constraints determine the geography and velocity of growth, forcing companies into complex trade-offs between speed-to-market and “clean, firm” power, which can take years to develop. Evolving carbon accounting rules are shifting procurement strategies and infrastructure choices at this trillion-dollar scale, creating a “carbon debt”—embodied emissions that will stay on the books for decades. In 2026, the competitive advantage likely belongs to those who integrate power, hardware, and climate strategy from day one.
Powering AI: Grid Reliability, Constraints, and Interconnection
Grid infrastructure faces reliability challenges from aging systems and capacity constraints. Interconnection queues stretch three to five years for renewables, while large electrical load interconnection lacks consistent standards.
Federal Regulatory Response
The federal government is moving to standardize these processes, with a critical decision point in 2026. For companies planning data center deployments in 2026, understanding these regulatory shifts is likely essential to realistic timeline and site selection planning.
On October 30, 2025, the US Department of Energy (DOE) leveraged Section 403(a) of the DOE Organization Act to direct the Federal Energy Regulatory Commission (FERC) to issue a rulemaking to “ensure efficient, timely, and non-discriminatory load interconnections” for large (>20 MW) electrical loads.
By April 30, 2026, FERC is expected to issue a final rule on large electrical load interconnections for grid operators, providing federal regulations for approval pathways, timelines, and rates.
Public comments on DOE’s advanced notice of proposed rulemaking were due on December 5, 2025, and grid operators, utilities, NGOs, and customers submitted over 150 comments reflecting a wide range of perspectives.
While federal standardization should reduce procedural uncertainty, it doesn't create new grid capacity. Even with clearer approval pathways, the underlying supply-demand mismatch remains a primary gating factor for growth.
Bridging the Supply-Demand Gap
Data center energy demand is surging, but new clean electricity generation takes years to build. This mismatch between accelerating demand and slow-building supply is forcing the industry to pursue solutions on two timelines: near-term load flexibility strategies that unlock existing capacity, and long-term generation investments that build new power supply.
Load Flexibility: Near-Term Grid Access
Load flexibility is emerging as a possible path to faster grid connection. Oracle, NVIDIA, Emerald AI, and Salt River Project's joint research demonstrated 25% power reduction during peak hours through workload tiering. The demonstration shows that if data centers reduce consumption during peak times (roughly 1% of the year), it unlocks 126 GW of currently constrained capacity that could be available now.
Large power loads increasingly face incentives or mandates to demonstrate flexibility as part of interconnection agreements, making this an access requirement, not an optional efficiency measure. For example, Senate Bill 6 in Texas mandates that data centers and other large loads must reduce their consumption during certain grid peak times. Many other state legislatures are passing legislation that will impact data centers.
Storage has shifted from smoothing renewables to enabling multiple strategies: making intermittent renewables firmer, providing grid reliability services, and supporting 24/7 matching. Storage may emerge as a solution to allow data centers to reduce grid consumption during peak hours while maintaining operations.
Relae helps clients design load flexibility strategies under evolving regulatory frameworks: evaluating behind-the-meter generation options, sizing storage for peak reduction scenarios, and structuring interconnection configurations that preserve optionality across accounting methodologies.
Clean Firm Power: Long-Term Generation
Hyperscalers remain committed to clean, firm generation that’s reliable: power that's both low-carbon and dispatchable 24/7. Natural gas with carbon capture and storage (CCS) is emerging as a critical bridge technology. Google's 400 MW CCS power agreement with Broadwing, expected online in 2029, demonstrates commercial demand at scale.
In our analysis evaluating CCS pathways, commercial viability depends on rigorous assessment of permitting timelines, capital and operating costs, storage geology, vendor compatibility, and 45Q tax credit optimization. Execution has been most prevalent where technology intersects with regulatory approval and storage access.
Hyperscalers are also investing across geothermal, nuclear, including Small Modular Reactors (SMR), hydrogen, and fusion. Long-duration energy storage has also been an area of focus. Each has different risk profiles and opportunities across technical maturity, permitting, commercial viability, emission accounting methodology, dispatchability, and political support.
Evaluating these pathways requires multi-dimensional frameworks. Each technology faces distinct challenges: SMRs struggle with execution complexity, geothermal with extended development periods, and hydrogen with production-dependent carbon intensity. Tax credit eligibility (particularly 45Q for CCS and 45V for hydrogen) significantly impacts project economics.
Both power generation and data center Infrastructure site selection require integrating environmental and social vulnerability data to avoid community conflicts that delay or stop projects.
Power Accounting Rules Determine Clean Energy Procurement
The Greenhouse Gas (GHG) Protocol extended the public consultation period for proposed scope 2 guidance changes to January 31, 2026. The results will determine clean energy procurement strategies and the carbon value of load flexibility for the next decade.
The proposed shift in electricity emissions accounting could increase clean energy procurement costs for buyers. The accounting methodological debates matter for hyperscalers: 24×7 energy matching versus carbon matching. The issues of deliverability (being located in the same grid region) and additionality (being new, rather than repurposed, generation) are also hotly debated.
These different frameworks strongly influence whether natural gas with CCS, nuclear, geothermal, or battery-backed renewables are considered optimal for a site, and whether load flexibility has carbon value.
Companies need to model scenarios across advanced power emissions methodologies, evaluating portfolio costs and carbon performance before final standards are published in 2027. Companies are also signing forward renewable energy certificate contracts (RECs) and structuring power purchase agreements (PPAs) now to preserve optionality across scenarios.
AI Infrastructure Emissions at Scale
Data center construction creates substantial scope 3 emissions, and their relative importance depends on grid carbon intensity. For facilities powered by average-carbon grids, scope 2 operational emissions dominate. But for data centers powered by very low-carbon electricity (renewables or nuclear), scope 3 embodied emissions can represent 40% of total lifetime greenhouse gas emissions.
In AI data centers, IT equipment drives the majority of embodied emissions. Chips and memory account for 67%, followed by structural materials at 17%, with server power supplies, aluminum, and other components comprising the final 16%.
Direct procurement of low-carbon materials faces constraints: limited supply, geographic concentration, and contracting complexity. Environmental Attribute Credits (EACs) provide an interim pathway by decoupling environmental benefits from physical materials, but require rigorous quality standards and verification to ensure real emissions reductions.
Our high-quality EAC criteria, developed with Microsoft, establish standards that separate market-making from greenwashing. Levelized Cost of Carbon Abatement frameworks make materials decisions comparable to power decisions, treating infrastructure decarbonization as portfolio optimization, not separate workstreams.
Carbon Removal: Addressing Residual Emissions
Complete supply chain decarbonization by 2030 isn't feasible. Despite aggressive efforts to procure clean power and reduce construction emissions, residual emissions will remain significant. For hyperscalers with net-zero commitments, carbon dioxide removal (CDR) has shifted from an optional component to a structural necessity. Microsoft remains the world's largest CDR buyer, and Google increased purchases 14-fold from 2023 to 2024.
CDR credit quality varies widely. Companies must apply science-based principles to evaluate credits. Our Criteria for High-Quality CDR, developed in collaboration with Microsoft, establishes six science-based principles for evaluating credits—critical as emerging hyperscaler and other corporate demand high-integrity supply.
AI and Climate: Looking Ahead
The window for strategic maneuvering is narrow. The AI infrastructure buildout is happening now, and the decisions made in 2026 will impact a company’s cost structure and carbon profile for years.
Companies treating power, infrastructure, and decarbonization as separate workstreams will face compounding constraints. The winners of the AI era will be those who integrate power, infrastructure, and carbon strategy into a single, cohesive system.
The New Geothermal Energy: How EGS Unlocks Clean, Firm Power at Scale
Key Takeaways
- Enhanced geothermal systems (EGS) overcome traditional geothermal energy limitations by engineering subsurface conditions rather than searching for them, enabling widespread deployment of clean firm renewable power.
- Induced seismicity from high-pressure injection has caused major EGS project cancellations, but advanced approaches like Sage Geosystems’ gravity-assisted fracturing mitigate this risk by avoiding overpressures and directing fractures downward away from fault zones.
- Sage’s $97 million Series B financing, co-led by Ormat Technologies and Carbon Direct Capital, will fund the first commercial EGS facility at an existing Ormat plant—accelerating the transition from innovation to grid-scale deployment.
- For hyperscalers racing to power AI infrastructure, EGS offers a credible path to firm, 24/7 low-carbon power at scale.
Geothermal Energy: The Heat (And Pressure) Is On
For decades, geothermal energy has occupied a compelling yet narrow place in the clean energy landscape. It offers what the grid increasingly needs— firm, renewable, low-carbon power—yet has remained constrained by limited siting flexibility, high upfront resource risk, and persistent concerns around induced seismicity.
Enhanced geothermal systems (EGS) change that equation. Instead of searching for ideal subsurface conditions, EGS engineers them directly. In doing so, EGS rewrites the rules of where geothermal energy can be deployed and how far it can scale, with the potential to transform this historically niche resource into a widely deployable form of clean firm power.
One such solution, Sage Geosystems, uses a pressure-managed EGS approach to extract geothermal energy from engineered subsurface reservoirs, while explicitly addressing the seismicity risks that have constrained earlier projects.
How EGS Scales Geothermal Energy
Conventional geothermal power relies on a narrow set of subsurface conditions: sufficiently high temperatures, naturally occurring fluid, and enough permeability to circulate fluid through hot rock. In practice, those conditions coexist in only a few places—nearly all US commercial geothermal power generation is concentrated in California, Nevada, and a handful of sites across Utah and Hawaii.
EGS reduces this constraint by engineering permeability and fluid access rather than relying on their natural presence. While fluid access and permeability are harder to find, heat is not: the Earth’s natural geothermal gradient ensures that hot rock exists almost everywhere at sufficient depth.
By reducing the number of variables that must be discovered rather than designed, EGS expands siting flexibility and lowers the resource risk that has historically constrained geothermal development. The Department of Energy (DOE) estimates this approach could unlock more than 5,500 GW annually of US resource potential, which, when converted to electric power, is roughly comparable to the total installed power capacity of the US today.
One remaining challenge has been induced seismicity. When you inject pressurized water into rock and create fractures, you are adding lubrication to geological systems that have been static for millions of years. If those fractures propagate into existing fault zones, the faults can slip, producing earthquakes. Projects in Basel, Switzerland (2006) and Pohang, South Korea (2017) triggered magnitude 3.4 and 5.4 events, respectively, both leading to project cancellations and regulatory backlash that set the industry back years.
Sage's approach to EGS is designed to address this risk directly. Rather than relying on high-pressure hydraulic stimulation, Sage uses a gravity-assisted fracturing approach that helps avoid the high overpressures that can drive fault slip. Further, its approach biases fracture growth downward and away from shallow, critically stressed fault systems. By understanding causes and conditions, Sage aims to work with the subsurface, not against it.
This is not a minor technical detail. It is the difference between a technology that can scale with community acceptance and one that faces opposition at every site. For a hyperscaler evaluating geothermal offtake agreements, seismicity risk translates directly into permitting risk, timeline risk, and reputational risk.
The Clean Firm Power Gap Driving EGS Adoption
To understand why this matters, start with the problem hyperscalers are trying to solve. Solar and wind have scaled dramatically, but they face a structural limitation: they do not generate power when the sun is not shining or the wind is not blowing. Batteries help bridge short gaps, but current technology cannot economically cover multi-day periods of low renewable output. Nuclear provides firm generation, but faces permitting timelines that extend well past 2030.
This creates what might be called the 'clean firm power gap'—the difference between what hyperscalers need (24/7, low-carbon, scalable to gigawatts) and what current markets can supply. A single large AI training cluster can consume more than 100 MW continuously. Meta, Google, and Microsoft are planning data center campuses that will require gigawatts of capacity. The gap between demand and available clean firm power supply is widening, not narrowing.
Geothermal energy aligns closely with this need. Unlike solar or wind, geothermal power plants run continuously, with capacity factors that routinely exceed 90%. And unlike nuclear, geothermal projects can, in principle, be permitted and built on shorter timelines. The challenge has never been performance, rather availability: with the emergence of EGS, geothermal power is expanding where clean firm power can realistically be built, arriving at a moment when the grid’s need for dependable, low-carbon supply has never been greater.
Sage Raises $97 Million to Deploy Geothermal at Ormat Site
Sage Geosystems announced $97 million in Series B financing co-led by Ormat Technologies, the world's largest geothermal operator, and Carbon Direct Capital, a leading energy investing firm. Ormat will host Sage's first commercial facility at an existing Ormat plant.
The investment signals that EGS has become investable to the industry built to scale it. For Ormat, the logic is clear: conventional geothermal is constrained by resource availability. EGS expands the addressable market, but requires the subsurface capabilities that conventional operators don't typically possess by Sage does.
Why the Partnership Structure Works
EGS proposes that the fastest way to scalable power is to eliminate the resource risks that beset conventional geothermal projects. These risks do not simply disappear: they are transferred into subsurface and remain unproven at scale. Conventional operators locate naturally permeable reservoirs. EGS requires creating permeability in crystalline rock and managing induced seismicity risks that don't exist in hydrothermal systems. Sage is actively addressing the seismicity problem that ended projects in Basel and Pohang. Ormat brings everything else: turbines, plant operations, grid expertise, and six decades of operational knowledge.
Building at an existing Ormat site provides another advantage: established subsurface characterization, proven geological stability, and grid infrastructure already in place. For a first commercial deployment, this de-risks demonstration in ways greenfield sites cannot.
Both companies move faster together because the technical capabilities required to make EGS work don't naturally exist within a single organization.
What Hyperscaler Demand Means for the Power Sector
Meta's 150 MW power purchase agreement with Sage—announced in August 2024, with delivery planned for sites east of the Rocky Mountains—adds another dimension to this story. Hyperscalers have concluded that waiting for clean firm power technologies to mature before signing contracts means those technologies may not be available when needed. So they are becoming anchor customers, providing the revenue certainty that enables projects to secure financing.
For geothermal power specifically, this demand signal is transformative. Contracted offtake from creditworthy counterparties changes project economics fundamentally. It lowers the cost of capital, enables debt financing, and de-risks the investment case for additional capacity. The hyperscaler model has already accelerated deployment in solar, wind, and battery storage. Its application to geothermal power may prove similarly catalytic.
The Final Constraint
EGS is not a silver bullet, but it is beginning to look like a credible answer to a growing-problem: how to deliver clean firm power at scale, in more places, and on timelines that match accelerating demand. Advances in subsurface engineering are reducing the resource and seismicity risks that once confined geothermal to a narrow footprint, while partnerships with incumbent operators are showing how those advances can be integrated into existing energy infrastructure.
At the same time, hyperscalers are reshaping the market by signaling demand early, underwriting first deployments, and pulling technologies forward rather than waiting for them to mature on their own. That combination of technical progress, industrial adoption, and committed buyers is what turns promising concepts into deployable systems.
Whether EGS ultimately fulfills its potential will depend on repeatable and continued performance under real-world conditions. But the recent alignment of science, incumbents, and demand suggests EGS is moving beyond possibility and into a phase where the final constraint is no longer what the Earth can provide, but what the energy system is prepared to build.
Frequently Asked Questions
What is an enhanced geothermal system?
An enhanced geothermal system, or EGS, produces geothermal energy by engineering underground conditions needed to circulate fluid through hot rock. Unlike conventional geothermal projects, which depend on naturally occurring heat, fluids, and permeability occurring together, EGS can create or enhance permeability and fluid circulation, greatly expanding the locations where geothermal power may be developed.
Why is EGS important for data centers and AI infrastructure?
AI and data centers require large amounts of electricity around the clock, creating demand for power sources that are both low-carbon and firmly available. EGS could provide high capacity factor (greater than 90%), 24/7 clean electricity in more locations than conventional geothermal, making it a potentially valuable complement to intermittent renewable resources.
What is induced seismicity, and how are new EGS technologies addressing it?
Induced seismicity refers to earthquakes caused by changes in underground pressures or stresses caused by human activities. Earlier EGS projects demonstrated that high-pressure fluid injection can activate existing faults and in some cases triggered noticeable earthquakes and intense public backlash. New EGS approaches are being designed to better control reservoir pressure, fracture development, and proximity to faults, reducing seismicity risk while maintaining the fluid circulation needed to extract geothermal energy.
Can EGS be deployed anywhere?
EGS substantially expands geothermal’s geographic potential, but it does not make every location equally suitable. Projects still depend on factors including underground temperature, how deep they need to drill to access that temperature, water availability, seismic risk, and whether the rocks are of type suitable to hold and sustain engineered fracture networks.
Data Centers and Their Energy Use: Trends in State Capitals
This article was originally published in collaboration with the Center on Global Energy Policy at Columbia University as part of its Energy Explained series.
Key Takeaways
- Attention to data centers is skyrocketing in state capitals across the United States.
- In data center bills passed by state legislatures in 2025, two topics dominated: locational incentives (such as reduced sales taxes) and ratepayer protection. Many bills addressing data centers' water use and environmental risks were proposed, but few were enacted.
- Almost all the enacted bills encouraging data centers to locate in a state were passed by Republican legislatures, and more bills addressing data centers' environmental risks were proposed in Democratic legislatures than Republican legislatures. Concern about the impacts of data centers on power prices was bipartisan.
Introduction
From east to west and north to south, in red states and blue states, attention to data centers is skyrocketing in state capitals across the United States. Our research identified more than 190 bills on data centers introduced in state legislatures in the first 11 months of 2025—roughly nine times the number of such bills introduced in 2024. The bills address a wide range of topics, including economic development, ratepayer protection, grid reliability, and disclosure of data centers' energy use and environmental impacts. More than two dozen of these bills were enacted into law.
This newfound interest in data centers in state capitals is unlikely to abate anytime soon. The data center industry is growing at a staggering pace. A recent McKinsey report projected roughly $2.8 trillion in spending on data center infrastructure in the US by 2030. In 2024, data centers used roughly 4–5% of the electricity produced in the United States—a percentage projected to grow sharply in the years ahead. A rapid buildout of data centers and electricity infrastructure to support them offers economic and strategic benefits but also creates risks for ratepayers, water resources and the environment.
State policymakers are on the front lines of these issues. State governments promote economic development, regulate electricity rates and have jurisdiction over many local resource and environmental issues. Different stakeholders have strongly conflicting views on data centers, setting up high-profile debates in state capitals as well as in Washington, DC.
This blog post—the first entry in a project that will explore state data center policies, power prices and related topics—presents these findings.
Methodology: Tracking Data Center Legislation
We (the authors of this article) queried StateNet's database of state legislation to identify bills proposed between January 1 and November 30, 2025 that used several terms including "data center" and "large load." After removing bills that used those terms but addressed different issues, we categorized the remaining bills into topic areas (including tax incentives, ratepayer protection, zoning and siting, disclosure requirements, environmental protections, labor, water resources, clean energy, and research studies) as well as status (enacted, pending, rejected, and passed but vetoed). We supplemented this research with queries to ChatGPT and Gemini to help identify possible gaps in the StateNet review, double-checking links provided by those large language models to ensure the information provided was accurate.
Almost all state legislatures have now adjourned for the year. (Only six state legislatures remain in session in December.) Trends with respect to state legislative activity on data centers in the first 11 months of 2025 included the following.
Eight Key Data Center Trends From State Legislative Activity in 2025
1. One of the most common objectives of state bills related to data centers was to encourage those facilities to locate in a state.
- Roughly 50 bills were introduced in state legislatures offering data centers tax incentives or other benefits.
- Of the more than two dozen bills on data centers enacted by state legislatures, at least nine provided tax incentives or other inducements for siting decisions. Arkansas, Kansas, Kentucky and Minnesota, among other states, all extended or increased sales or use tax exemptions for data centers. Indiana and West Virginia, among others, established favorable zoning and fast-track permitting procedures to facilitate data center construction.
2. State legislatures are paying growing attention to the impact of data centers on power prices. Ratepayer protection and tariff rate issues were among the most popular topics for state legislation on data centers. More than 40 such bills were proposed and at least six such bills passed. Those included:
- Minnesota HF 16, which requires new large grid customers (including data centers), as a group, to cover all their grid costs;
- Texas SB 6, which requires the Texas Public Utility Commission "to support business development in this state while minimizing the potential for stranded infrastructure costs;" and
- New Jersey A5466 and California SB 57, both of which require the state PUC to study within one year the effect of data centers on electricity costs.
3. Many bills related to the environmental impacts of data centers were introduced in state legislatures, including approximately 30 bills related to water consumption. Only a few of these bills were enacted. Minnesota HF 16, for example, requires close attention to water use in permitting new data centers. Kansas SB 98 makes tax credits for data centers contingent on practices that will "conserve, reuse and replace water."
4. Approximately 40 bills were introduced requiring data centers to disclose their energy use and/or environmental impacts to state authorities, with roughly a dozen bills requiring disclosure to the public. Details regarding metrics and anonymization of reports varied widely. At least three of these disclosure-related bills were enacted, including the following.
- Texas SB 6 requires interconnection applicants to disclose whether they are pursuing other interconnection applications in the state as well as information on onsite back-up generating facilities.
- Minnesota HF 16 requires data centers to disclose information on water consumption volumes.
- Iowa HB 976 requires data centers to submit an annual report to the Department of Revenue detailing the amount of backup power generation fuel and electricity purchased.
5. Several states passed bills limiting tax benefits for data centers.
Iowa limited sales tax exemptions for new data centers to 10 or 15 years (depending on their size), and Florida raised the minimum size for data centers receiving sales tax exemptions from 15 megawatts (MW) to 100 MW.
6. Texas became the first state in the nation to pass a bill requiring data center operators to enable remote disconnections for use during grid emergencies (referred to as a "kill switch provision").
7. There is little consistency in the legislative text of state bills on data centers.
- Definitions of data centers, thresholds for incentives, and regulations related to disclosure, zoning, siting, environmental impact mitigation and ratepayer protection vary significantly.
- This may be the expected product of variance among state-level policy regimes, and suggests the absence of close coordination among state legislatures or stakeholder groups.
8. The pattern of proposed and enacted bills displayed some partisan patterns.
Almost all the enacted bills encouraging data centers to locate in a state were passed by Republican legislatures. More bills addressing environmental risks from data centers were proposed in Democratic legislatures than Republican legislatures. However bills concerning the impacts of data centers on other ratepayers were enacted in states with Democratic legislatures and governors (including California, New Jersey and Oregon), Republican legislatures and governors (including Texas and Utah) and in which the legislature is controlled by one party and the governor another (including Kansas).
Data centers will be a hot topic as many state legislatures reconvene in January. The Executive Order on state AI laws released by the White House December 11 2025 does not seek to preempt state laws related to data centers (see in particular Section 8b), however questions related to the optimal role of state governments and the federal government on AI and data centers will likely be prominent as well.