



Research, Analysis, & Point of View
Original insights from the Relae team on the forces reshaping power systems, GHG emissions, environmental markets, nature, and the capital and policies behind them.
In-Depth Research

Criteria for High-Quality Carbon Dioxide Removal
Criteria for High-Quality Low Carbon Fuels
Carbon Capture for Gas-Fired Power Generation
Blogs
Data Centers Need a New Approach to Community Benefits
Key Takeaways
- Community Benefits Agreements (CBAs) have existed for two decades, and the data center buildout is exposing where the legacy model breaks.
- Across 46 cancelled or stalled US data center projects that Relae analyzed, late-stage benefits packages may be insufficient to change outcomes. Process, transparency, and proof of delivery did.
- The next generation of CBAs, especially for data centers, needs to be meaningful in scope and community voice, measurable in delivery and outcomes, and durable across political and generational divides.
Communities Are Rejecting the Legacy Benefits Model
In a white paper published earlier this year, Relae documented 46 US data center projects that were cancelled, stalled, or withdrawn between January 2024 and May 2026. Together, these projects represent more than US$170 billion in announced investment associated with projects canceled, stalled, or withdrawn following community opposition. Developers led with projects that included reactive communications and limited benefits packages negotiated under the pressure of rapid development timelines and local permitting and approval processes.
[stat]
Across these cases, local communities expressed concerns ranging from environmental and natural resource concerns to electricity rate impacts, to the lack of transparency and accountable development approaches. Even more importantly, communities do not clearly see how AI-driven data center development directly benefits them and advances their priorities and local social and economic goals.
The legacy community benefits models that data center developers are deploying were designed for a different kind of project, in a different political context. The public and local communities are demanding a new model to meet the current moment.
What Is a Community Benefits Agreement? A Brief History of CBAs
Community Benefits Agreements, or CBAs, have been a feature of US infrastructure development for twenty years. The foundational practitioner manual was published by Julian Gross, Greg LeRoy, and Madeline Janis-Aparicio in 2005, and the Partnership for Working Families coalition has carried the practice forward since.
The frame has expanded. Just Transition principles from labor and climate justice coalitions, the former federal Justice40 Initiative, and contemporary CBA templates from civil rights organizations like the NAACP have pushed the field toward binding equity commitments, durable community ownership stakes, and, where Indigenous or culturally significant sites are implicated, free prior and informed consent. These frameworks moved the field forward.
Relae examined CBAs across 40 US climate and clean energy projects in our prior white paper, Codifying Community Benefits in US Climate and Clean Energy Projects. Our analysis found that developers now routinely integrate multiple benefit types, including fiscal, workforce, infrastructure, environmental, and procedural commitments. CBAs for climate and clean energy projects have evolved, and this has brought many improvements, even though imperfections remain. The absence of a shared standard for defining and monitoring those benefits can leave outcomes uneven and often inequitable across host communities. Some efforts attempted to create a unified structure. For example, the Department of Energy had a Community Benefits Plan requirement on every Bipartisan Infrastructure Law and Inflation Reduction Act application, weighted at twenty percent of technical review.
Even still, these models were subject to political whims and did not advance localized and community-driven benefits. The gap now is in the timing, verification, and enforcement layer that turns those commitments into outcomes.
Community Data Center Opposition Is Breaking the Old CBA Model
Data center capital is arriving faster than any wave of large-load infrastructure since the shale gas boom. BCG estimates hyperscalers will spend US$1.8 trillion on data center-related capex in the US between 2024 and 2030. According to Dell'Oro Group, the four largest US cloud providers (Amazon, Microsoft, Google, and Meta) spent over US$340 billion in 2025 alone, with Amazon leading at $125 billion. Communities are responding faster, too. According to both Data Center Watch and Relae's own Data Center Cancellations Tracker, the opposition wave documented is mobilizing in weeks, not months.
Data center opposition in the US is bipartisan. It spans red and blue counties, every region, and multiple grid operators, with nearly two-thirds of the blocked investment sitting in counties that voted for Donald Trump in 2024.
By the time a developer reaches a public hearing with strong local community organization, the path of the project is largely set. Late-stage benefits packages that are offered as contractual agreements to side-step community concerns are proving to be ineffective. Communities read them as concessions, not commitments. Good Jobs First has now turned that critique on the data center sector, warning that hyperscale developers risk using the CBA label to whitewash bad deals.
What Makes a Community Benefits Agreement Actually Work?
The next generation of community benefits needs to pass three tests: meaningful, measurable, and durable.
1. Meaningful. Benefits should be calibrated to the host community's burden and vulnerability profile and be developed in collaboration with local community leaders and community-based organizations. Developers should draw on best-in-class methods in environmental justice analyses to help develop strong and responsible community engagement plans to involve residents and impacted communities in data center design decisions. Communities most exposed to siting harm must be at the table on equal footing with adjacent jurisdictions.
2. Measurable. For developers to be accountable to local communities, benefits frameworks need to include metrics for tracking and verifying both investment and outcomes. SMART (specific, measurable, attainable, relevant, and time-bound) milestones, independent monitoring, and secured financial obligations should be the default, not the exception. Historically, DOE's Community Benefits Plan requirements provided an example of incorporating measurable community commitments into federal funding applications. Although these federal requirements have since been rescinded, their emphasis on specific milestones and accountability offers lessons for voluntary community benefits frameworks and have set a usable floor, with at least one specific, measurable, achievable, realistic, and time-bound milestone per budget period. RMI's analysis shows how that floor translates to project-level design. The same logic applies to data centers. If a commitment cannot be measured by the community, it is not a commitment.
3. Durable. Benefits have to survive political winds and local electoral politics. Any benefits that a developer delivers should also be intergenerational in scale, or at least be scaled to the planned lifecycle operations of the data center itself. A CBA built only on conversations negotiated in a closed room will not hold. Durable benefits are written with enforcement mechanisms, conditional triggers, and modification rights that the community can exercise. The strongest form of durability is community ownership, in the shape of revenue share, community trust structures, or potential co-ownership of infrastructure or assets like battery storage or renewable energy generation. Microsoft's Community-First AI Infrastructure framework is a useful industry signal, but voluntary frameworks do not substitute for instruments the community can enforce.
Where Developers and Capital Partners Go From Here
The cancellation surge is a structural feature of the current data center siting environment. The patterns are legible enough to act on now. Three moves matter most.
1. Engage early, and well before site selection. Genuine engagement means naming the end user on the application, opening pre-application discussions to the public, and treating disclosure as a siting strategy rather than a legal afterthought.
2. Calibrate benefits to the host community, not to a template. Pre-siting analysis of demographic, environmental, and infrastructure indicators tells a developer whether drinking-water investment, energy burden protection, noise mitigation, or air-quality remediation will land as a real benefit for that community. Likewise, community involvement and voice in benefits design are equally important to shape calibrated and meaningful benefits. The same investment delivers very different value across communities.
3. Build verification into the instrument from day one. SMART milestones, independent monitoring, secured financial obligations, and modification rights the community can exercise belong in the agreement at signing, not bolted on later. Capital partners should expect to see these structures in their own diligence. A commitment without measurement is a promise, and communities are no longer accepting promises.
The Next Generation of Community Benefits Is Being Written Now
The next generation of community benefits is being designed right now, across municipal halls, civic coalitions, capital diligence checklists, and developer playbooks. The frameworks that will work are the ones that pass three tests: meaningful in scope and community voice, measurable in delivery and outcomes, and durable across political and generational divides.
Relae's Responsible Development team works with developers, capital partners, and host communities to build these frameworks from the ground up. Pre-siting community intelligence, burden-calibrated benefits design, and the verification scaffolding that converts commitments into outcomes.
The shift from reactive to proactive community engagement puts the focus on whether developers are willing to advance the capital to develop meaningful, measurable, and durable community benefits.
[cta]
Frequently Asked Questions
Why do data centers need community benefits agreements?
Communities opposing data center projects cite concerns ranging from environmental and rate impacts to a lack of transparency, and often don’t see how the project benefits them directly. Across 46 cancelled or stalled US data center projects Relae analyzed, representing more than US$170 billion in blocked investment, late-stage benefits offered under pressure didn’t change outcomes. A community benefits agreement lets developers deliver benefits proactively and make them verifiable, rather than reactively once opposition has organized.
What’s the difference between a legacy community benefits agreement and a next-generation one?
Legacy CBAs were often negotiated with specific legal and formal entities like County Commissions or City Councils and had narrow focuses on workforce or economic development. Oftentimes, these tools were offered as concessions through negotiation, rather than commitments, which is why communities are rejecting them. A next-generation community benefits agreement is meaningful, measurable, and durable from the start, with benefits calibrated to the host community rather than bolted on later.
Who should be involved in negotiating a community benefits agreement for a data center?
Benefits should be developed with local community leaders and community-based organizations, with the most affected communities at the table on equal footing with adjacent jurisdictions. Developers, capital partners, and host communities all have a role in building the SMART milestones and independent monitoring that turn those commitments into outcomes.
Low-Carbon Fuel Certification: How Market Rules Shape the Value of a Fuel
Key Takeaways
- The revenue stack for a given fuel is set by the rules that govern the market for low-carbon fuels: regulations, certification schemes, certificate registries, and corporate accounting frameworks.
- Regulators and buyers reward characteristics beyond regulatory eligibility and carbon intensity, such as reportability, broader sustainability, and advanced technology.
- Relae helps producers with commercial strategy relating to feedstock, production pathway, and certification, which impact access to markets.
The Route to Market Is a Strategic Choice
Low-carbon fuels (LCFs), such as sustainable aviation fuel (SAF) and renewable natural gas (RNG), will cost more to make than their fossil equivalents for the foreseeable future. Projects narrow that gap through some combination of regulatory-market value, sales of environmental attribute certificates (EACs) to voluntary buyers, and financial incentives such as the 45Z Clean Fuel Production Credit.
Regulatory programs are pulling investment into new facilities and novel production routes, and voluntary reporting frameworks are moving toward allowing companies to count fuel certificates in their emissions inventories. What the revenue stack for a given fuel looks like is set by the rules that govern the market for LCFs: regulations, certification schemes, certificate registries, and corporate accounting frameworks.
In voluntary markets, the certification scheme, certificate registry, and reporting framework determine the official carbon intensity (CI) of the fuel, the number of certificates generated, and how buyers can use them to make claims.
In regulatory programs across Europe and North America, the rules determine how the fuel is classified, and whether its feedstock receives premium value, is capped, or is excluded altogether. Producers who understand how their market entry decisions impact value will be better positioned now and going forward.
What Is Carbon Intensity?
A fuel’s CI measures the life cycle greenhouse gas emissions per unit of fuel, usually expressed in grams of carbon dioxide-equivalent per megajoule (gCO2e/MJ). It covers feedstock production, conversion, transport, and use. Each program defines its own methodology for calculating it, which is why the same batch of fuel can carry a different CI depending on which program’s rules apply.
EACs Carry a Fuel’s Value to Market
An LCF EAC records characteristics of a batch of fuel separately from the fuel itself, such as whether it qualifies for a given program, the CI, or its feedstock. The certificate can travel with the fuel (bundled) or be sold on its own (unbundled):
Bundled EACs
In most regulatory markets, an obligated party purchases the fuel and its certificate together. These buyers are mainly fuel suppliers, as under the California Low Carbon Fuel Standard (LCFS), and airlines, as under the EU Emissions Trading System and the Carbon Offsetting and Reduction Scheme for International Aviation (CORSIA). They need both the physical fuel and the EAC that proves the fuel is eligible.
Unbundled EACs (Book-and-Claim)
Often in the voluntary market, the fuel is consumed wherever it can be delivered. The EAC is sold separately to whoever wants to claim its attributes, a system called book-and-claim. This matters because most companies have no control over the fuel burned in their supply chains: a company that ships freight cannot choose the fuel its carriers use, but it can buy EACs with a certified CI and claim the associated emissions reduction.
In both markets, the characteristics the EAC carries determine the regulatory and voluntary value in a fuel’s revenue stack.
Three Layers of Rules Determine the Value of an EAC
An LCF producer chooses the feedstock, production pathway, and markets to sell into. How those choices translate to the value of a fuel’s EAC is determined by three layers of rules that govern the LCF market (Table 1).
Table 1. The three layers of rules that set an LCF EAC’s value. Examples are illustrative and not exhaustive. ISCC = International Sustainability and Carbon Certification; RSB = Roundtable on Sustainable Biomaterials; SAFc = sustainable aviation fuel certificate; RED III = Renewable Energy Directive; GHG = greenhouse gas; SABA = Sustainable Aviation Buyers Alliance. Source: Relae.
Where the Rules Disagree: Three Feedstock and Pathway Examples
The result is that the same batch of fuel can carry a different CI, or a different classification, depending on which rules it is subject to. Three examples below demonstrate how production pathway decisions can impact a fuel’s value:
- Manure-based RNG ⇨ avoided emissions. The three layers treat avoided emissions differently. At the regulatory program and voluntary standard layer, ISCC PLUS follows the EU Renewable Energy Directive (RED III) in crediting methane emissions avoided through improved manure management, but CORSIA does not. At the registry and accounting layer, the Greenhouse Gas (GHG) Protocol’s draft Action and Market Instruments (AMI) Standard and the AIM Platform have proposed separating avoided emissions from a fuel’s direct life cycle emissions and reporting the two on different statements, and whether negative CI values from avoided emissions are accepted at all depends on the registry where the EACs are listed.
- Crop-based feedstocks ⇨ indirect land use change (iLUC). Regulators don’t agree on how to incorporate iLUC, either. Under the LCFS, modeled iLUC emissions for all crop-based fuels are positive. Under CORSIA, they can be positive or negative. Under RED III, iLUC is excluded from the CI, though separate rules restrict feedstocks deemed high-risk for iLUC. And because modeling and assumptions keep evolving, iLUC values are also subject to change over time.
- Synthetic fuel ⇨ e-SAF mandates. Regulatory programs also differ on what counts as a given category of fuel. ReFuelEU Aviation and the UK SAF Mandate both reserve a share of their mandates for e-SAF, but define it differently. The EU requires the fuel to qualify as a renewable fuel of non-biological origin (RFNBO). The UK sets its own power-to-liquid criteria, including which electricity sources it accepts. The same e-SAF can therefore count toward one sub-mandate and not the other.
Beyond Eligibility: EAC Characteristics the Market Rewards
In regulatory markets, an EAC’s value depends first on whether the fuel is eligible and how it is classified. In voluntary markets, value depends on the fuel’s CI and the number of certificates issued. Both regulators and voluntary buyers also reward characteristics beyond that baseline, and those characteristics can impact a fuel’s revenue stack:
- Voluntary reportability. The value of an EAC depends on how a buyer can report it, today and in the future. The GHG Protocol is still finalizing its rules for fuel certificates and what a buyer can claim. Certificates that fit cleanly within those rules may command a premium.
- Breadth of sustainability criteria. Some buyers screen EACs against criteria beyond emissions savings. The Sustainable Aviation Buyers Alliance (SABA) explicitly prefers advanced feedstocks and certification schemes with stronger social and environmental safeguards. Regulations set a minimum bar, but voluntary markets have no single standard for a high-quality EAC. The Relae Criteria for High-Quality Low Carbon Fuels consolidate these characteristics into one framework, and can show producers how their fuel and certification choices measure up against it.
- Advanced feedstocks and technologies. Fuel from novel pathways typically costs more than fuel from established ones, and some buyers are willing to pay that premium: early buyers want to support technologies that need offtake to reach commercial scale, and others want to diversify supply ahead of expected constraints on hydroprocessed esters and fatty acids (HEFA) SAF.¹ Regulators reward the same pathways directly through e-SAF sub-mandates and financial incentives, such as the UK Revenue Certainty Mechanism.
Where Should Producers Start?
How each program treats a feedstock, how each methodology calculates CI, and what each set of buyers will pay for are inputs to the feedstock, production pathway, and offtake decisions themselves. Once those decisions are made and contracts are signed, the route to market is largely fixed. Producers should weigh the routes open to them against three questions before committing:
- How will my feedstock, production pathway, and certification affect access to markets?
- How do I position my product within overlapping voluntary and regulatory markets?
- Who are my buyers and what do they require or prefer?
A sound strategy must consider the complex interactions between voluntary and regulatory markets, certification schemes and registries, and buyer preferences.
The landscape continues to evolve, with new national certification programs and regulations for LCFs emerging across the globe and accounting frameworks shifting. The policy experts, scientists, engineers, and economists at Relae help producers understand how each certification route affects the value of their fuel in the markets they want to enter, choose feedstocks and pathways with that in mind, and make sure the claims behind their EACs are high-quality and hold up to buyer and registry scrutiny as the rules evolve.
Frequently Asked Questions
What is the difference between a bundled and an unbundled EAC?
A bundled EAC is sold with the physical fuel, usually to an obligated party under a regulatory program such as the LCFS or ReFuelEU Aviation. An unbundled EAC is sold separately from the fuel through book-and-claim, so a buyer can claim its attributes without taking delivery of or consuming the fuel.
What is the difference between a regulation, a certification scheme, a registry, and a corporate accounting framework?
A regulation or voluntary standard sets the CI methodology and decides whether certain feedstocks are rewarded, capped, or excluded. A certification scheme verifies that a batch of fuel meets that methodology. A registry issues and tracks the certificates and can apply additional rules on CI, while corporate accounting frameworks determine what a voluntary buyer can claim.
Why can the same fuel have more than one carbon intensity?
Each regulatory program and voluntary standard sets its own CI methodology, and registries can add rules of their own. Manure-based RNG is one example: RED III and ISCC PLUS credit avoided methane emissions, CORSIA does not, and some registries cap CI at zero. The same batch can therefore carry different CIs depending on where it is certified and what market it is sold into.
How does carbon intensity affect LCFS credits?
Under the LCFS, the number of credits a fuel generates depends on how far its certified CI falls below the program’s fossil fuel benchmark for that year. Credit price is set by the market, so a lower CI increases the credits a producer has to sell, and the program’s rules decide the CI of the fuel.
Battery Storage Economics: Do the Numbers Still Pencil in Today’s Market?
Key Takeaways
- Batteries have competed away the revenue that financed their first wave. In Texas, ancillary prices have fallen about 90% since 2023, and price spikes driving arbitrage revenue are becoming ever less frequent.
- The business has moved from trading energy to selling capacity. In Texas, tolls work as private capacity contracts, and resource adequacy payments make up roughly 70% of battery revenue in California. Project economics increasingly pencil on a fixed $/kW-month basis rather than price spikes.
- Long-term contracts help shift the risk, but they don’t fully close the gap. Under a 15-year toll, a new battery needs about 22% less revenue, but that is still nearly three times what Texas batteries earned in the market in 2025.
- Buildout now depends on who will pay for capacity. Merchant revenue alone no longer covers a new battery, so growth hinges on how many buyers will sign capacity contracts worth nearly three times what Texas batteries earn in the market.
Battery Revenues Are Falling While Deployments Keep Rising
US developers are expected to install about 24 GW of utility-scale battery storage energy systems (BESS) in 2026, about 60% more than the record 15 GW added in 2025, according to the EIA. Yet in Texas, where batteries earn most of their money in the market, a typical battery earned roughly 85% less in 2025 than in 2023.
Is this unjustified overbuilding by an industry that has grown too fast? Some battery executives argue this is not overbuilding, because merchant revenue earned in wholesale markets is no longer the business. In their view, falling merchant revenue matters less because longer-term offtake contracts, such as 15-year tolls with utilities and large power buyers, make lower revenue financeable. As a result, today’s installations bank on batteries being paid as capacity assets rather than as pure energy arbitrageurs.
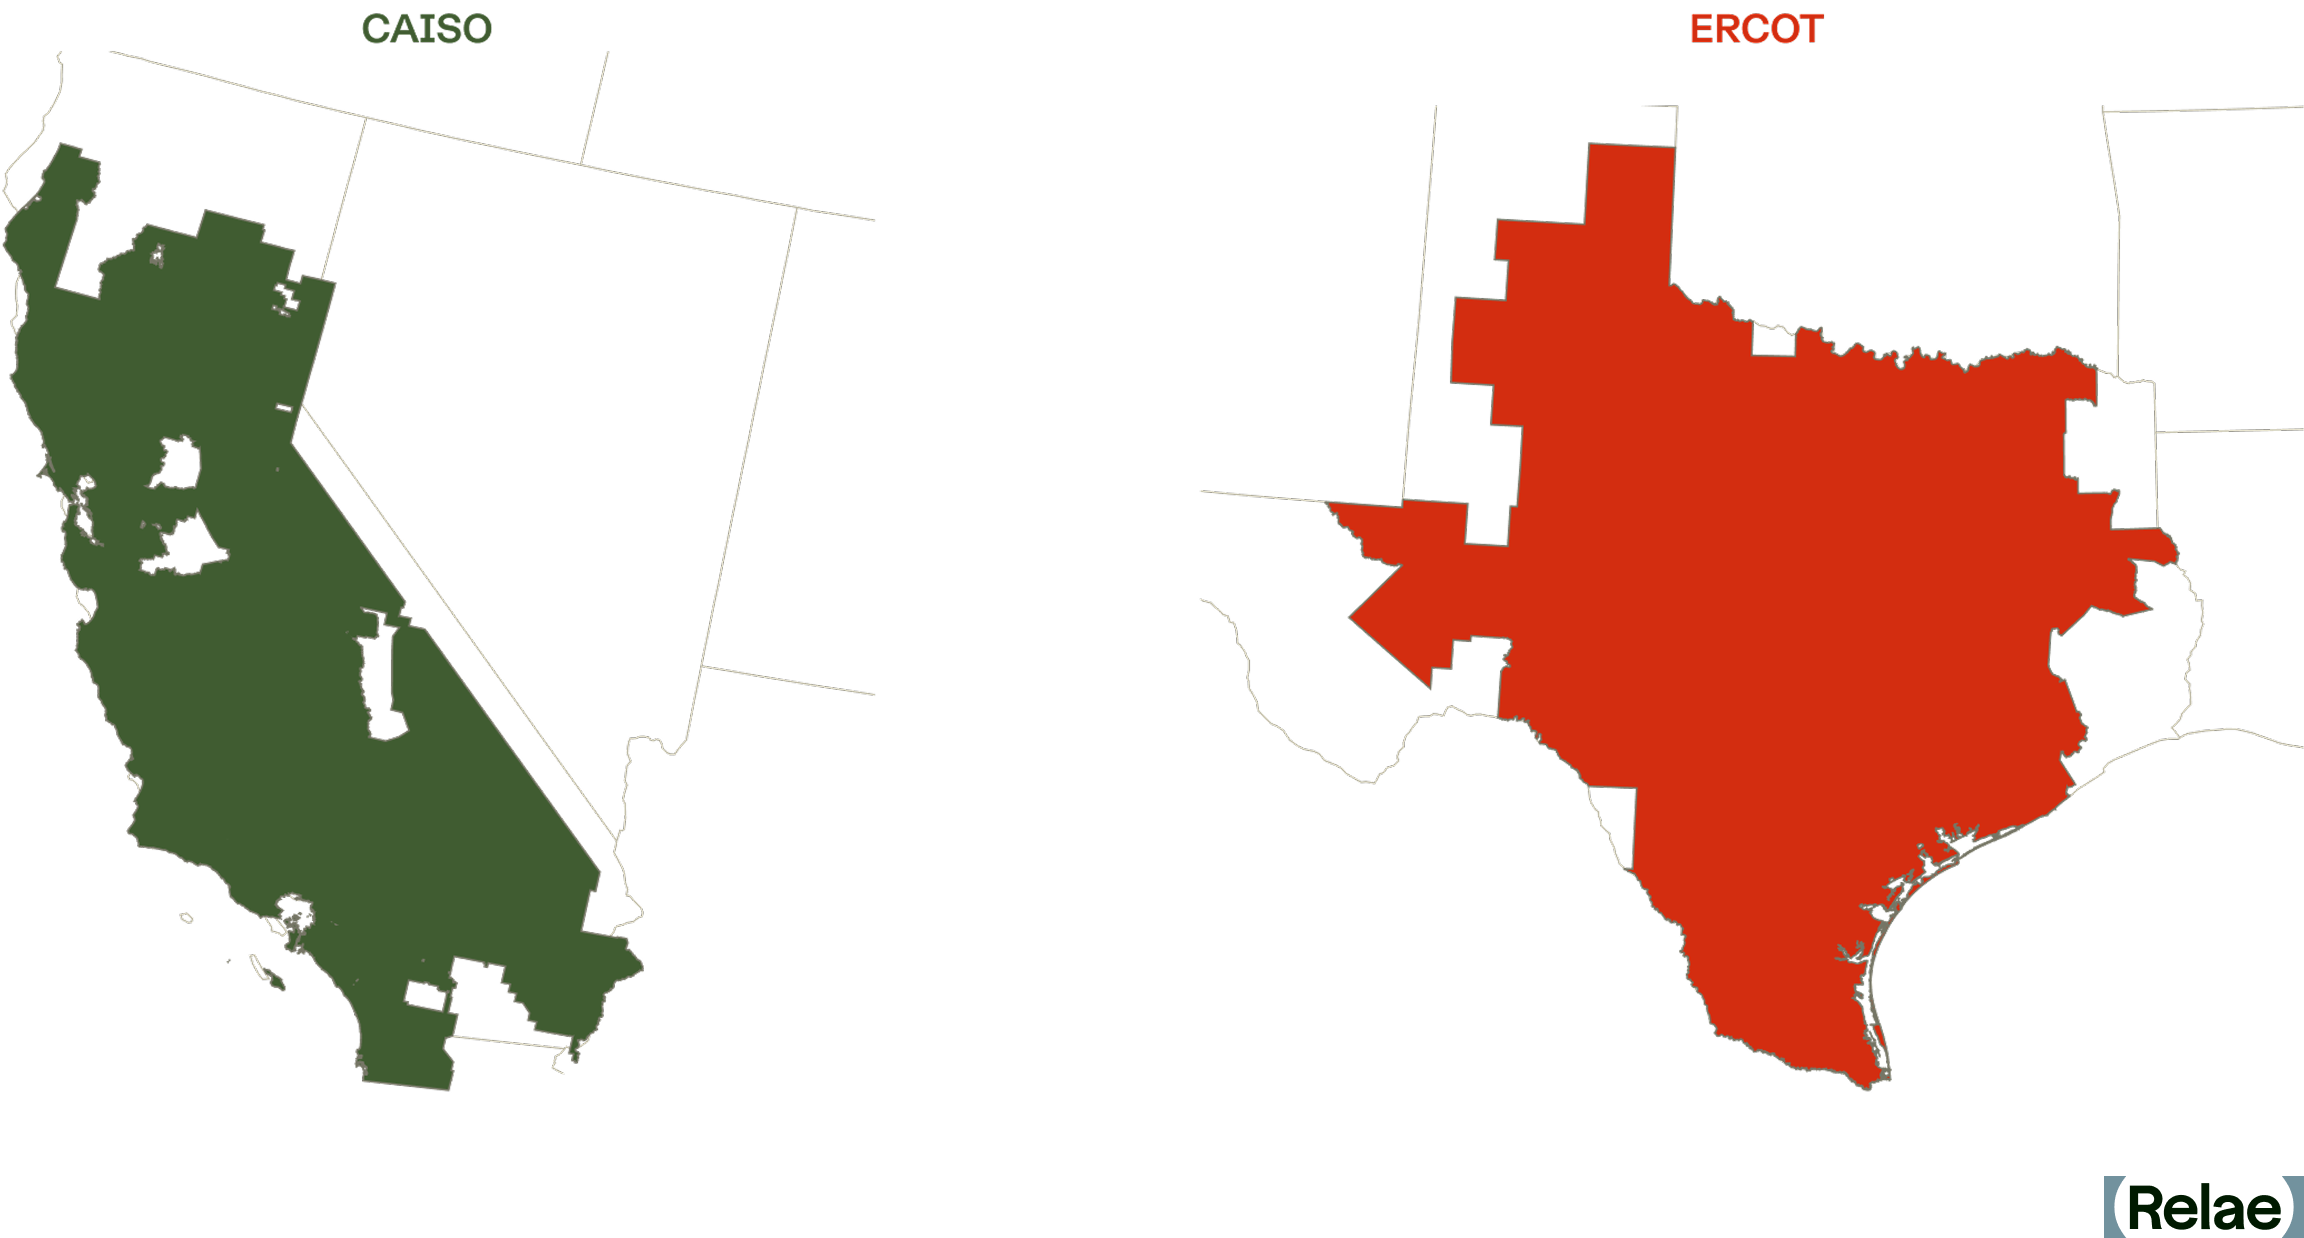
We tested those claims against market data from Texas (ERCOT) and California (CAISO) between 2022 and 2026. Our core finding is that project economics in both markets are increasingly reliant on fixed $/kW-month earnings rather than arbitrage revenue.
How Does a Grid Battery Make Money?
A battery has three ways to earn:
- Energy arbitrage (merchant: paid per MWh traded, hour-by-hour): charging when power is cheap and discharging when it is expensive. Its value depends on the daily spread between the highest- and lowest- priced hours.
- Ancillary services (merchant: paid per MW held in reserve, bought a day ahead): payments for standing ready to keep the grid stable, such as frequency regulation and reserves, whether or not the battery is called on to deliver energy.
- Capacity contracts (contracted: fixed $/kW-month for many years): a utility or large buyer pays a fixed monthly fee, often called a toll, for the right to use the battery, and takes on the market risk itself. It is the most stable of the three.
Texas batteries earned almost entirely from the first two. California batteries have earned from all three, and as market revenue has fallen, resource adequacy (RA) contracts–the mechanism through which load-serving entities meet the state’s capacity requirements–have become their main source of income.
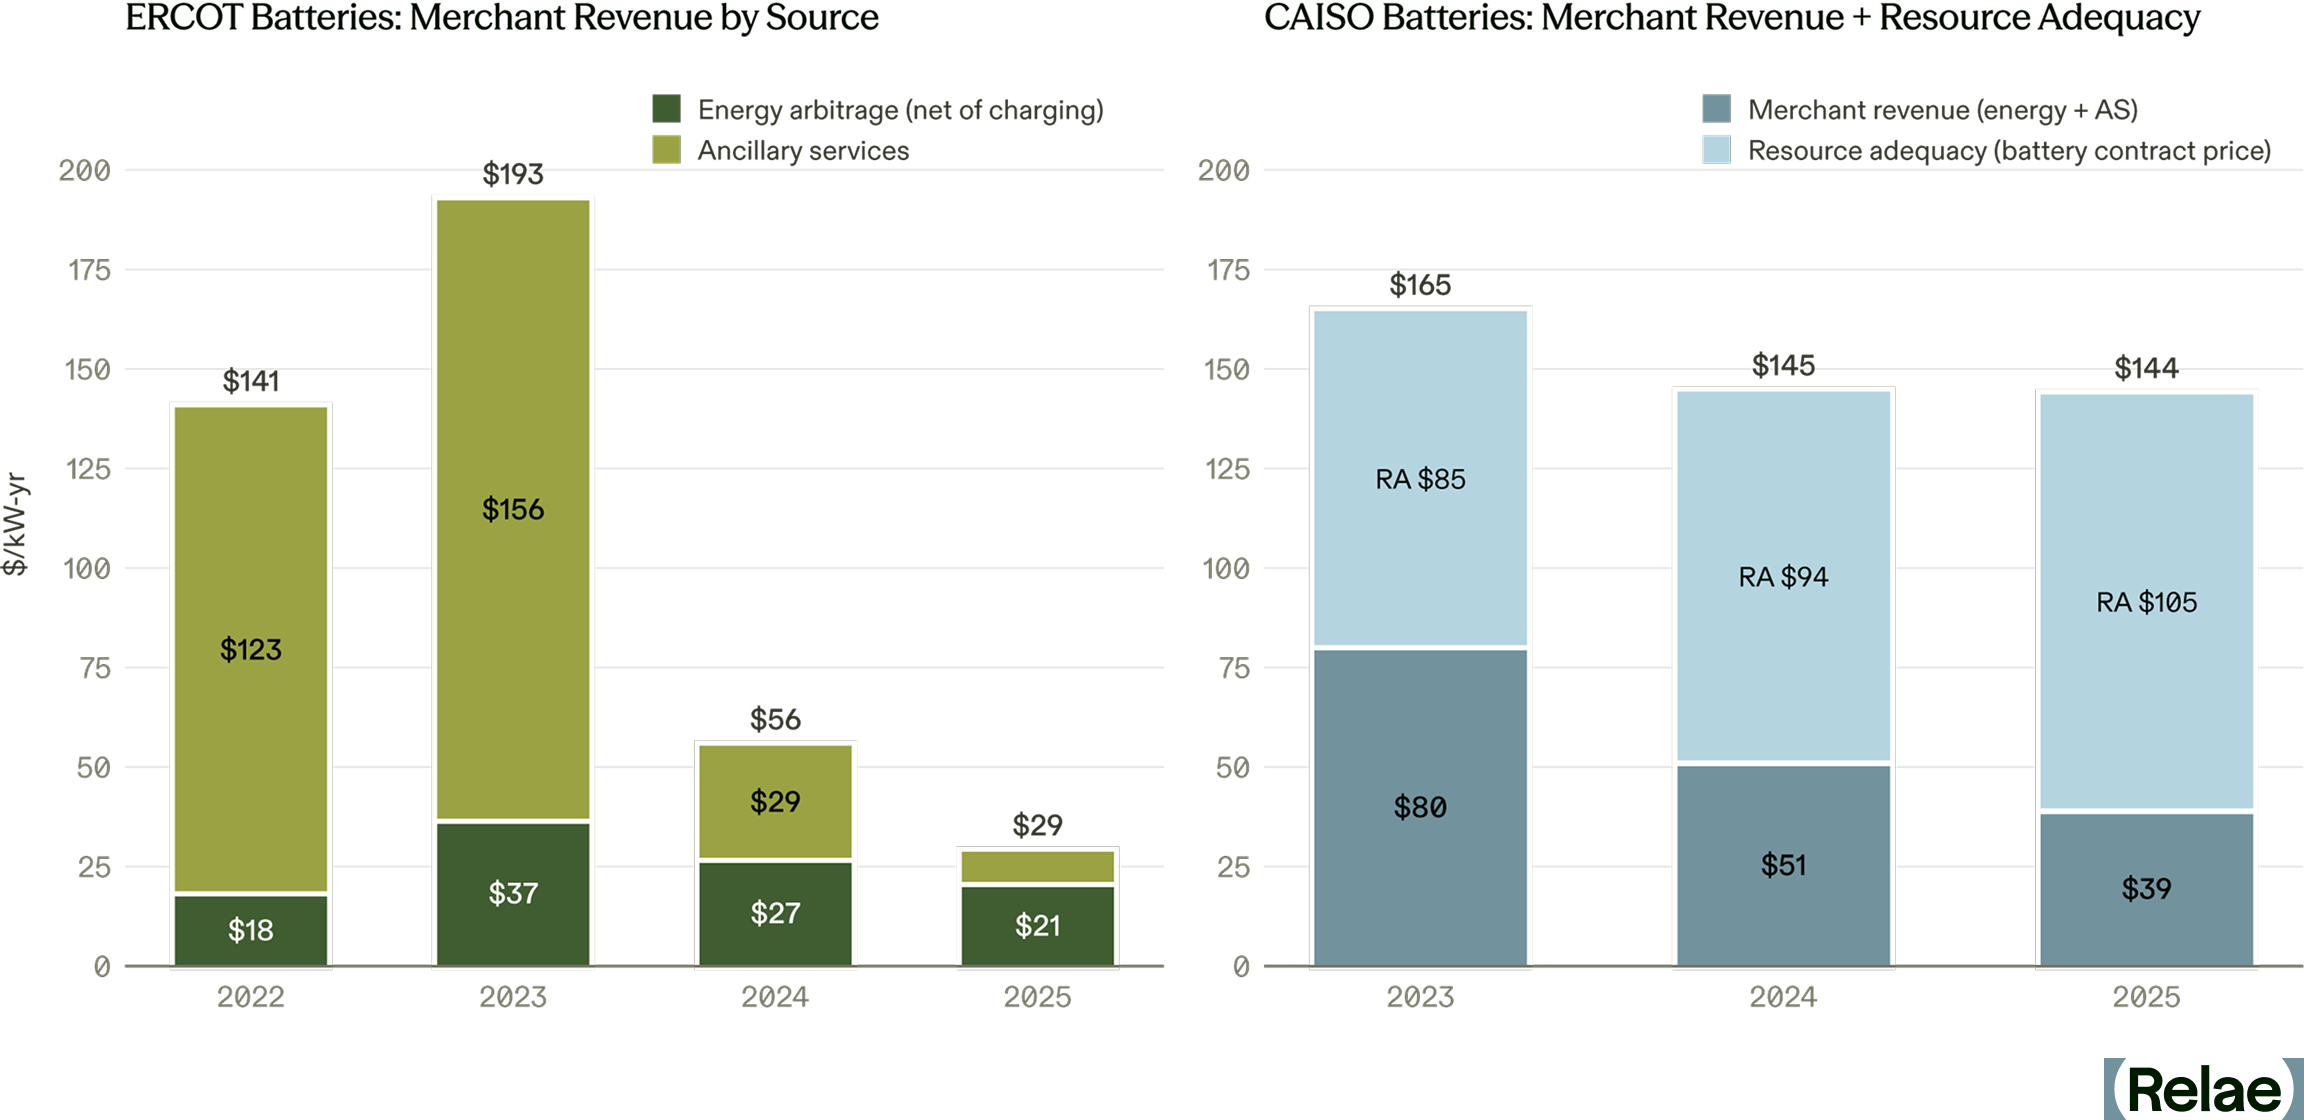
That additional revenue stream is crucial in CAISO, making up roughly 70% of battery revenue by 2025, as net market revenue declined from $103/kW-year in 2022 to under $40/kW-year in 2025. Outcomes differ, too: California still curtails large amounts of midday solar despite its growing battery fleet, while ERCOT’s batteries have flattened price peaks.
How Texas Batteries Lost Their Merchant Revenue
Ancillary services filled up first. In 2022-23, ancillary services supplied more than 80% of Texas batteries’ revenue. But these markets are small and fixed in size. ERCOT buys about 3 GW of the fast reserves batteries excel at, and 6–8 GW of ancillary services in total.
The battery fleet passed the first mark in mid-2023 and the second in spring 2024; it is now about 19 GW of registered capacity. Average ancillary services prices fell 85-95% between 2023 and 2025, and ERCOT's day-ahead ancillary services spending fell from about $1.5 billion to $174 million. California’s ancillary markets saturated even earlier: batteries already won about 70% of its regulation-up procurement in 2022, and about 90% since 2024. Its ancillary services spending, much smaller than ERCOT’s to begin with, fell by about 60%, from $237 million in 2022 to $95 million in 2025.
Price spikes disappeared, too. ERCOT's average daily spread between its four highest- and four lowest-priced hours fell from $163/MWh in 2023 to $48/MWh in 2025, even as natural gas prices rose. Yet the typical day, adjusted for gas prices, looks much as it did in 2022. What vanished is scarcity: hours when real-time prices topped $1,000/MWh fell from about 60 in 2023 to 2 in 2025.
Batteries discharge into exactly those hours, and there are now enough of them to flatten the peaks. Controlling for gas prices, renewables, and demand, each additional gigawatt of batteries is associated with a 9% narrower daily spread.
Merchant revenue collapsed. Texas batteries earned about $193 per kW-year in 2023 and only about $29 in 2025, according to Modo Energy’s fleet index. California batteries’ market revenue fell from about $80 to under $40 per kW-year, before resource adequacy payments. Merchant revenue alone is no longer enough to finance a new battery in either market.
Costs fell too, but not by as much: NLR’s benchmark installed cost for a four-hour system fell about a third from its 2022 peak to 2024, from roughly $517 to $334 per kWh in 2024 dollars. Costs then turned up again: Lazard’s levelized cost of storage rose in 2026, to near the top of its range since 2020, as tariffs cut access to cheaper Chinese cells and new foreign-entity-of-concern (FEOC) rules pushed buyers toward other suppliers.
The Battery Business Has Moved From Energy to Capacity
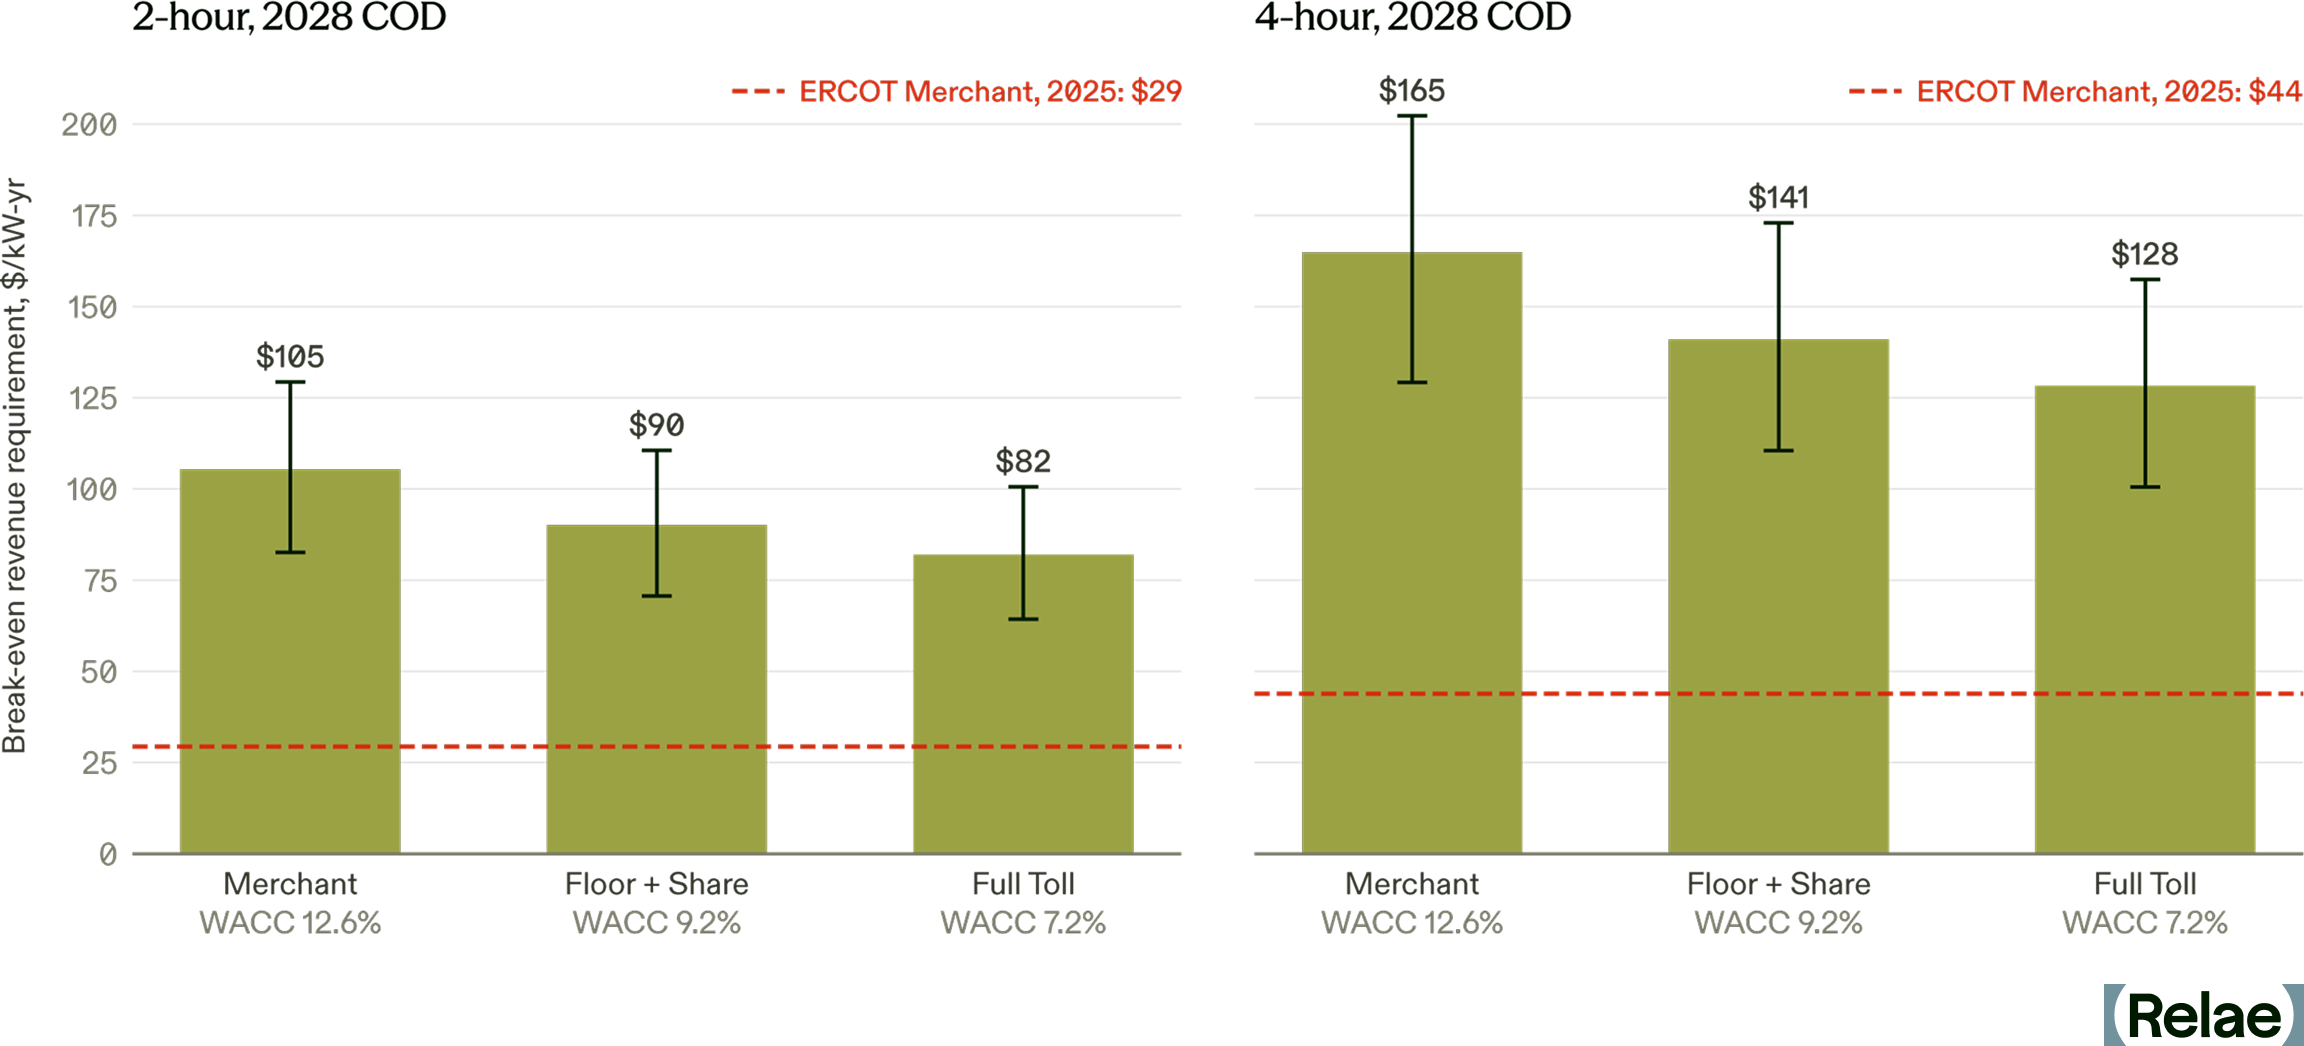
As merchant revenue declines, storage developers are increasingly turning to capacity contracts to support revenue requirements. This has an important advantage: contracted cash flow can carry more debt at a lower cost. Under illustrative financing assumptions, moving a battery coming online in 2028 from merchant to a 15-year toll lowers its cost of capital from about 12.6% to 7.2%.
Using NLR’s projected installed capital costs for 2028, that cuts the annual revenue a two-hour system needs to break even by about 22%, from $105 to $82 per kW-year ($64-101 across NLR’s low- and high- cost cases). However, that is still nearly three times what Texas batteries earned in the market in 2025. Given this gap, new BESS installations might appear to be uneconomic.
Why Are Developers Still Building BESS?
However, new BESS installations continue to be built. This is partly because many battery storage projects coming online now were financed on 2022-23 revenue (the average project can take over four years from entering the interconnection queue to operation), and partly because new contracts, such as tolls, are priced on capacity, not energy: the supplier is obligated to keep certain amounts of capacity available over a given time period, independent of energy delivery.
In Texas (which has no capacity market), such tolls are, in effect, private capacity contracts. In California, resource adequacy already plays that role: batteries’ RA contracts averaged about $9 per kW-month in early 2025.
An owner needs roughly $7 per kW-month for a two-hour battery (about $11 for four hours) to break even, in line with the roughly $7 per kW-month cap on a 20-year battery storage agreement Austin Energy approved in May 2026. By contrast, the energy and ancillary revenue an offtaker could capture by dispatching it is about $2.50–3.50 per kW-month. The difference is what buyers pay for firm capacity: insurance against scarcity events like Winter Storm Uri, capacity to meet their own load obligations, or a hedge against scarcity returning as demand grows.
The Next Battery Wave Depends on Who Pays for Reliability
Batteries have done what they were built to do: absorb volatility and steady the grid. In doing so, they competed away the revenue that financed the first wave. At today’s prices, merchant revenue no longer covers a new battery. The build continues on projects financed in 2022–23 and on capacity contracts worth nearly three times what Texas batteries earn in the market. Whether the buildout continues depends on how many buyers will pay that premium.
Deployment continues to grow in both markets. ERCOT registered about 4.2 GW of new batteries in January to July 2026, against 2.8 GW a year earlier. But the pace is slowing: Texas’s fleet grew about 50% in 2025 after nearly doubling in 2024, and interconnection queues are thinning: ERCOT battery applications fell by half in the second half of 2025.
Wholesale markets financed the first boom. The next wave depends on buyers who value reliability, including utilities, retailers, and large loads such as data centers, and on how cheaply that risk can be priced and capitalized. Data centers in particular put a high value on firm power: research inferring their willingness to pay from cloud computing prices puts it at up to $13,600 per MWh for frontier AI chips on guaranteed service, far above ERCOT’s $5,000 per MWh price cap.
For developers and investors, the question is no longer how much the market will pay, but who will sign, and for how long. For more on how interconnection queues shape how many storage projects get built and how queue wait times vary by technology, see Relae’s interconnection research.
Relae’s Power & Energy advisory team helps developers, investors, and large energy buyers understand and price the value of storage. This includes behind-the-meter modeling, resource portfolio optimization, and interconnection queue analysis.
Frequently Asked Questions
Why are battery storage revenues falling if deployment keeps growing?
Batteries have become victims of their own success. They earned most of their early revenue from two sources: ancillary services and high wholesale market prices. Texas now has more batteries than ancillary services the grid needs, so those prices have collapsed. And because batteries discharge during the most expensive hours, there are now enough of them to flatten the price spikes that used to pay the most.
What is a battery tolling agreement?
A toll is a long-term contract in which a utility or large buyer pays a battery owner a fixed monthly fee for the right to direct how the battery is used. The buyer keeps whatever the battery earns in the market and takes on the risk if that falls short. The owner gets a steady income it can borrow against.
Who is signing these contracts?
Mostly utilities, retailers and power traders, who need capacity to serve their customers or want protection against price spikes. In California, utilities sign capacity contracts with batteries to meet the state’s resource adequacy requirements. Large loads such as data centers place a high value on reliable power, but few have signed contracts with grid batteries so far; most of their battery deals are for on-site power.
Will battery storage buildout slow down?
Not yet. Texas is still adding more batteries each year, largely projects that were planned and financed when revenues were higher. But the pipeline behind them is thinning: new battery applications in ERCOT’s interconnection queue halved in the second half of 2025. Whether buildout holds up depends on how many buyers will pay for capacity at a premium to what the market pays today.
How Does Geothermal Compare to Other Clean Firm Power Options?
Key Takeaways
- Geothermal shares the clean firm category with only three other technologies: nuclear, natural gas with carbon capture and storage (CCS), and solar or wind paired with long-duration energy storage (LDES).
- Buyers comparing geothermal to solar or unabated natural gas power contracts are comparing different products: one isn’t firm, the other isn’t clean, and both remain cheaper options because they satisfy less of what buyers currently need.
- Geothermal’s cost premium is real, but so is the value it delivers. Geothermal can reach 90%+ capacity factor, delivering dispatchable clean power around the clock, and it sidesteps the gas turbine manufacturing backlogs and pipeline infrastructure delays slowing other firm power technologies.
- Geothermal is closer to commercial readiness than most buyers realize. As demand for firm, low-carbon power intensifies, geothermal warrants a serious look alongside nuclear and gas with CCS.
Geothermal is Gaining Traction Despite Its Cost Premium
Hyperscalers, corporate energy buyers, and data center developers face unprecedented pressure to procure clean power. Wind and solar have played a major role in meeting this need, but they are intermittent, and load growth is accelerating and changing. This market pressure is creating bottlenecks that cannot be solved without new grid infrastructure and/or substantial additions of energy storage. Geothermal, which does not suffer from intermittency, has gained tremendous momentum as a challenger to wind and solar, yet it carries one seemingly glaring disadvantage: its cost.
Yet, major utilities and hyperscalers alike are lining up for geothermal offtake anyway: Southern California Edison and Google have signed separate contracts with Fervo, and Meta has two 150 MW agreements in place with Sage and XGS. These contracts are signaling a growing shift in power markets: not all megawatt-hours are created equal, and the cheapest contracts may no longer contain what buyers truly need.
Fast, Clean Firm Power: What Buyers Need Today
In the clean firm power evolution, clean came first. Buyers signed solar and wind power purchase agreements (PPAs) and matched their annual consumption with renewable energy contracts, or offset them with renewable energy certificates (RECs). With lax carbon accounting, solar and wind remain unbeatable on price. But annual emissions tallies conceal something important—a buyer can procure as much renewable electricity as it consumes over a year while still depending on the rest of the grid during the hours when those resources are unavailable. To close that gap, buyers need a source that delivers clean power around the clock, firmly in every hour, on demand.
Two unforgiving demands have followed since: speed and location. With today’s rapid buildout of new load, a power source needs to come online in time to deliver power when the customer needs it. It is also important to connect near a customer’s location because existing transmission assets are often fully subscribed. Failure on either axis can disqualify a project. However, a contract that can meet all attributes: clean in every hour, firm on demand, quick to deliver, and able to reach the load, might be the best (or only) option available. It is also likely to be considerably more expensive than those annual solar benchmarks that only met the clean condition.
Four Technologies Make the Clean Firm Power Shortlist
Given this strict set of constraints, what power options should buyers consider? The right set of technologies should aim to solve as many of the aforementioned conditions as possible, and that leaves a fairly tight shortlist:
- Solar or Wind paired with Long-Duration Energy Storage (LDES): To achieve the level of reliability that many buyers, including data centers, require, solar or wind would have to be paired with LDES, beyond 4–8 hours, to be able to cover evening hours and remain online during increasingly common extreme weather events. While there are promising LDES technologies on the horizon, most remain expensive and not yet widely commercial. Costs rise significantly compared to a standard solar or wind PPA, and viability varies by location. This will be increasingly competitive as storage costs fall, but not yet a mature firm-power solution at scale.
- Natural Gas with CCS: With large amounts of unabated natural gas generation coming online, CCS is an attractive option to mitigate a large portion of these emissions while retaining time to power (by building gas first and adding CCS later) and the dispatchability of gas-fired power. On the flip side, CCS is operationally complex, geographically restricted, and - unlike other options here - failure at any point in the CCS chain directly impacts the carbon intensity of power delivered. Gas-fired generation is also reliant on the gas delivery pipeline infrastructure, which may face capacity constraints. Finally, natural gas with CCS is 50% more costly per MWh than unabated firm gas.
- Nuclear: Nuclear is seeing renewed interest from a wide range of corporate buyers and investors. Conventional nuclear and small modular reactors (SMRs) are attracting funding and offtake deals. While nuclear power holds high potential, long development timelines, high capital costs, and technology risk remain barriers to commercializing the next wave of nuclear technologies.
- Geothermal: Geothermal can provide firm, dispatchable, and low-carbon power with capacity factors typically above 90%. Development timelines can be faster than nuclear in regions where resources are already proven, with some projects approaching commercial readiness now. Geothermal technology is still geographically constrained, but enhanced geothermal systems (EGS) are poised to expand their geographical flexibility by reducing the number of siting variables.
How to Evaluate the Right Clean Firm Power Technology for Your Project
How do these various options stack up? We compared them across six dimensions:
- Firmness: how reliably a resource can deliver power on the hour, on demand
- Carbon: the lifecycle emissions intensity when considering the operational emissions of the generating facility and the broader system carbon impacts required to meet any reliability gaps
- Time to power: a measure of how long it takes to get from “we need power” to delivery, including interconnection and schedule risk
- Cost (current): the likely cost of a PPA if signed today
- Execution risk: a measure of how likely a project’s claims regarding price, timing, and performance will hold
- Siting flexibility: a measure of how constrained a resource is to a specific geography
This frame is ultimately something the buyer should score themselves; below you will find our current read. Red (unfavorable) represents a weakness that can end an evaluation on its own, green (favorable) means the dimension won’t constrain the decision, and yellow (moderate) sits somewhere in between.
Comparing the clean firm power options is, perhaps ironically, challenging along the “clean” and “firm” lines. Every serious contender delivers low-carbon power around the clock, because that is the price of admission. Not one technology earns an unfavorable rating in those categories. And that is the catch: every weakness in the comparison table sits somewhere else. The dimensions that ultimately win (or end) these contracts may be the ones that the “clean firm” label can obscure or oversimplify.
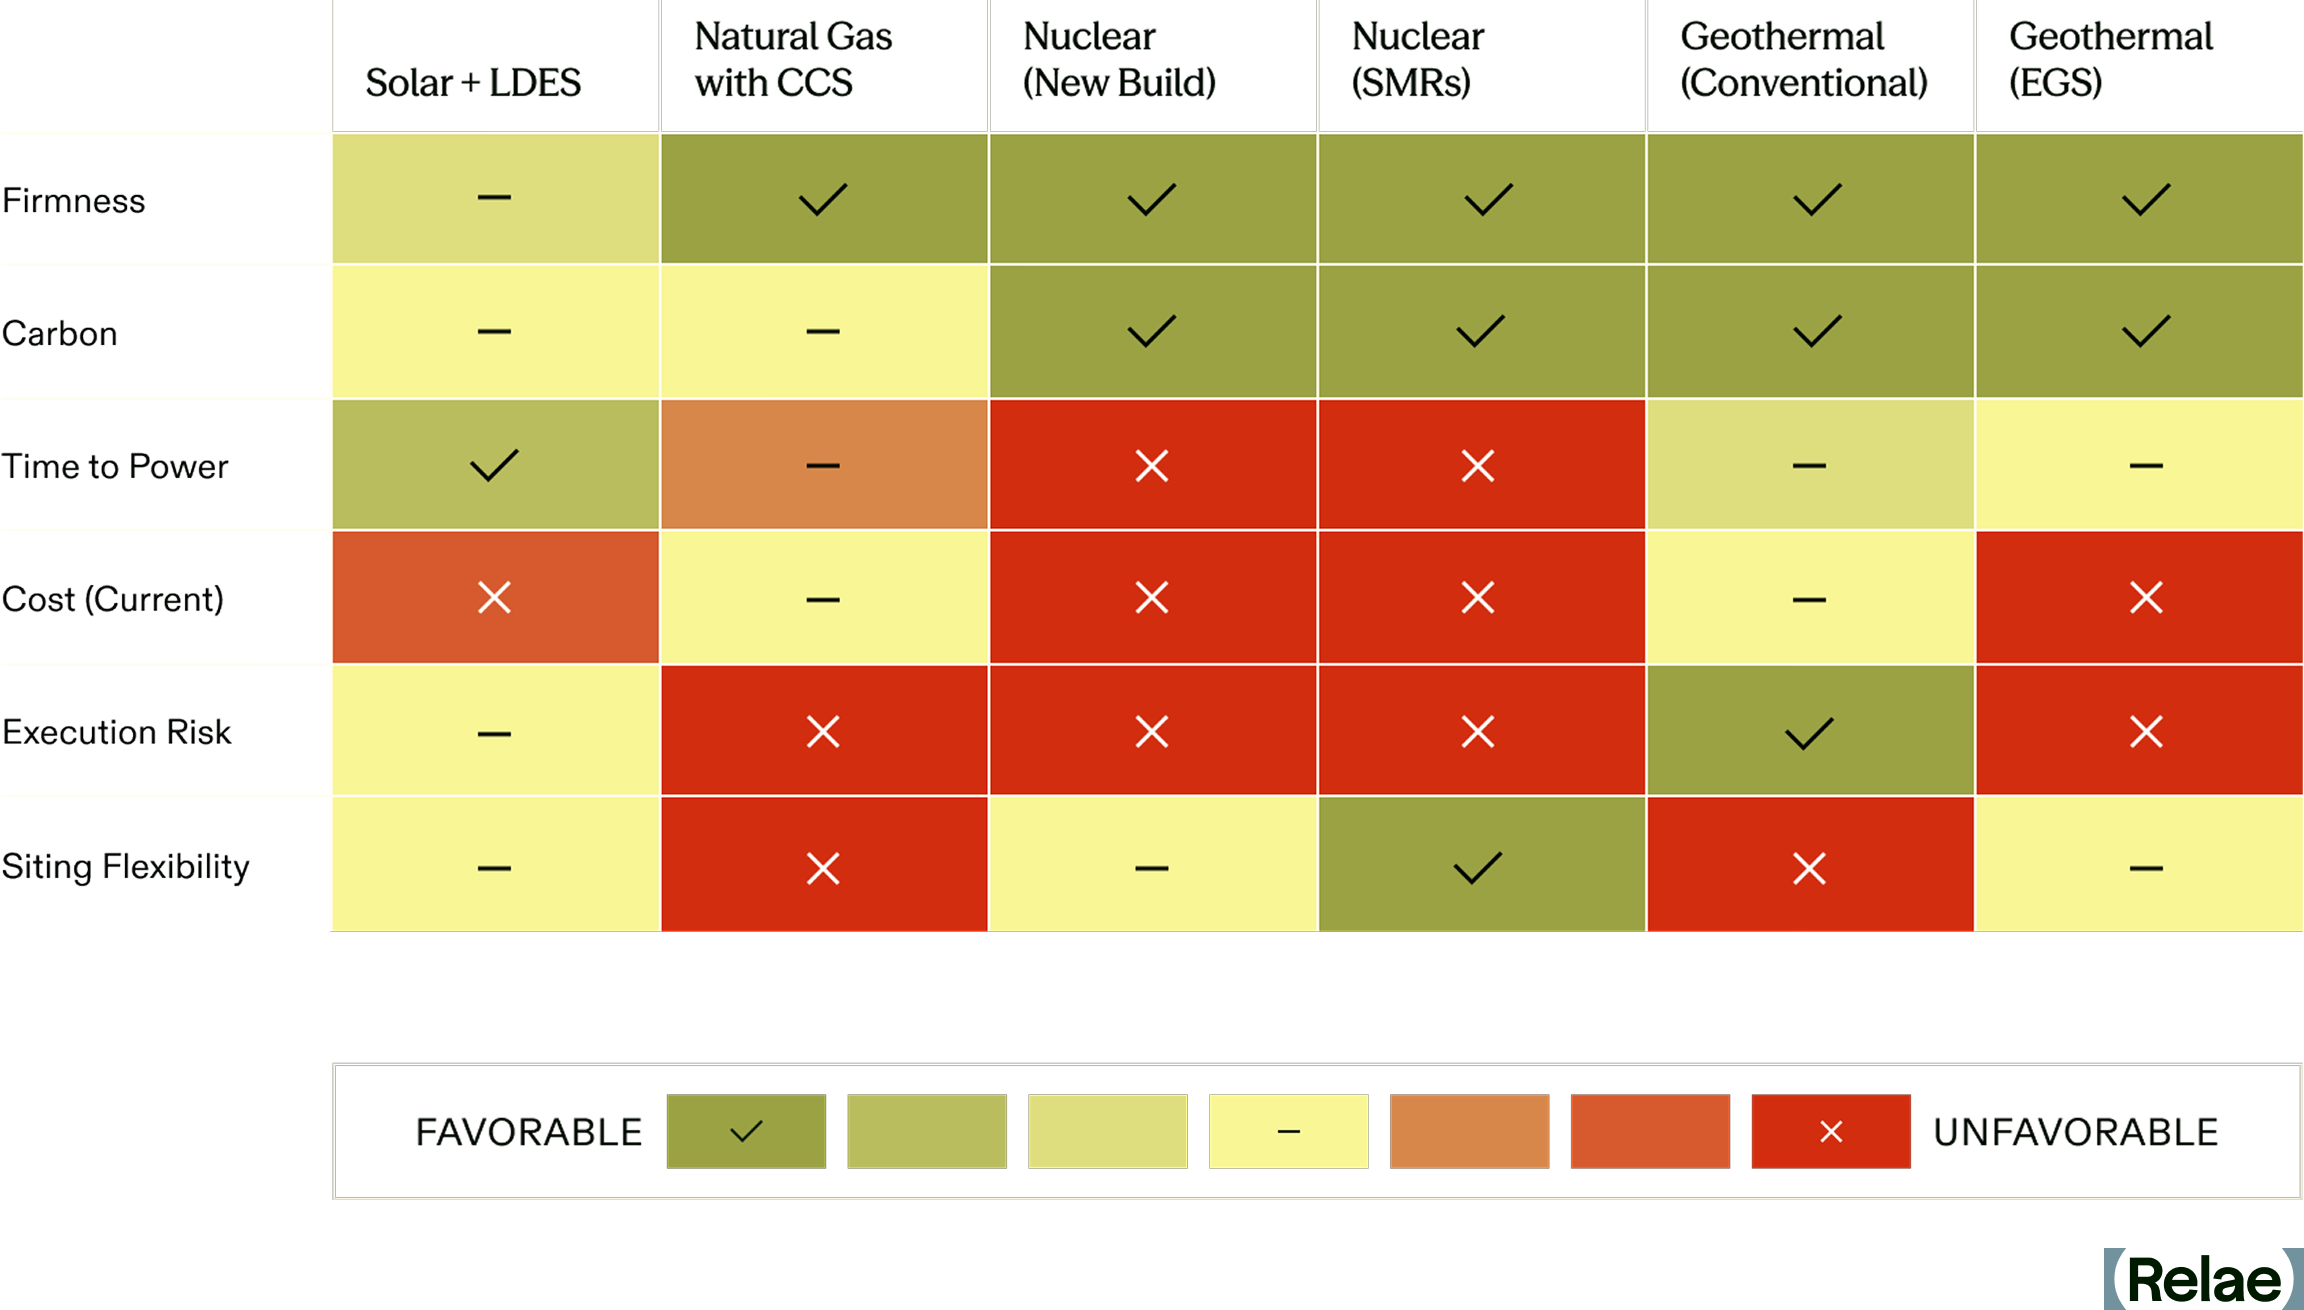
A resource that cannot be energized for a decade, or sited near load, or delivered at a price a buyer cannot defend internally, may be infeasible regardless of what else it offers. None of the four clean firm generation technology groupings clear every hurdle today, but they can satisfy different buyer priorities.
Solar or wind with LDES offers more buyer flexibility, at a price. Enough generation, storage, and other firming can deliver the reliability required, and the buyer sets that target. But the increments get expensive quickly, especially when reliability gaps remain long or unpredictable. Covering more hours means more storage and more generation to fill it, so each step toward firmness parity costs more than the one before it. Firming shortfalls also carry carbon consequences, depending on what gets called to compensate. Those emissions may be absent from GHG accounting ledgers, but that doesn’t stop them from hitting the atmosphere.
Gas with CCS is challenged by execution and siting because the product depends on a chain: gas generation, capture, transport, and a permitted storage site capable of permanent CO2 disposal at scale. Each piece can be developed and tested, but low-carbon electricity requires all of them to work together, which can only be demonstrated once all are built. A buyer cannot substitute a link, and cannot observe the whole chain before committing. Clean, in this sense, is conditional, and the delivered power could end up being far more carbon-intensive than advertised.
Nuclear ranks poorly on time, cost, and execution, but full-scale reactors and small modular reactors carry those weaknesses differently. A large reactor arrives in one piece, and its schedule and final cost come into focus as construction advances. By then, years and billions are committed; a buyer cannot learn from a fraction of a reactor before deciding whether to finish it. Small modular reactors are designed to break that capacity into increments a buyer could add as demand grows, which would ease the one-piece problem. But none are operating commercially in the US yet, and the signed deals target first power in the 2030s, so the modular promise is still years out.
Geothermal’s weaknesses work somewhat differently. Conventional hydrothermal is tightly constrained by location, which buyers can screen before choosing where to procure, or co-locate where possible. Next-generation geothermal, including EGS, could widen that geography considerably.
For EGS, the largest remaining uncertainty is execution: whether the developers can replicate successful drilling and reservoir performance at commercial scale. Part of that risk belongs to the rock, and no contract can make a reservoir perform. But drilling also produces information before the entire project has been built, and geothermal capacity can often be developed incrementally as needed. A buyer can require resource evidence before committing, tie later commitments to demonstrated performance, or spread procurement across projects rather than depend on a single field.
Geothermal’s flexibility has limits. A buyer who needs full capacity by a fixed date may have little room to wait for wells to perform before committing to the next phase. And successful wells do not eliminate risk in project expansion or guarantee performance in other locations. Execution risk stays with the resource. What geothermal offers is more opportunity to learn about that risk while a buyer can still do something about it.
Revisiting the Geothermal Premium
Geothermal contracts, especially EGS, remain expensive. But that premium looks different on this side of the comparison. Clean has a cost, but so does firmness, speed, reach, and execution. Every clean firm option pays for those attributes somewhere. Solar and wind contracts will remain cheap by comparison, but it’s the wrong comparison: the market signing geothermal contracts is pricing a much larger product.
That still leaves a hard decision. Geothermal and gas with CCS carry execution risk and siting constraints. Nuclear asks more of the buyer on cost and time. Firmed solar asks more as reliability requirements rise. The best option will change with each buyer, location, and project. Geothermal’s place in that choice is changing quickly. EGS is expanding where projects can be developed, drilling costs are falling, and commercial experience is growing. Those advances are bringing geothermal into consideration for buyers who previously had little reason to look its way.
And that may be the more revealing aspect of the geothermal market today: buyers are signing those contracts with the alternatives in full view. Their decisions offer an early indication of what clean firm power delivered in the right place and at the right time is worth, and which risks buyers are willing to carry to get it.
Frequently Asked Questions
Is Geothermal Cheaper Than a Solar PPA?
No, a geothermal power contract can be significantly more expensive than a solar PPA. But they're not the same product: solar meets annual clean-energy targets, while geothermal delivers firm, dispatchable power around the clock, which is why buyers are increasingly comparing it to nuclear and gas with CCS instead.
Is Geothermal Cheaper Than Solar with LDES?
Not necessarily on a per-contract basis, but the cost structures behave differently. Solar with LDES gets more expensive with every additional hour of reliability a buyer needs, since covering more hours means adding both more storage and more generation to fill it. Geothermal's premium, by contrast, is priced into the contract upfront as a firm, dispatchable product from day one.
How Does Geothermal's Risk Compare to Gas with CCS?
Differently, in a way that matters to buyers. Gas with CCS depends on a chain (generation, capture, transport, and storage) that can only be verified once the whole system is built, so a buyer can't test it piece by piece. Geothermal generates performance data incrementally through drilling, letting buyers require resource evidence or tie commitments to demonstrated results before committing further, though this data does not come free.
Which Deploys Faster, Geothermal or Nuclear?
Geothermal, in regions with already-proven resources. Fervo's Cape Station, for example, broke ground in 2023 and is on track for first power in late 2026 and 500 MW by 2028: a fraction of a typical new-nuclear large reactor timeline.
The 2026 Criteria: Designing and Delivering High-Quality Carbon Removal
Key Takeaways
- High-quality carbon dioxide removal (CDR) projects require robust project management and oversight to deliver credits on time and at the promised volume; delivery risk is a distinct concern that quality standards alone don't catch.
- The sixth edition of the Criteria for High-Quality Carbon Dioxide Removal is the first to provide an approach to evaluating both credit quality and delivery risk, adding a new delivery risk appendix built around the TECOP framework: technical, economic, commercial, organizational, and political risk.
- The 2026 Criteria provides a framework for developers, investors, and buyers to evaluate both project quality and delivery risk.
- This year's update draws on 170 new diligence reports from 2025 and the input of more than 60 subject matter experts, building on a foundation of six years of lessons from professional diligence across hundreds of real-world CDR projects.
The Criteria Create a Shared Standard for Credit Quality
Relae (formerly Carbon Direct) first launched the Criteria for High-Quality Carbon Dioxide Removal (the Criteria) in collaboration with Microsoft in 2021 to help rapidly and justly scale the development of high-quality carbon dioxide removal (CDR) credits. The market didn't yet have a shared definition of what "high-quality" meant, so we laid out transparent, science-based benchmarks that gave developers, investors, and buyers a common foundation to work from. Every year since, we have gone back and sharpened those benchmarks so that they keep pace with the quickly evolving industry.
But a shared definition of quality doesn't guarantee the delivery of credits as planned. The 2026 edition is the first to tackle that gap directly, pairing the Criteria's quality benchmarks with a new framework for evaluating delivery risk.
The Six Principles of High-Quality Carbon Removal
The Criteria defines six science-based principles that apply across engineered, hybrid, and nature-based CDR approaches:
- Social harms, benefits, and environmental justice: The extent to which the project prevents new social harms to people and communities, reduces existing harms, and provides meaningful benefits distribution.
- Environmental harms and benefits: The extent to which the project minimizes and mitigates environmental harms, as well as provides environmental benefits.
- Additionality and baselines: The evidence that the project’s carbon removal would not have occurred without carbon finance.
- Measurement, monitoring, reporting, and verification (MMRV): The ability to accurately quantify carbon removal in a repeatable and verifiable way, and to develop a plan for long-term monitoring of the project.
- Durability: The likelihood that removed carbon remains stored over time, with mechanisms in place to mitigate reversal risk.
- Leakage: The extent to which project activities cause increased emissions elsewhere.
These principles provide a consistent foundation for carbon removal procurement, evaluation, and project benchmarking.
[cta]
Supporting the Delivery of High-Quality CDR Credits
"Projects must work better operationally and be more commercial. Quality and delivery risk shape a project's risk profile at every point in its life, and this edition of the Criteria is the first to give buyers a way to judge both at once." Dr. Julio Friedmann, Chief Scientist, Relae
Designing projects to meet high-quality CDR criteria is only part of the challenge. Effective project planning, management, and execution are also essential to ensure that high-quality CDR tonnes successfully reach the market as planned. As discussed in CDR 2.0: Five Pillars of Successful Project Deployment and Delivery, managing delivery risk requires developers, investors, and buyers to understand the risks that can affect project success and align on how these risks are assessed and mitigated.
To support this alignment, the 2026 Criteria introduced a new Delivery Risk Appendix, which establishes a common framework and language for identifying and evaluating key delivery risks for the first time. Drawing on our broader observations of the carbon removal market and established approaches to project risk management, the appendix highlights common delivery risks across two broad CDR project types: open systems and closed systems. It organizes these risks into five categories: technical, economic, commercial, organizational, and political factors, also known as the TECOP framework.
The TECOP Framework for CDR Delivery Risk
- Technical delivery risks are associated with the technical feasibility of the project design, implementation, and long-term operation of the project
- Economic delivery risks are associated with the project’s financing structure, financial modeling assumptions, and expenditure profile
- Commercial delivery risk reflects the extent to which a project's purchase agreements, supply arrangements, and key contractual relationships are secured or well-advanced.
- Organizational delivery risks center on the project developer's capacity and capability to successfully plan, execute, and manage a project of the appropriate size and complexity.
- Political delivery risks are associated with governance, policies, and potential changes in regulatory environments, as well as the local communities’ perception of and willingness to participate in projects.
New Additions to the 2026 Criteria
Since publishing the 2025 Criteria, Relae has conducted an additional 170 diligence reports across established and emerging CDR pathways, ranging from reforestation and enhanced rock weathering (ERW) to direct air capture (DAC). To date, less than 10% of all 900+ projects the team has reviewed have met the bar for high-quality. These diligence efforts, together with insights from market analysis and ongoing synthesis of the latest scientific and technical literature, have deepened our understanding of how CDR project quality has evolved over the past year.
The 2026 Criteria leverage these insights and the expertise of more than 60 subject matter experts to reflect advances across the CDR industry and address key weaknesses that remain in the market across all pathways.
A few of the most significant updates to the Criteria include:
Addition of Direct Counterparty Considerations: Direct counterparties are the organizations that developers partner with, and are structurally dependent on, to generate credits. This can include:
- Primary feedstock providers (e.g., mines, biomass providers, tree nurseries)
- Major implementing partners (e.g., local implementation partners, base facilities, transportation and storage providers, major product offtakers)
- Land owners that make up a significant proportion of project land
To reflect the key role that direct counterparties play in high-quality credit generation, developers must conduct diligence and disclose on their direct counterparties to demonstrate that they are not causing social or environmental harm.
Increased Rigor for Enhanced Rock Weathering Projects: Over the past year, ERW’s presence in the CDR market has grown substantially, and so too has the market’s understanding of the corresponding scientific and technical rigor required to deliver high-quality tonnes. The 2026 Criteria raised the bar for how ERW projects:
- Measure and prove their carbon removal claims
- Mitigate risks related to potentially toxic elements (PTEs)
- Incorporate more sophisticated farmer protections and benefits
Projects now have to back up their numbers with multiple physical field measurements, not just computer models; and they must now track and account for every significant loss pathway, from plants taking up minerals to carbon escaping from rivers and oceans.
Use of Dynamic Baselines for ARR Projects: ARR projects are increasingly using dynamic baselines to provide a more accurate reflection of the counterfactual scenario (e.g., what would have happened in the absence of the project). This is reflected in the 2026 Criteria with a requirement that ARR projects, with the exception of agroforestry projects, use dynamic baselines with statistically matched controls.
What’s Next?
The 2026 Criteria create a clear, science-driven framework for both designing and delivering measurable, just, and durable carbon removal. However, the Criteria cannot ensure high-quality tonnes reach the market on its own; good criteria do not replace robust diligence. To put these criteria into practice, we encourage developers, standard-setting bodies, buyers, investors, and policymakers to consider how the Criteria can be used to inform their role in enabling the carbon market to deliver high-quality tonnes and to engage in deep diligence and ongoing monitoring over the life of a project.
This edition of the Criteria reflects what we have learned over the past year, but our work is not done. We will continue to update it so that it remains a living document that evolves with the science and the market. To do so effectively, it must be a collaborative effort; we welcome input from carbon market actors, academia, and communities.
Frequently Asked Questions
Who publishes the Criteria for High-Quality Carbon Dioxide Removal, and how often is it updated?
Relae (formerly Carbon Direct) first published the Criteria for High-Quality Carbon Dioxide Removal with Microsoft in 2021 and have updated it every year since. The 2026 edition reflects six years of lessons from real-world project diligence and advances in climate science.
What are the six principles of the Criteria for High-Quality Carbon Dioxide Removal?
The Criteria define six science-based principles that apply across all CDR pathways: social harms, benefits, and environmental justice; environmental harms and benefits; additionality and baselines; measurement, monitoring, reporting, and verification (MMRV); durability; and leakage.
What CDR pathways does the Criteria cover?
The Criteria include pathway-specific criteria across nine CDR pathways: afforestation, reforestation, and revegetation (ARR); mangrove forestation; improved forest management (IFM); soil carbon; enhanced rock weathering (ERW) in croplands; biomass carbon removal and storage (BiCRS); abiotic marine CDR; carbon mineralization; and direct air capture (DAC).
What is delivery risk in carbon removal?
Delivery risk is the likelihood that a project generates credits on the timeline and at the quantity committed to buyers. It's a distinct concern from credit quality: even a high-quality project can fail to deliver as planned because of technical, economic, commercial, organizational, or political risk, the five categories the Criteria's TECOP framework evaluates. The 2026 Criteria's new Delivery Risk Appendix gives developers, investors, and buyers a shared benchmark for identifying and managing these risks before they derail a project.
What's the relationship between carbon removal credit quality and delivery risk?
Credit quality and delivery risk are distinct but interrelated. A project that fails to deliver credits as planned reduces the availability of high-quality CDR tonnes in the market, and weaknesses in credit quality can themselves increase delivery risk by creating buyer uncertainty or limiting access to project financing. The 2026 Criteria provides a framework for evaluating both quality and delivery risk.
Carbon Direct Is Now Relae
Why I Started Carbon Direct
I have spent most of my career in energy and commodity markets. In these roles, I found that the most consequential opportunities come from recognizing structural change: when emerging market growth fundamentally alters commodity demand, when shale technology fundamentally reshapes the outlook for energy supply, or when physical infrastructure can no longer keep pace with economic change.
Those are the same types of questions that led me to start Carbon Direct in 2020.
Companies and governments were starting to consider climate decision-making in their most important planning. Enormous commitments were being made around carbon removal, low-carbon fuels, clean power, and industrial decarbonization. But many of those decisions were being made without independent scientific and technical expertise. I believed there was a need for a company that could bring serious scientific judgment into these consequential climate and commercial decisions.
So we built one.
Carbon Direct assembled a world-class team of scientists, engineers, market analysts, and policy experts who could evaluate our clients’ most difficult climate questions. Since 2020, more than 150 companies across six continents have relied on us to help with some of their hardest energy and climate decisions. We have completed more than 900 project diligences and have reviewed more than half of all tonnes contracted through announced carbon removal offtake agreements worldwide. Together with Microsoft, we established and annually updated the Criteria for High-Quality Carbon Dioxide Removal. In 2025, we acquired Pachama, bringing advanced digital monitoring, reporting, and verification technology into how we evaluate the integrity of forest carbon projects.
The Climate and Energy Moment We Met
Over the past few years, we saw developments on the horizon reshaping the climate and energy space. The digital economy became an energy and infrastructure economy, and our clients increasingly leaned on us to help make the decisions shaping this transition. We realized that companies cannot make credible climate commitments without understanding how electricity demand, grid constraints, and fuel choices are changing.
Carbon Direct increasingly worked at the center of a new set of critical decisions, and we spent the last year strategically reorganizing our team, our focus, and our capabilities around that shift to better meet this moment. But we were still operating under a company name that described only one important part of what we do.
I am enormously proud of what we built as Carbon Direct.
But the work we do has outgrown our name.
Today, Carbon Direct Becomes Relae
Relae - “ree-lay” - draws on the idea of a relay. In an electric system, a relay opens or closes a circuit in response to a signal. In a relay race, progress depends on a team carrying the work forward without losing momentum. The new name broadens and defines our scope. It does not change the climate mission with which we began.
Carbon removal remains central to our work and to our clients’ plans. Any credible pathway for addressing climate change requires large-scale carbon removal and the ability to deliver those removals with integrity. As Relae, our mission remains the same: to help organizations turn commercial and climate goals into credible, science-backed action. Our growing work in power and energy builds on that foundation. Relae's position at the intersection of climate and energy allows us to embed climate considerations into energy and power decisions from the start.
Where We Go From Here
Relae is structured around four areas of expertise: Power & Energy, Environmental Markets, Natural Capital, and Strategy & Analytics. Relae is one team that can move across the full spectrum of challenges and opportunities facing decision-makers today and in the years to come.
I believe consequential decisions deserve integrated intelligence, scientific rigor, and independent judgement. This is what Relae is built to do: bring climate into the decisions shaping the next generation of energy and infrastructure and help clients act on what is scientifically credible. Relae gives us a name that reflects the breadth and importance of this opportunity. I’m excited for this new chapter and how Relae meets the work ahead.
Why AI Data Centers Are Being Blocked: A Project-Level Examination
Key Takeaways
- Community opposition has blocked, withdrawn, or stalled more than $170 billion in announced AI data center investment across 20 US states since January 2024. The pace is accelerating: 6 cancellations in 2024, 25 in 2025, and more than 20 additional cancellations by May 15, 2026.
- Data center opposition is bipartisan. It spans red and blue counties, every region, and multiple grid operators, with nearly two-thirds of the blocked investment sitting in counties that voted for Donald Trump in 2024.
- Process and transparency, more than resource concerns alone, drive the fastest and most durable opposition. How a developer runs the engagement process shapes both community sentiment and the project’s ultimate success.
How Many AI Data Center Projects Have Been Cancelled?
Between January 1, 2024, and May 15, 2026, community opposition blocked, withdrew, or stalled 46 announced AI data center projects across 20 US states, representing more than $170 billion in announced investment. These values are disclosed or derived for 35 of the 46 projects; the remaining 11 carry no public figure.
[stat]
The pace of successful opposition has accelerated sharply. Cancellations rose from 6 in 2024 to 25 in 2025. The first five months of 2026 added more than 20 additional cancellations, the fastest stretch on record.
Virginia leads the state count with 11 blocked projects, followed by Indiana with 7 and Texas with 5. Together, those three states account for roughly half of all cancellations in the dataset. The PJM grid region carries the largest single share of blocked investment at $70 billion across 13 projects, followed by MISO at $37 billion.
Is Opposition to Data Centers Bipartisan?
Yes. The opposition wave crosses party lines on every measure we examined. Republican-leaning counties hosted 28 of the 46 projects (61%), Democratic-leaning counties hosted 16 (35%), and 2 fell within five points.
Weighted by announced investment, about two-thirds of blocked dollars sat in Republican-voting counties. Strong Republican counties (those Trump won by more than 15 points) account for $99 billion across 23 projects. Strong Democratic counties account for $29 billion across 9 projects. The remaining $44 billion spans Lean Republican, Tossup, and Lean Democratic counties.
Why Are Communities Opposing Data Centers?
Communities raise a consistent set of concerns across the country: water demand, electricity rates, air quality where developers propose gas co-generation, rural character, and a lack of transparency in the development process.
Across the seven cases that we studied in depth, process, and transparency concerns were the most consistently cited factors associated with opposition. Non-disclosure agreements between developers and local officials, ownership structures in which the ultimate end-user was not publicly identified, and closed-door pre-application negotiations produce opposition faster and more durably than any other concern.
The pattern holds across very different communities: a diffuse civic mobilization in rural Georgia, an NGO water coalition in a Texas college town, a conservation coalition anchored by the Southern Environmental Law Center in Southside, Virginia, and an institutional civic organization with legal-expert and celebrity support in northern Virginia. Each produced the same outcome, and each flagged process and transparency as a dominant or top-three concern in the public record.
By the time a project reaches its first public hearing against organized community opposition, the political path of the project is largely set. Late-stage benefits packages consistently fail to reverse that trajectory. Communities read them as concessions, not commitments.
Assess Community Opposition Risk Before You Site
Community opposition is now a structural feature of the AI data center siting environment. The patterns are clear enough to act on now. Relae's Community Impacts team helps developers and capital partners implement responsible development standards through pre-siting community intelligence, calibration of benefits design to specific community contexts, and building the verification scaffolding that turns commitments into outcomes.
[cta]
Frequently Asked Questions
Which states are banning data centers in the US?
The first statewide moratoriums on data centers have arrived. In July 2026, Governor Hochul signed the country's first statewide moratorium, an executive order pausing state environmental permits for up to one year for new data centers of 50 MW or more. Texas followed weeks later, halting approvals of new data center grid connections until state regulators audit their power, water, tax, and ownership details. This is a snapshot from August 2026, and we will likely see additional changes in the months ahead.
The local picture is more developed. Individual municipalities and counties have adopted moratoria and zoning ordinance amendments that block or restrict data centers within their jurisdictions. The City of Peculiar, Missouri, removed data centers from its light-industrial zoning entirely. Monroe County, Georgia, and Jones County, Georgia, both adopted moratoria after project denials in 2025. Cassville Township, Wisconsin, and San Marcos, Texas adopted zoning and code amendments in 2026. State legislatures in Virginia, Indiana, Texas, and Missouri have taken up data center siting, ratepayer, and permitting legislation, though most bills remain in progress rather than enacted.
How much data center investment has been blocked in the US?
More than $170 billion in announced AI data center investment has been blocked, withdrawn, or stalled by community opposition across 46 projects and 20 US states between January 1, 2024 and May 15, 2026.
Relae arrived at this figure from data on 35 of the 46 projects; 11 have no publicly disclosed investment value. The pace has accelerated sharply: 6 cancellations in 2024, 25 in 2025, and more than 20 additional cancellations in the first five months of 2026 alone. Virginia leads the state count with 11 projects. The PJM grid region carries the largest single share of blocked capacity at $70 billion across 13 projects.
What causes a data center project to be cancelled by community opposition?
As of August 2026, communities cite a consistent set of concerns across cancelled projects: water demand, grid strain and residential rate impacts, air quality where developers propose gas-fired co-generation, rural character and farmland conversion, and lack of transparency in the development process.
In the seven cases we studied in depth, process and transparency were together the most consistent driver of opposition. Non-disclosure agreements between developers and local officials, shell LLC ownership structures that conceal the end-user, and closed-door pre-application negotiations produce faster and more durable opposition than any single resource concern. Late-stage benefits packages consistently fail once that transparency-driven frame has formed.
Dynamic Line Rating: The Fastest Gigawatt Is the One You Already Have
Key Takeaways
- Power demand is outrunning buildout. Meeting large load growth requires more than new generation; it requires faster interconnection and congestion relief on existing transmission lines.
- Dynamic line rating (DLR) is available today, deploys in months, and enables faster speed-to-power. On the right thermally congested lines, DLR can unlock more capacity at a fraction of new infrastructure cost. In one utility demonstration, 5% to 10% of additional capacity was enough to clear most of the congestion on the lines studied.
- DLR has been held back by weak incentives, but that is changing. Utilities earn a regulated return on capital they invest in new assets, which favors building new infrastructure over lower-cost solutions like DLR. Load growth and new Federal Energy Regulatory Commission (FERC) mandates are starting to shift the calculus.
The Grid Cannot Expand Fast Enough for AI Demand, But It Can Carry More
Power demand is booming as data centers scale across the US grid, and current grid infrastructure cannot supply it. This constraint is physical, not financial. Meeting this demand requires a significant amount of power generation and infrastructure upgrades. More than 2 terawatts of generation and storage sit in interconnection queues, roughly 1.5x the total installed generation capacity in the US.
Regional markets are working to accelerate generation buildouts, but connecting that generation to the transmission network remains expensive and slow to match speed-to-power needs. New high-voltage lines take years to permit, cost between $2 million and $6 million per mile to build, and major projects routinely take five to ten years from identification to energization. For example, PJM Interconnection LLC (PJM) identified the Doubs–Goose Creek 500 kilovolt (kV) corridor as a bottleneck feeding Data Center Alley in 2023 and set June 2027 as the date a fix was needed. Dominion Energy's published schedule for its portion of that rebuild anticipates a completion date of 2031.
A number of studies1,2 show there is headroom in the bulk transmission system. Grid-enhancing technologies, such as dynamic line rating (DLR), can convert part of that headroom into capacity today while new generation and transmission are being built. DLR lets suitable transmission lines increase their carrying capacity in real time, unlocking that headroom at a fraction of the cost of a buildout. Realizing that value is a targeting exercise with a key question: On which thermally limited lines can DLR actually relieve congestion?
What Is Dynamic Line Rating?
Dynamic line rating is a method for calculating a transmission line's real-time carrying capacity using live weather and conductor-temperature data. It lets grid operators safely carry more power whenever weather conditions allow.
Most transmission lines operate under a static rating: a fixed, conservative limit on current, set for worst-case weather and held all year. The limit is based on temperature, because pushing too much current can overheat the conductor wire. Metal conductors expand as they heat, which can make them sag and touch trees or other obstacles, causing short circuits or fires. Real conditions almost always cool a conductor better than the worst-case assumption a static rating is built on. That means the line can carry more current while staying at the same maximum conductor temperature, and therefore within the same sag and clearance envelope. That headroom is exactly what DLR captures: instead of leaving it on the table, DLR recalculates the line's rating in real time so operators can use the extra capacity safely.
Beyond a static rating is the ambient-adjusted rating (AAR), which many utilities have begun adopting. An AAR recalculates the rating from forecast ambient air temperature, typically hourly and out to several days. DLR goes further, adding wind speed and direction, solar heating, and in some deployments the conductor's measured temperature.
DLR technologies rest on a heat-balance algorithm: how fast a line heats up (from electric current and sunshine) versus how fast it cools off (from wind and cold air). The calculations are standardized in IEEE 738 in North America and CIGRE 601 internationally. The data feeding those calculations can come from line-mounted sensors, weather models, or both, depending on a tradeoff between per-span accuracy and the cost of installing sensors along every span.
Even so, DLR remains limited in the US, and AAR has been slow to arrive. FERC's Order 881 required the transmission providers it regulates to adopt AAR by July 2025, but FERC has granted numerous extensions. PJM became the first to fully implement AAR in March 2026, while Midcontinent Independent System Operator (MISO) and New York Independent System Operator (NYISO) are not expected until 2028.
The Near-Term Value of DLR: Reducing Grid Congestion
DLR's value is immediate. It can be installed in months, not years, so a currently congested line can start carrying more power the moment conditions allow, reducing congestion right away. When cheaper generation is available upstream of that line, DLR cuts costs directly, because grid operators no longer need to dispatch pricier generation downstream of the congestion to supply load. That means DLR can reduce congestion costs in the current delivery year, compared to a transmission line rebuild that sits in a decade-long queue.
Over a longer horizon, utility planners can build that headroom into long-term capacity models. This is important, because current capacity-expansion and integrated resource plan (IRP) models still run on static or seasonal ratings, and typically leave out the potential gains from grid-enhancing technologies like DLR.
NERC's large loads white paper and FERC's RM26-4 rulemaking both raise the issue of how utilities can absorb multi-hundred-megawatt data center requests without a decade-long transmission build. Solutions like DLR are one of the few tools that can compress that timeline.
The hardware itself is cheap: sensors and data management cost a small fraction of any physical upgrade. That means the economics comes down to identifying the lines that benefit most from DLR. This is particularly important because on most US grids, congestion concentrates on a small number of lines that repeatedly reach their limits. On those lines, DLR can cut congestion costs directly and defer costlier upgrades, while its potential on other lines may be far lower. As a result, identifying those high-potential, thermally congested lines is essential.
Proven DLR Examples in the Industry
Real deployments show DLR can reduce a meaningful share of transmission congestion costs, with extra carrying capacity above the static rating running roughly 5% to 30%, depending on how often that capacity is available. In Oncor's ERCOT demonstration, 5% of additional capacity would have relieved up to 60% of congestion on the target lines, and 10% would have practically eliminated it. PPL Electric in Pennsylvania/PJM reports annual customer savings of $23 million after deploying DLR across its initial three lines. The DLR installation cost about $250,000, against a rebuild alternative that would have cost about $50 million and taken far longer.
The contrast abroad is instructive. Austria's grid operator, APG, recorded about $13 million a year in congestion savings across roughly 15% of its network. While these savings are real, it's important to recognize that these results come from single, well-chosen, badly congested lines.
The UK's National Grid began with a two-year DLR trial on a single 275 kV circuit in 2022, expanded to more than 275 kilometers of its network by 2025, with estimated consumer savings of about $26 million a year. In April 2026, National Grid signed a five-year contract covering 585 kilometers more, with most installations due by 2028 and potential savings of up to $66 million. Each expansion followed measured results from the stage before it.
Where the Headroom Is: Screening PJM's Data Center Alley
To illustrate the congestion savings from DLR, Relae screened PJM's five-minute real-time market record for every binding transmission constraint in 2025. For each one, we captured the shadow price, the marginal value of relaxing that constraint.3
Our analysis focused on thermal constraints, and then identified lines that bind frequently, in conditions milder than the worst case their static rating was set for, which is when a conductor's true rating sits above its static assumption. For the lines that we identified, congestion costs were added over the binding hours to set a bound on the savings that could result from DLR. That full amount would not necessarily be realized in practice, because the shadow price values only the next megawatt freed, and relieving one line can shift the constraint to the next. However, it serves as a useful estimate for the scale of savings that could be achieved.
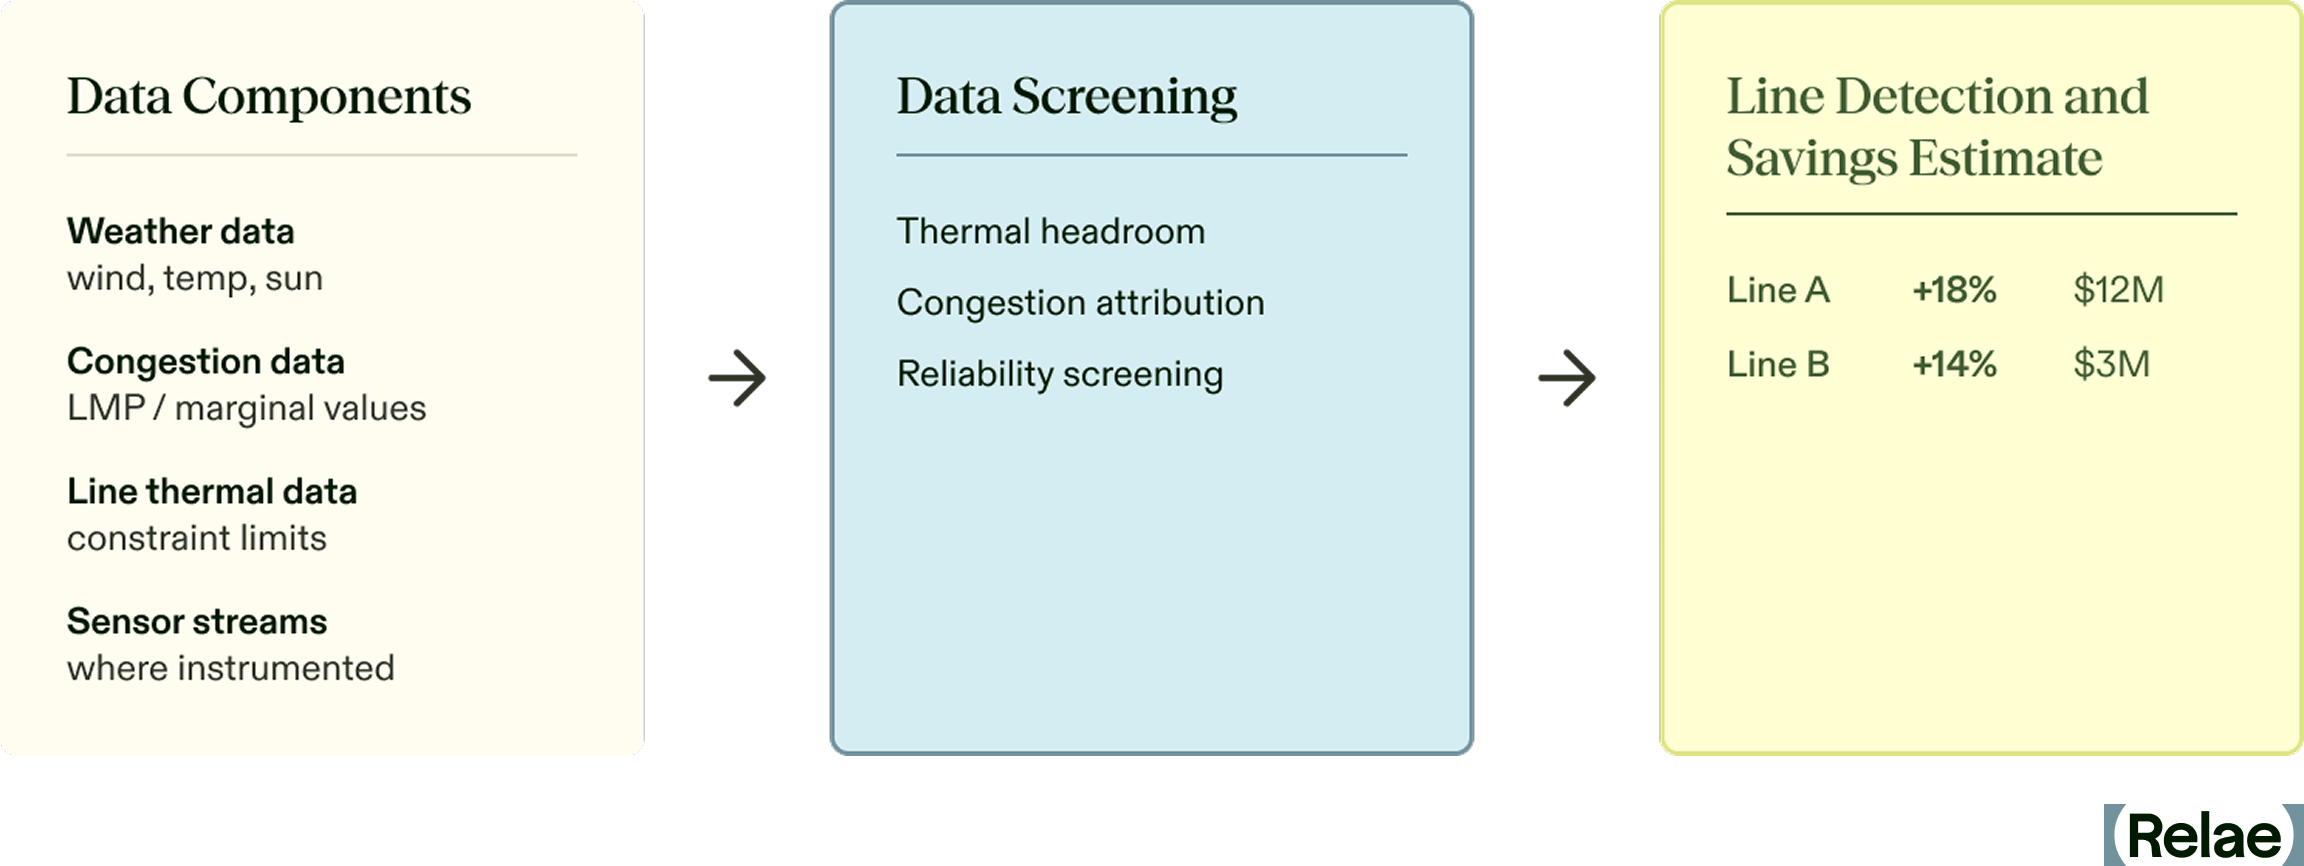
We ran the analysis on the Dominion (DOM) zone in PJM, home to Data Center Alley in Loudoun County, Virginia. Figure 2 shows a high-level section of the grid. The 500 kV bulk grid steps down through transformers to the 230 kV substations feeding the data centers, with the lines that experience recurring congestion highlighted. A handful of those 230 kV lines showed up as binding thermal constraints again and again.
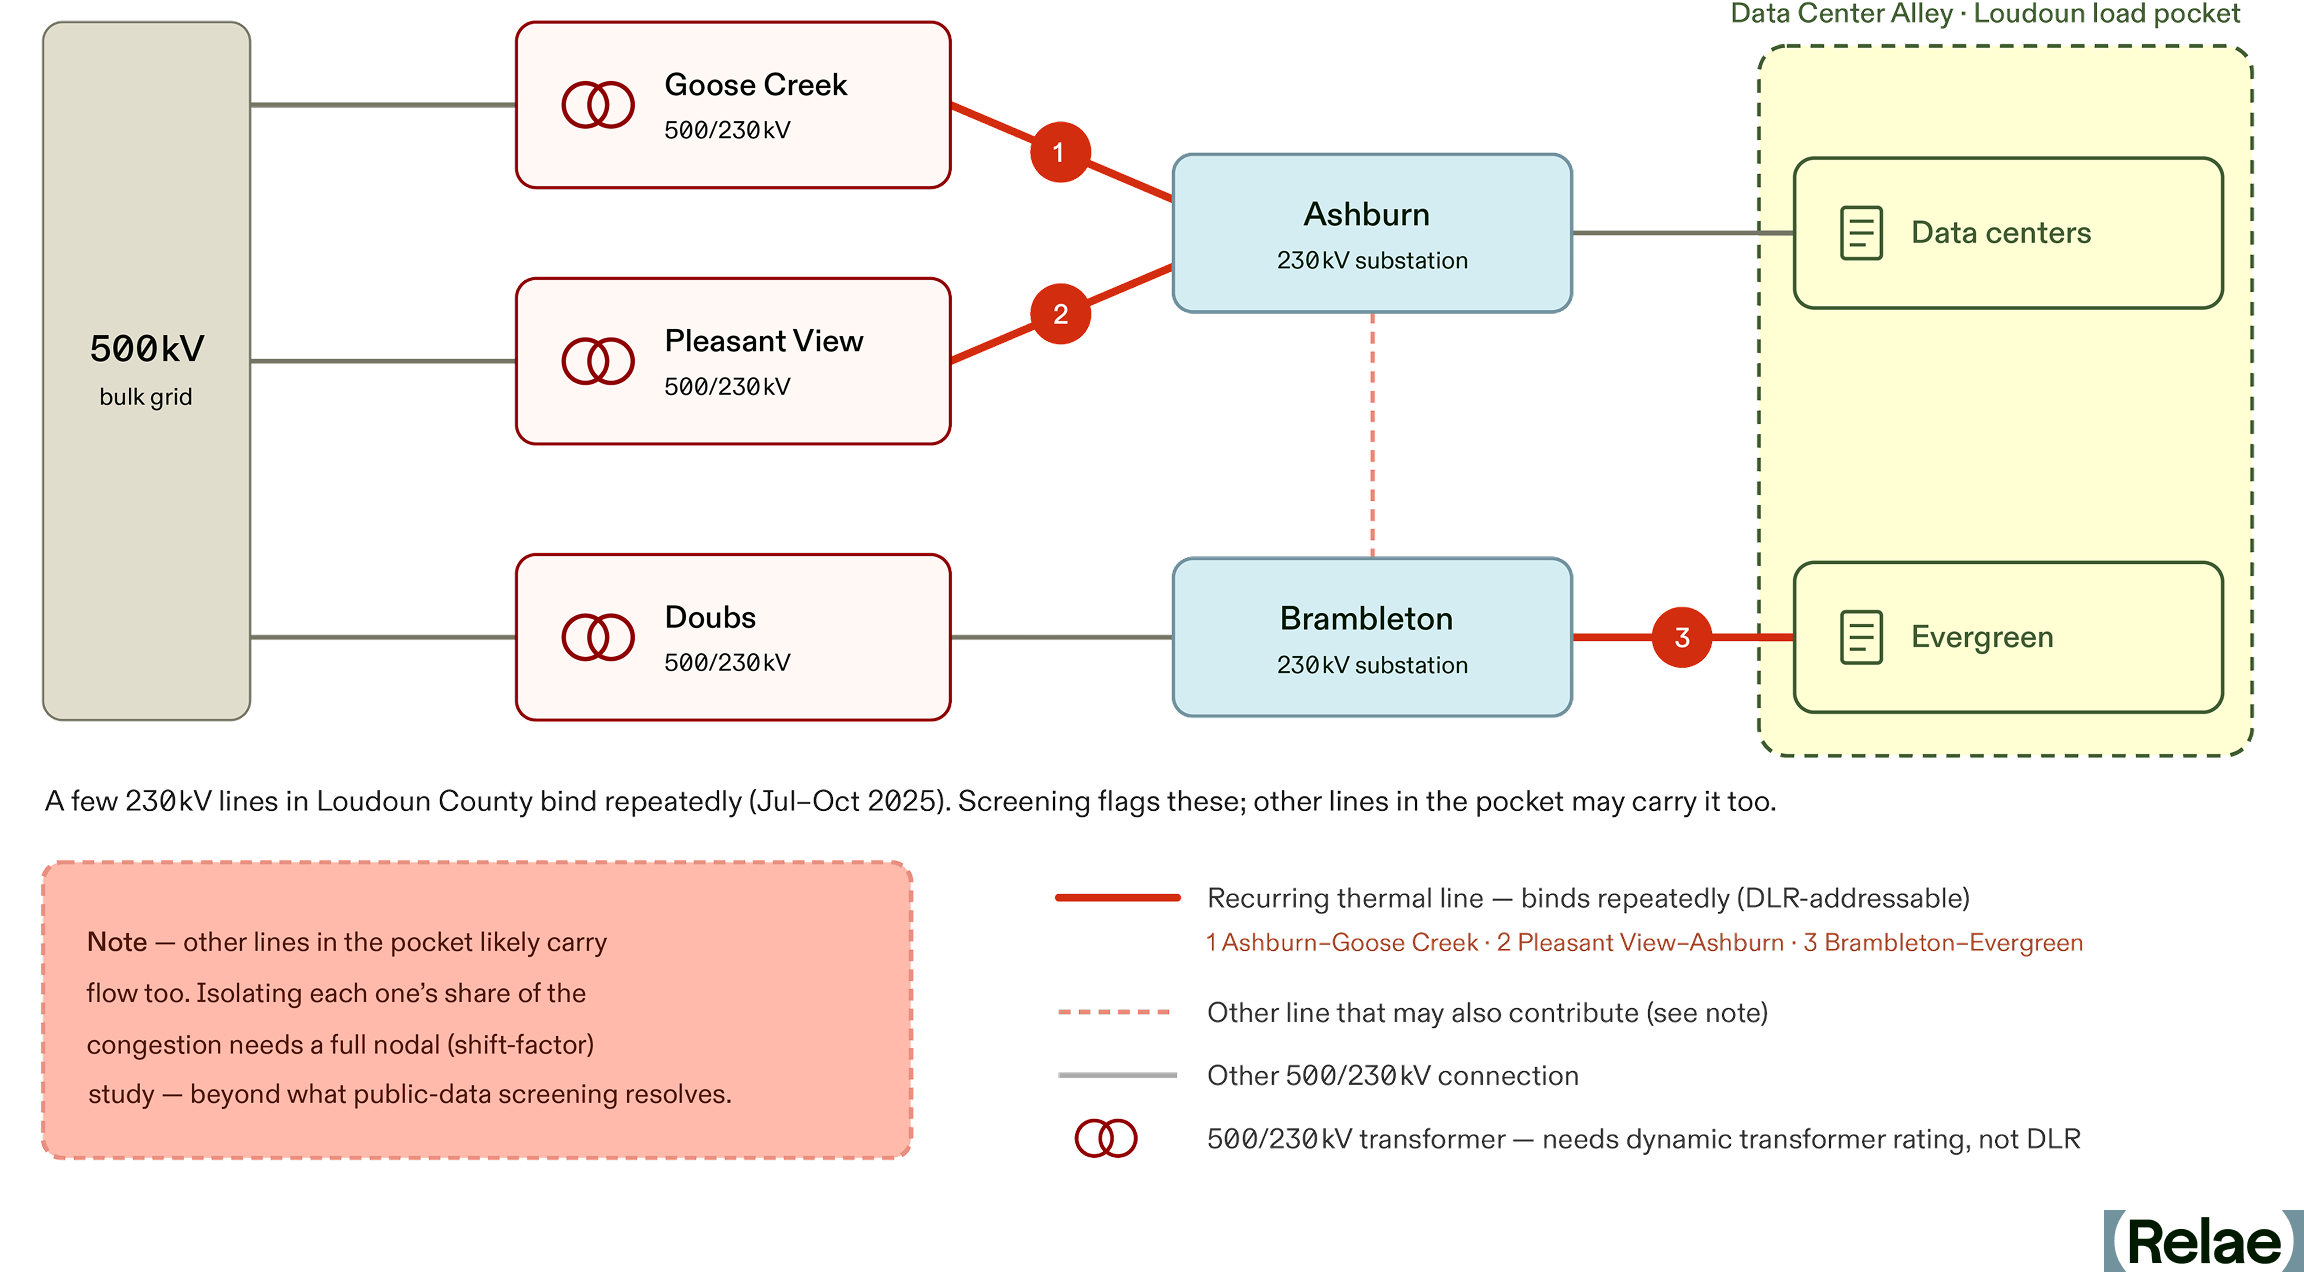
The congestion in DOM isn't constant, and it concentrates in particular months and within the day in particular hours. Figure 3 shows three transmission lines within the DOM zone and the number of hours each was thermally congested in each hour-of-day slot over 2025. Binding concentrates in the warm months and, within the day, from late morning through early evening.
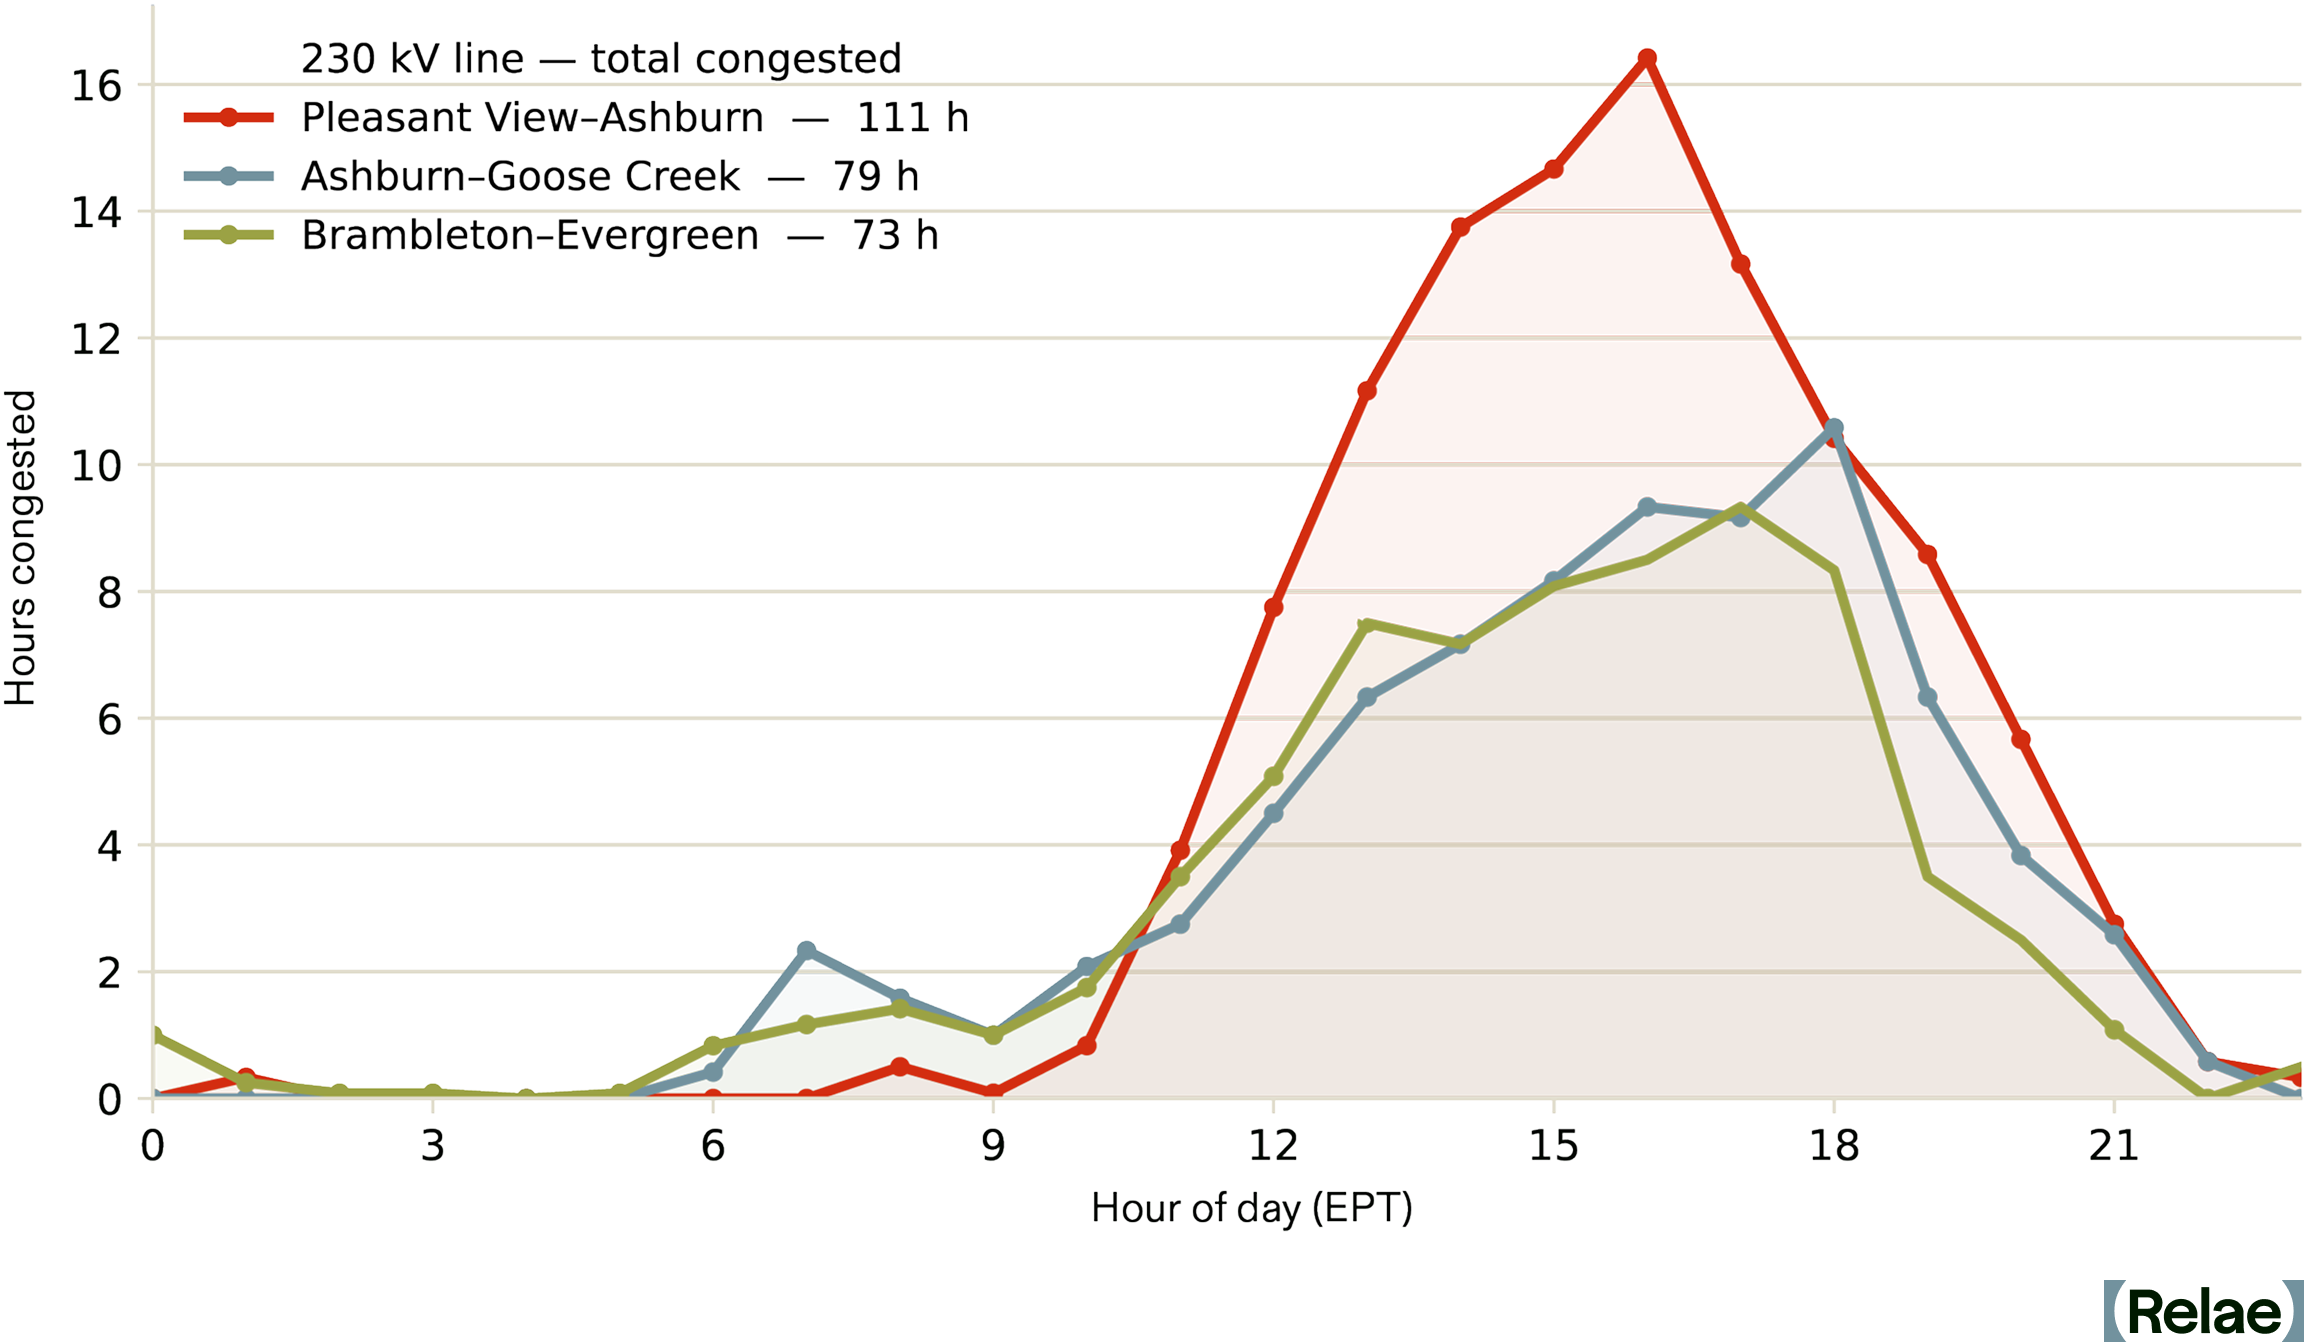
At first glance, this period looks like the wrong window for DLR. The local weather record says otherwise. These periods turn out to be some of the windiest hours of the day, not the stillest. Median wind speed at Dulles ran about 3.5 m/s, above the 0.6 m/s crossflow a static rating conventionally assumes, with fewer than 5% of observations falling below that threshold. Median ambient temperature in those hours was about 26°C, against the 35–40°C a static summer rating is typically built for. Across all three lines, the large majority of congested hours coincided with weather that would have supported a materially higher rating.
Valuing just one megawatt of DLR relief at each five-minute shadow price, the estimated savings are worth roughly $300,000 in this three-line example across about 263 line-hours.4
Because the value concentrates on a handful of thermally limited, heavily congested lines, and because the operational case has to be made line by line, capturing the opportunity is fundamentally an analytics problem: find the right lines, and prove the savings.

What Does It Take to Scale DLR?
DLR is cheap and effective, but two things stand between it and broader adoption: incentives and advanced grid analytics.
The utility cost-of-service model recovers investment in generation and transmission assets and earns its profit as a regulated return on the capital deployed. Because rates recover capital rather than power delivered, utilities have a stronger incentive to build or upgrade lines than to move more power across the ones they already own. That bias toward capital investment over optimization is why a mature technology has stayed niche in the US for years. Regulators have started to look more closely at this, but the main federal rule still mandates the milder AAR, not DLR, and leaves the return model untouched.
Contingency analysis compounds the problem. Current models are built around fixed line limits. A rating that changes hour to hour adds real modeling work, and more importantly, the system still has to hold under worst-case contingencies. So while operators already forecast weather daily for wind and solar, the harder step is trusting a forecast enough to commit a transmission limit against it. That takes significant predictive analytics built into system planning, not bolted on after.5
How Policy Is Starting to Shift the Calculus
Policy is starting to move the incentive problem. FERC's Order 881 made AAR the minimum for the transmission providers it regulates (effective July 2025, with several operators on extended timelines) and required markets to be capable of accepting dynamic ratings. PJM has started to implement this: PPL Electric has run sensor-based DLR on nine congested lines since 2022, feeding PJM's day-ahead markets.
Order 1920, FERC's first long-term transmission-planning overhaul in more than a decade, now requires planners to formally evaluate grid-enhancing technologies like DLR against conventional builds. It stops short of mandating deployment, but it forces a comparison utilities used to skip. That comparison is now written into filed tariff processes (PJM filed its plan in December 2025). Those first cycles only began in 2026, and the order allows up to three years to reach a selection, so the results are still pending.
A shared-savings incentive, letting a utility keep a slice of the congestion savings it creates, has been proposed to FERC and championed in the Advancing GETs Act, but it isn't yet a rule, so the core misalignment stands. DOE's GRIP program has funded grid-enhancing deployments, and by early 2026, 16 states had some form of advanced transmission technology requirement, with Colorado adding its Grid Optimization Act in April 2026.
The newest pressure is coming from the demand side. Through 2025–26, FERC began overhauling how large loads connect to the grid, and while none of it touches the utility's return on capital, it changes who sees the costs. FERC issued show-cause orders directing all six grid operators to justify or reform their large-load rules. This tees up consideration of alternative transmission technologies in study processes and greater transparency into costs.
And the rules are moving toward making the large load pay for the upgrades its connection requires. Pennsylvania's model large-load tariff, for example, recommends utilities charge data centers for the upgrades their interconnection makes necessary. It also instructs utilities to let those customers self-construct certain upgrades, including some affecting the wider grid. That combination is what matters. The party paying the bill now has a reason to ask whether a cheaper fix exists and, in at least one state, a route to build it. We have not yet seen a DLR deployment selected this way, because these frameworks are only months old, but the cost gap between a DLR fix and a rebuild is becoming visible to the party who pays the difference.
How Relae Helps Find the Value of DLR
Through our Power, Data, and Innovation practice, Relae combines transmission congestion data, line-level thermal constraints, and short-term weather forecasts into a single view of where dynamic ratings would actually pay. The output is a short list of candidate lines, each with a modeled capacity uplift and an estimated dollar value, turning a vague “DLR is promising” into a priced, line-by-line decision. It is the transmission-side complement to our work on the interconnection queue and demand-side flexibility. All three are ways of closing the gap between demand and delivered capacity faster than new construction allows.