



The Relae Blog
Original insights from the Relae team on the forces reshaping power systems, GHG emissions, environmental markets, nature, and the capital and policies behind them.
How to Fix Load Forecasting for the AI Era
Key Takeaways
- Accurate load forecasting is needed to distinguish and prioritize real demand, align capital deployment, and reduce delays in bringing new power capacity online. Traditional load forecasting was built for predictable, gradual demand growth, not for the scale, uncertainty, and dynamic behavior of data centers.
- The system-level fix to data-center load forecasting requires probabilistic, more frequent, category-specific methods paired with mandatory data standards and policy alignment. Together, these give planners visibility into the range of possible futures and the likelihood of each.
- Without that fix, today's forecasts conflate real demand with speculative submissions, reducing accuracy. Inaccurate forecasting in either direction is expensive: underbuild adds friction to economic development; overbuild risks raising retail rates. Both can erode public trust in planning.
- Behind-the-meter generation (BTM) and load flexibility can help achieve speed-to-power in the near term. Just 1% data-center flexibility could unlock 100 GW—more than the entire US nuclear fleet.
Load Growth Is Increasing, Uncertain, and Concentrated
For two decades, US electricity demand was flat. Utilities, transmission planners, and corporate buyers built their planning models around that reality. Then AI workloads changed it.
AI load growth is large, uncertain, and concentrated in major power markets. While load forecasting projections vary across studies, the trajectory is clear: electricity demand is scaling faster than the bulk power grid was designed to handle. Accurate load forecasting is needed to distinguish and prioritize real demand, align capital deployment, and reduce delays in bringing new power capacity online.
On April 30, 2026, Relae (formerly Carbon Direct) hosted a Trellis Group panel on load forecasting in the AI era. Panelists included Derya Eryilmaz, PhD, Vice President of Power Commercialization at Relae; John Miller, Director of Transmission Policy at the Corporate Energy Buyers Association (CEBA); Daniel Padilla, Strategy and Business Development Lead at Emerald AI; and Sam Hodas, Head of US Government Affairs at National Grid. Jake Mitchell, Director of Climate Tech Innovation at Trellis Group, moderated.
The conversation explored where load forecasts fail, what they cost, how to fix them, and near-term solutions to overcome grid constraints. Here is what the panel found.
What Is Load Forecasting?
Load forecasting is the practice of predicting how much electricity will be consumed across a region, at what times, and under what conditions. It informs the major capital and procurement decisions on the grid: where to build transmission, how much generation to procure, what capacity to bid into wholesale markets, and how corporate buyers secure clean, firm power.
Long-term forecasts inform multi-year decisions about transmission and generation. Short-term operational forecasts inform real-time grid operations and trading. The two often sit in separate workflows, but short-term operational forecasts should feed into long-term system planning to improve accuracy as demand patterns shift.
The Bulk Power Grid Is Under Strain
Large power users face constraints on clean, firm power, transmission capacity, multi-year interconnection queues, and aging infrastructure. The strain is most acute in PJM Interconnection (PJM) and the Electric Reliability Council of Texas (ERCOT), the two US markets expected to see the most significant load growth. Each constraint raises the cost of getting load forecasts wrong.
Hodas from National Grid describes the operational reality on the utility side: aging infrastructure inherited from a different demand era. “We’ve got transmission lines that are 70 to 100 years old in New York and Massachusetts, some of the oldest in the country, still in operation.” Replacing or upgrading that infrastructure requires investment, and ratepayers are already pressed.
Why Today’s Load Forecasts Fail
Traditional load forecasting was built for predictable, gradual demand growth, not for the scale, uncertainty, and dynamic behavior of data centers.
Most utilities and Independent System Operators (ISOs) produce load forecasts on annual or biannual cycles. They aggregate submissions from individual customers, run that data through a deterministic single-peak load estimate against a single capacity scenario, and pass the consolidated forecast up to regional planners. Regional Transmission Organizations (RTOs) roll those bottom-up utility forecasts into a regional view.
This worked when demand was flat and predictable. It no longer works with nonlinear growth driven by data centers. Eryilmaz from Relae identifies key structural limitations.
Four Structural Limitations to Traditional Forecasting Methods
- Over-stating and double-counting. Data centers bid into multiple regions while shopping for power, inflating regional forecasts and blurring the line between real and hypothetical demand—the speculative-load problem.
- Deterministic models (vs probabilistic models). Most planning runs a single peak load estimate against a single capacity scenario, missing the geographic concentration and uncertainty inherent in integrating large loads into the system.
- Aggregated submissions. Utilities report large loads as a single block of gigawatts, with no resolution into workload type, ramp schedule, or operational shape. Planners reverse-engineer peak-demand assumptions rather than measure them.
- Infrequent cadence. Annual or biannual forecasts cannot catch an 80% queue reduction or a multi-gigawatt addition between cycles.
The Speculative-Load Problem
The core challenge in load forecasting is distinguishing real versus hypothetical load. While data center electricity demand is projected to grow by 13-27% annually through 2028, the majority of the projects in the data center queue may not materialize, inflating regional load forecasts.
American Electric Power's Ohio utility (AEP Ohio) introduced a tariff requiring data centers to put up firm financial commitments before getting in line for grid connection. Its interconnection queue dropped from 30 gigawatts to 5.6 gigawatts. More than 80% of the submitted load was speculative: projects that disappeared once commitment became required.
ERCOT shows the same overstatement problem on a larger scale. Roughly 225 gigawatts of data center demand sits in the ERCOT queue against a historic system peak of 85 gigawatts. Texas Senate Bill 6 introduced similar financial obligations for new loads, but those rules apply only to interconnections after 2025, and the cleanup of speculative demand has not yet materialized.
The speculative-load problem shows up in interconnection times. An average new project in PJM can wait 4 to 5 years to become operational. Some of that delay is a real backlog. The rest comes from the inability to distinguish real submissions from speculative ones.
As Eryilmaz puts it, “Load forecasting is actually the center of all of these problems. It is a tool to help planners make the right investment decisions.”
The Cost of Inaccurate Forecasting
As Miller from CEBA notes, “A single misforecasted project can swing a transmission plan by hundreds of megawatts.” Significant inaccuracies can erode public trust in the planning process in two main ways. Underbuilding adds friction to economic development and can limit corporate access to clean power markets. Conversely, overbuilding risks raising retail rates if capacity remains underutilized.
The goal is to achieve right-sized infrastructure investment. When planning aligns with actual large load growth, it can be net beneficial to retail rates. By spreading fixed costs across more usage, significant new demand can put downward pressure on the rates via the “denominator effect.”
On the other hand, forecasting variability can distort capacity procurement and interconnection queue prioritization. When load forecasts spike upward, grid operators like PJM have to scramble to buy additional electricity capacity on short notice. These emergency procurements lock in major dollar commitments on the basis of unstable forecast numbers.
PJM, Midcontinent Independent System Operator (MISO), and Southwest Power Pool (SPP) have also reshaped their interconnection queues to make room for new large loads, but those queue priorities depend on the same forecasts that are unreliable in the first place.
“There is no substitute for good backbone regional transmission planning,” Miller says. “Full stop. That is the enabler of all of the load growth that we’re talking about.”
BTM Generation and Load Flexibility: A Near-Term Bridge
Hyperscalers’ need for power is way faster than that of utilities and RTOs. Generation alone cannot scale fast enough to meet this new demand, and hyperscalers need speed-to-power.
As Eryilmaz frames it, behind-the-meter generation and load flexibility are interim solutions to the timing mismatch between data center urgency and the grid's slower build cycles. BTM generation and flexibility work differently:
- BTM is power generated on the data center's side of the utility meter, bypassing grid interconnection entirely. The structure gives operators large, reliable blocks of power without waiting years for grid approval.
- Load flexibility is the demand-side approach. A data center modifies its grid draw in response to grid signals. In practice, that can mean curtailing compute workloads during stress events, pre-cooling facilities ahead of a heat wave, drawing from on-site batteries or generators, or shifting workloads to data centers in less-constrained regions.
The Value of Load Flexibility
Relae’s power system modeling quantifies the dollar value of load flexibility in ERCOT. Load flexibility can eliminate forced load shedding risk, even at 40 gigawatts of data center buildout, preventing $5.5 billion in annual consumer welfare losses by curtailing an average of 5% of demand for under 1% of operating hours.
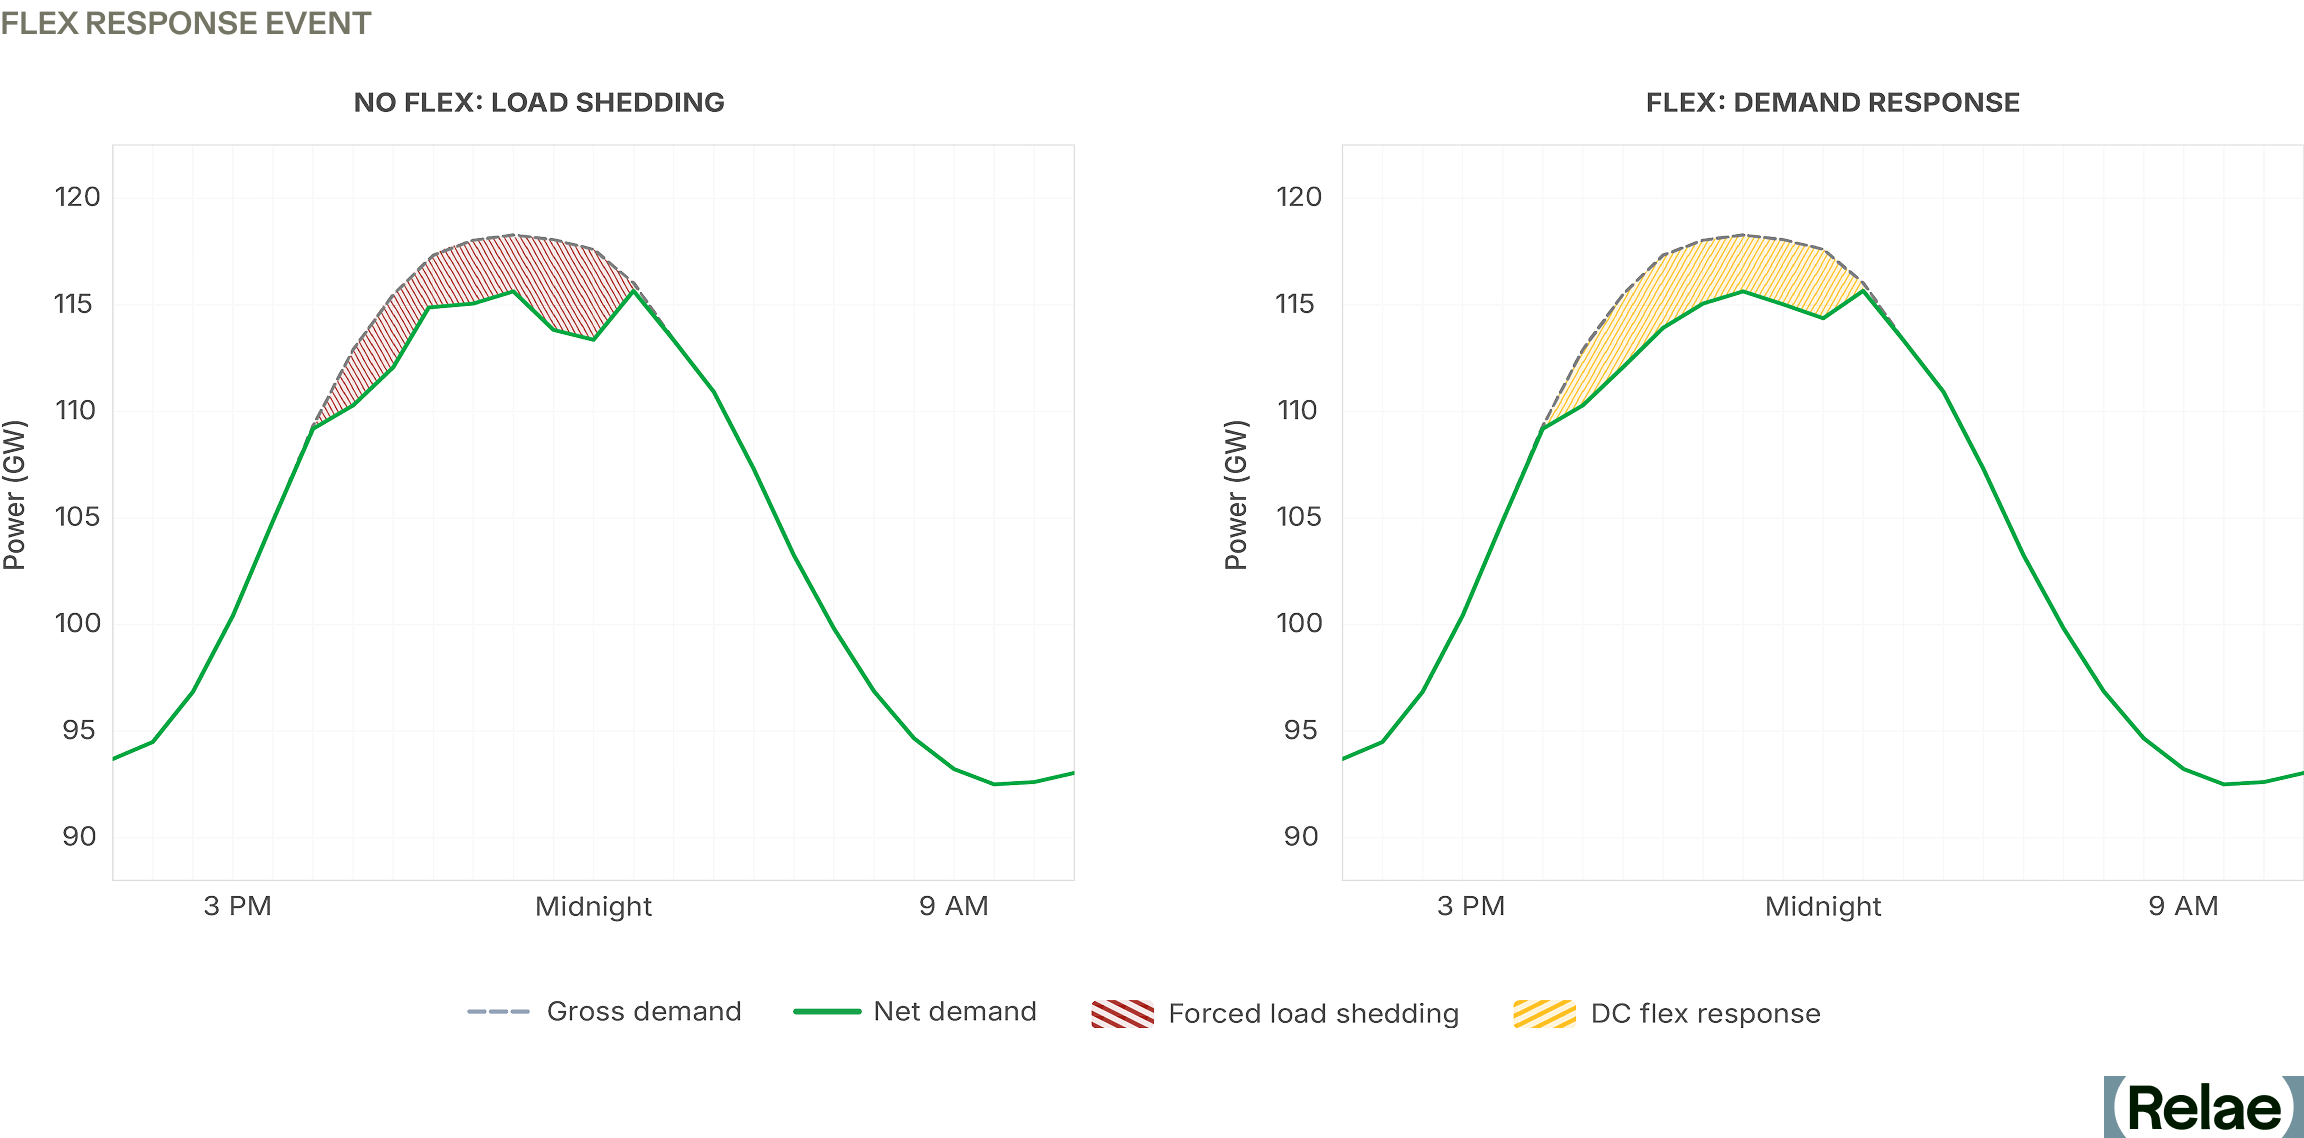
Padilla from Emerald AI reinforces the scale and value of load flexibility: “With just 1% flexibility, we can unlock 100 gigawatts of data centers across the US. That’s more than the entire US nuclear fleet.”
Silicon Valley Power, a municipal utility, is the first US utility to tie flexibility to interconnection speed: flexible data centers get connected faster. NVIDIA, EPRI, Digital Realty, and PJM are partnering on the Aurora AI Factory, the first purpose-built reference design for flexible AI data centers.
But standardized policy for load flexibility is lagging. Padilla highlights this challenge: “Today, if a data center wants to be flexible, they have nowhere to point. We need standardized tariffs, interconnection rules, and product definitions for large loads that reward them with upsizing interconnection in response to flexibility.”
Flexibility Takes Many Forms, but it Isn't Universal
Flexibility means accepting brief, predictable downtime, and some workloads can't tolerate it. Hospital systems and mission-critical enterprise applications need 99.999% uptime, the "five nines" standard. As Padilla puts it: "99.9% uptime, with brief and predictable curtailments, is plenty" for most AI workloads. That distinction determines which data centers can participate in flexibility programs.
Miller points out that compute-level flexibility is not always feasible. BTM batteries and virtual power plants (VPPs) are among the alternatives that can offset what data centers withdraw when the grid is stressed, even at facilities whose compute workloads cannot pause directly.
Better Load Forecasting: The Longer-Term Fix
While BTM generation and load flexibility can help address near-term speed-to-power, the longer-term fix is improving load forecasting methods and the standardization of data provided by the data centers themselves.
Eryilmaz outlines three technical shifts for better load forecasting:
- Embed short-term operational forecasting into long-term planning. Short-term spikes, weather risk, and reserve considerations carry direct implications for multi-year capital decisions. The line between operations and planning breaks down when growth is nonlinear.
- Replace deterministic models with probabilistic methods. Risk metrics like loss of load hours (expected hours per year that demand exceeds supply) and expected unserved energy (total expected energy shortfall) measure both how much capacity the system has and the conditions under which it might fall short. The North American Electric Reliability Corporation (NERC) has suggested both metrics as part of its reliability framework.
- Forecast load by category. Treating all data center load as a single block hides the differences in load profiles, operational schedules, and ramp-up timing that drive system planning.
Policy Alignment
Technical forecasting improvements only scale with policy alignment, and Miller proposes a two-part fix:
On the top-down side, RTOs need authority to take an independent view of utility-submitted forecasts. They should require milestones, such as firm financial commitments and secured financing, before counting a submitted load against the regional forecast.
On the bottom-up side, state regulators set the rules that govern how individual utilities prepare their forecasts. Large load tariffs play a big role in how utility-level forecasts come together. Federal and state authorities need to row in the same direction. Hodas frames the same alignment from the utility side: “Grid investment unlocks economic growth, but for us to make those investments, we need regulatory certainty.”
Standardizing Large-Load Data
The Federal Energy Regulatory Commission (FERC) has since moved: in June 2026 it issued show cause orders directing six RTOs and ISOs—CAISO, ISO-NE, MISO, NYISO, PJM, and SPP—to revise or justify their large-load interconnection rules, and in July 2026 it directed NERC to develop computational-load reliability standards and registration criteria by the end of the year. Both are useful first steps. But as Eryilmaz argues, voluntary disclosure has not closed the gap.
The industry cannot meaningfully compare ISO forecasts when each utility submits load data in different shapes (e.g., using different methods and data standards) on different schedules. Mandatory submission requirements and published methodologies, applied consistently across utilities, ISOs, and state regulators, are the only path to forecasts whose components are actually comparable.
Getting Load Forecasting Right Starts Now
The system-level fix to improving forecasting is through probabilistic, category-specific methods paired with data standardization and policy support. Together, these account for the scale, uncertainty, and dynamic behavior of data center loads, and give planners visibility into the range of possible futures and the likelihood of each.
All forecasts will be wrong to some degree, but as Miller puts it, “It's ultimately not about having a perfect prediction. It's about baking in methods to account for uncertainty.” These system-level improvements won't eliminate errors entirely, but they will minimize them, leading to more confident investment decisions and a grid better prepared for what's ahead.
Frequently Asked Questions
What is load forecasting, and why is it harder now with AI data center loads?
Load forecasting predicts how much electricity a region will consume, when, and under what conditions—the basis for where to build transmission, how much generation to procure, and how corporate buyers secure clean, firm power. It was designed for two decades of flat, gradual demand growth. Data center load is none of those things: it is large, geographically concentrated, arrives in gigawatt blocks with no disclosed operating shape, and can be withdrawn as quickly as it appeared.
What is speculative load in an interconnection queue, and how do planners tell it apart from real demand?
Speculative load is capacity requested by projects that may never be built — often the same data center bidding into several regions at once while shopping for power, which counts the same gigawatts more than once. The tested filter is a financial commitment: when AEP Ohio required firm commitments before queue entry, the utility's reported data center pipeline fell from about 30 GW to roughly 5.7 GW. Milestone requirements, independent RTO review of utility submissions, and mandatory data standards are the tools planners have.
Is load flexibility proven and scalable today, or still emerging?
The modeling case for load flexibility is strong; the commercial case is still early. Duke's Nicholas Institute found the 22 largest US balancing authority areas could absorb roughly 76–126 GW of new load if it accepts modest curtailment, and Relae's ERCOT modeling shows demand response eliminating forced load shedding risk at 40 GW of data center buildout, avoiding $5.5 billion in annual consumer welfare losses. What is still missing is the market plumbing—standardized tariffs, interconnection rules, and product definitions—so a data center willing to be flexible has somewhere to sign up.
What should a company look for when evaluating a region's load forecast?
Ask whether the forecast is probabilistic or a single deterministic peak, how often it is refreshed, and whether large loads are broken out by category and operating shape rather than reported as one block of gigawatts. Then ask what milestone or financial commitment a project must clear before its megawatts count toward the forecast. A forecast that cannot answer those three questions cannot tell you how much of the queue ahead of you is real.
[cta]
Top Questions on FERC's Co-Location Compliance Order for PJM, Answered
Key Takeaways
- On April 16, 2026, two weeks before the Department of Energy’s (DOE) April 30 deadline for action on the Large Load Proceeding, FERC, the Federal Energy Regulatory Commission, provided a significant update:
- FERC issued its compliance order on PJM's Bring Your Own Generation (BYOG) tariff; the order approved four interconnection paths, rejected two PJM proposals, and directed PJM to refile by May 18.
- FERC's June 2026 order settled a key question around enforcement mechanisms for co-located projects. FERC rejected PJM's Two-Strike proposal (which would have terminated contracts on second violation), allowing only penalties and suspension from the three new transmission services, materially reducing developer downside risk.
- Notably, BYOG arrangements built on the rejected elements of the compliance filing face restructuring risk before that refile. For deals that clear it, however, energization could begin as early as this summer.
- These proceedings reflect the underlying industry concerns about speed, reliability, and cost equity, shifting the risks and costs of new generation from ratepayers to the large loads, such as data centers, themselves.
- Developers, investors, and project teams can use quantitative grid and load modeling to navigate these risks successfully, converting regulatory exposure into priced engineering decisions.
A New Rulebook for Bring Your Own Generation in PJM
PJM Interconnection (PJM) hosts the highest concentration of data center load growth in the US, managing regional transmission across 13 states in the Eastern US, and commercial operation dates for new generation projects in its current interconnection queue stretch into the early 2030s. Bring Your Own Generation (BYOG) has become the fastest speed-to-power path around that bottleneck.
BYOG allows large loads, such as data centers, to draw power directly from a co-located generation source connected to the bulk power grid, enabling developers to avoid lengthy interconnection queues and costly transmission upgrades, while drawing limited to no power from the bulk power grid.
The Federal Energy Regulatory Commission’s (FERC) April 16 order is now the rulebook that governs the tariffs that facilitate these BYOG arrangements. Any deal built on the paths FERC closed off must now find a way to align with one of the four approved mechanics before PJM's May 18 compliance refile. Deals that clear the refile could begin to energize as early as this summer.
Below are the top questions the Relae power advisory team is fielding most from hyperscalers, large commercial power buyers, and power producers navigating the mechanics of PJM’s BYOG tariff and the engineering realities of running a co-located project.
What Is Co-Location?
Co-location refers to a power generation facility sited in close proximity to a large load, such as a data center, that interconnects directly to the bulk power grid. The generator serves that load contractually via a power purchase agreement (PPA), with power flowing through the meter.
BYOG is the predominant co-location model in PJM. Under a typical BYOG arrangement, on-site generation covers the majority of the data center's load (~90%), with only a small residual portion (~10%) supplied from the grid. Each co-located project effectively functions as its own mini-grid, with explicit operational obligations that are less forgiving than standard transmission service (NITS).
Why Did FERC Keep Behind-the-Meter (BTM) and Co-Location Separate?
While BTM and co-location may look similar, they sit in different regulatory buckets. That said, the line between them is less clear-cut than it once was. FERC found existing BTM rules inadequate to address the grid impacts of large co-located loads and directed PJM to treat co-location as a distinct framework.
At the same time, BTM rules, including how tariffs and distribution charges are applied, remain under revision in a separate PJM proceeding. The two tracks moving in parallel have contributed to the conflation of the frameworks in industry discussion.
How Does Co-Location Differ from BTM Generation?
- Co-location, as this order defines it, is a bulk grid-interconnected arrangement. The host generator remains on the same interstate grid, maintains its interconnection service agreement, and continues exporting power to the grid. The co-located load connects through an approved interconnection mechanic and takes transmission service under a PJM tariff product.
- BTM is a distinct arrangement. The generator sits on the consumer's side of the utility meter and serves the load through a private line, without an interconnection agreement. The load may typically have a grid connection; however, in some circumstances, the generation may be fully off-grid or islanded. By setting a megawatt (MW) threshold for BTM, larger loads with co-located generation may no longer net out their load to reduce transmission and grid charges. FERC's jurisdiction over a BTM arrangement is narrower, and the tariff mechanics that apply to co-location do not apply in the same way.
FERC's rejection of PJM's proposed BTM rule changes illustrates this distinction. The commission is keeping the two categories separate on purpose. Ultimately, FERC’s intention seems to signal that large loads co-located with generation may not be adequately reflected in grid and transmission upgrade costs when these assets are behind the meter. Historically, BTM assets were exempt from these costs because their relatively insignificant power contributions had no meaningful financial impact on the bulk power grid.
That said, the BTM track is still moving. PJM's BTM application rules, including the netting-off mechanism that lets BTM loads avoid utility tariffs, remain under review in parallel proceedings.
For developers, regulatory clarity on co-location and BTM is increasingly critical. In April 2025, FERC upheld its rejection of the Talen-Amazon Susquehanna nuclear BTM interconnection agreement proposal, declining to rehear arguments on the initial decision. To many experts, the split ruling signaled that the structure of PJM’s interconnection service agreement (ISA) is inadequate for large loads operating behind the meter.
However, in the initial challenge to the Talen-Amazon proposal, utility companies argued that the arrangement would unjustifiably shift transmission costs to other PJM customers. Ultimately, in June 2025, Talen Energy entered into a 1,920 MW, front-of-the-meter power purchase agreement with Amazon Web Services, which does not require FERC’s approval.
FERC Has Always Regulated Generators, Not Loads. What Changed?
The April 16 order lands inside a larger jurisdictional shift. FERC does not typically regulate load interconnection; its authority sits with the bulk power grid. Under Orders 888 and 2003, FERC has regulated how generators connect to that system (with standardized study deposits, readiness requirements, and withdrawal penalties) while load interconnection has historically been regulated at the distribution level under state jurisdiction.
That generation-only approach to FERC regulation worked for three decades. Now, the scale of AI data centers and other large loads creates interstate impacts that state-level load regulation cannot fully address. Generation co-location breaks the pattern by routing the load through a FERC-regulated generator interconnection agreement rather than a state-regulated load-serving entity, pulling it into federal jurisdiction.
In December 2025, FERC declared PJM's existing interconnection rules (tariff) unjust and unreasonable in the PJM Co-Location Order and directed PJM to revise the tariff. The April 16 order is FERC's review of that rewrite.
As FERC Commissioner David Rosner wrote in his concurrence to the December 2025 PJM Co-Location Order: "We are trying to meet surging demand while upholding two fundamental values that underpin the electric industry in our country: first, that all customers have a right to receive electric service on a timely basis, and second, that electric service should be reliable and affordable for all customers. Given the scale of new large loads putting demand on our grid today, it is clear that fostering both of these values requires intervention."
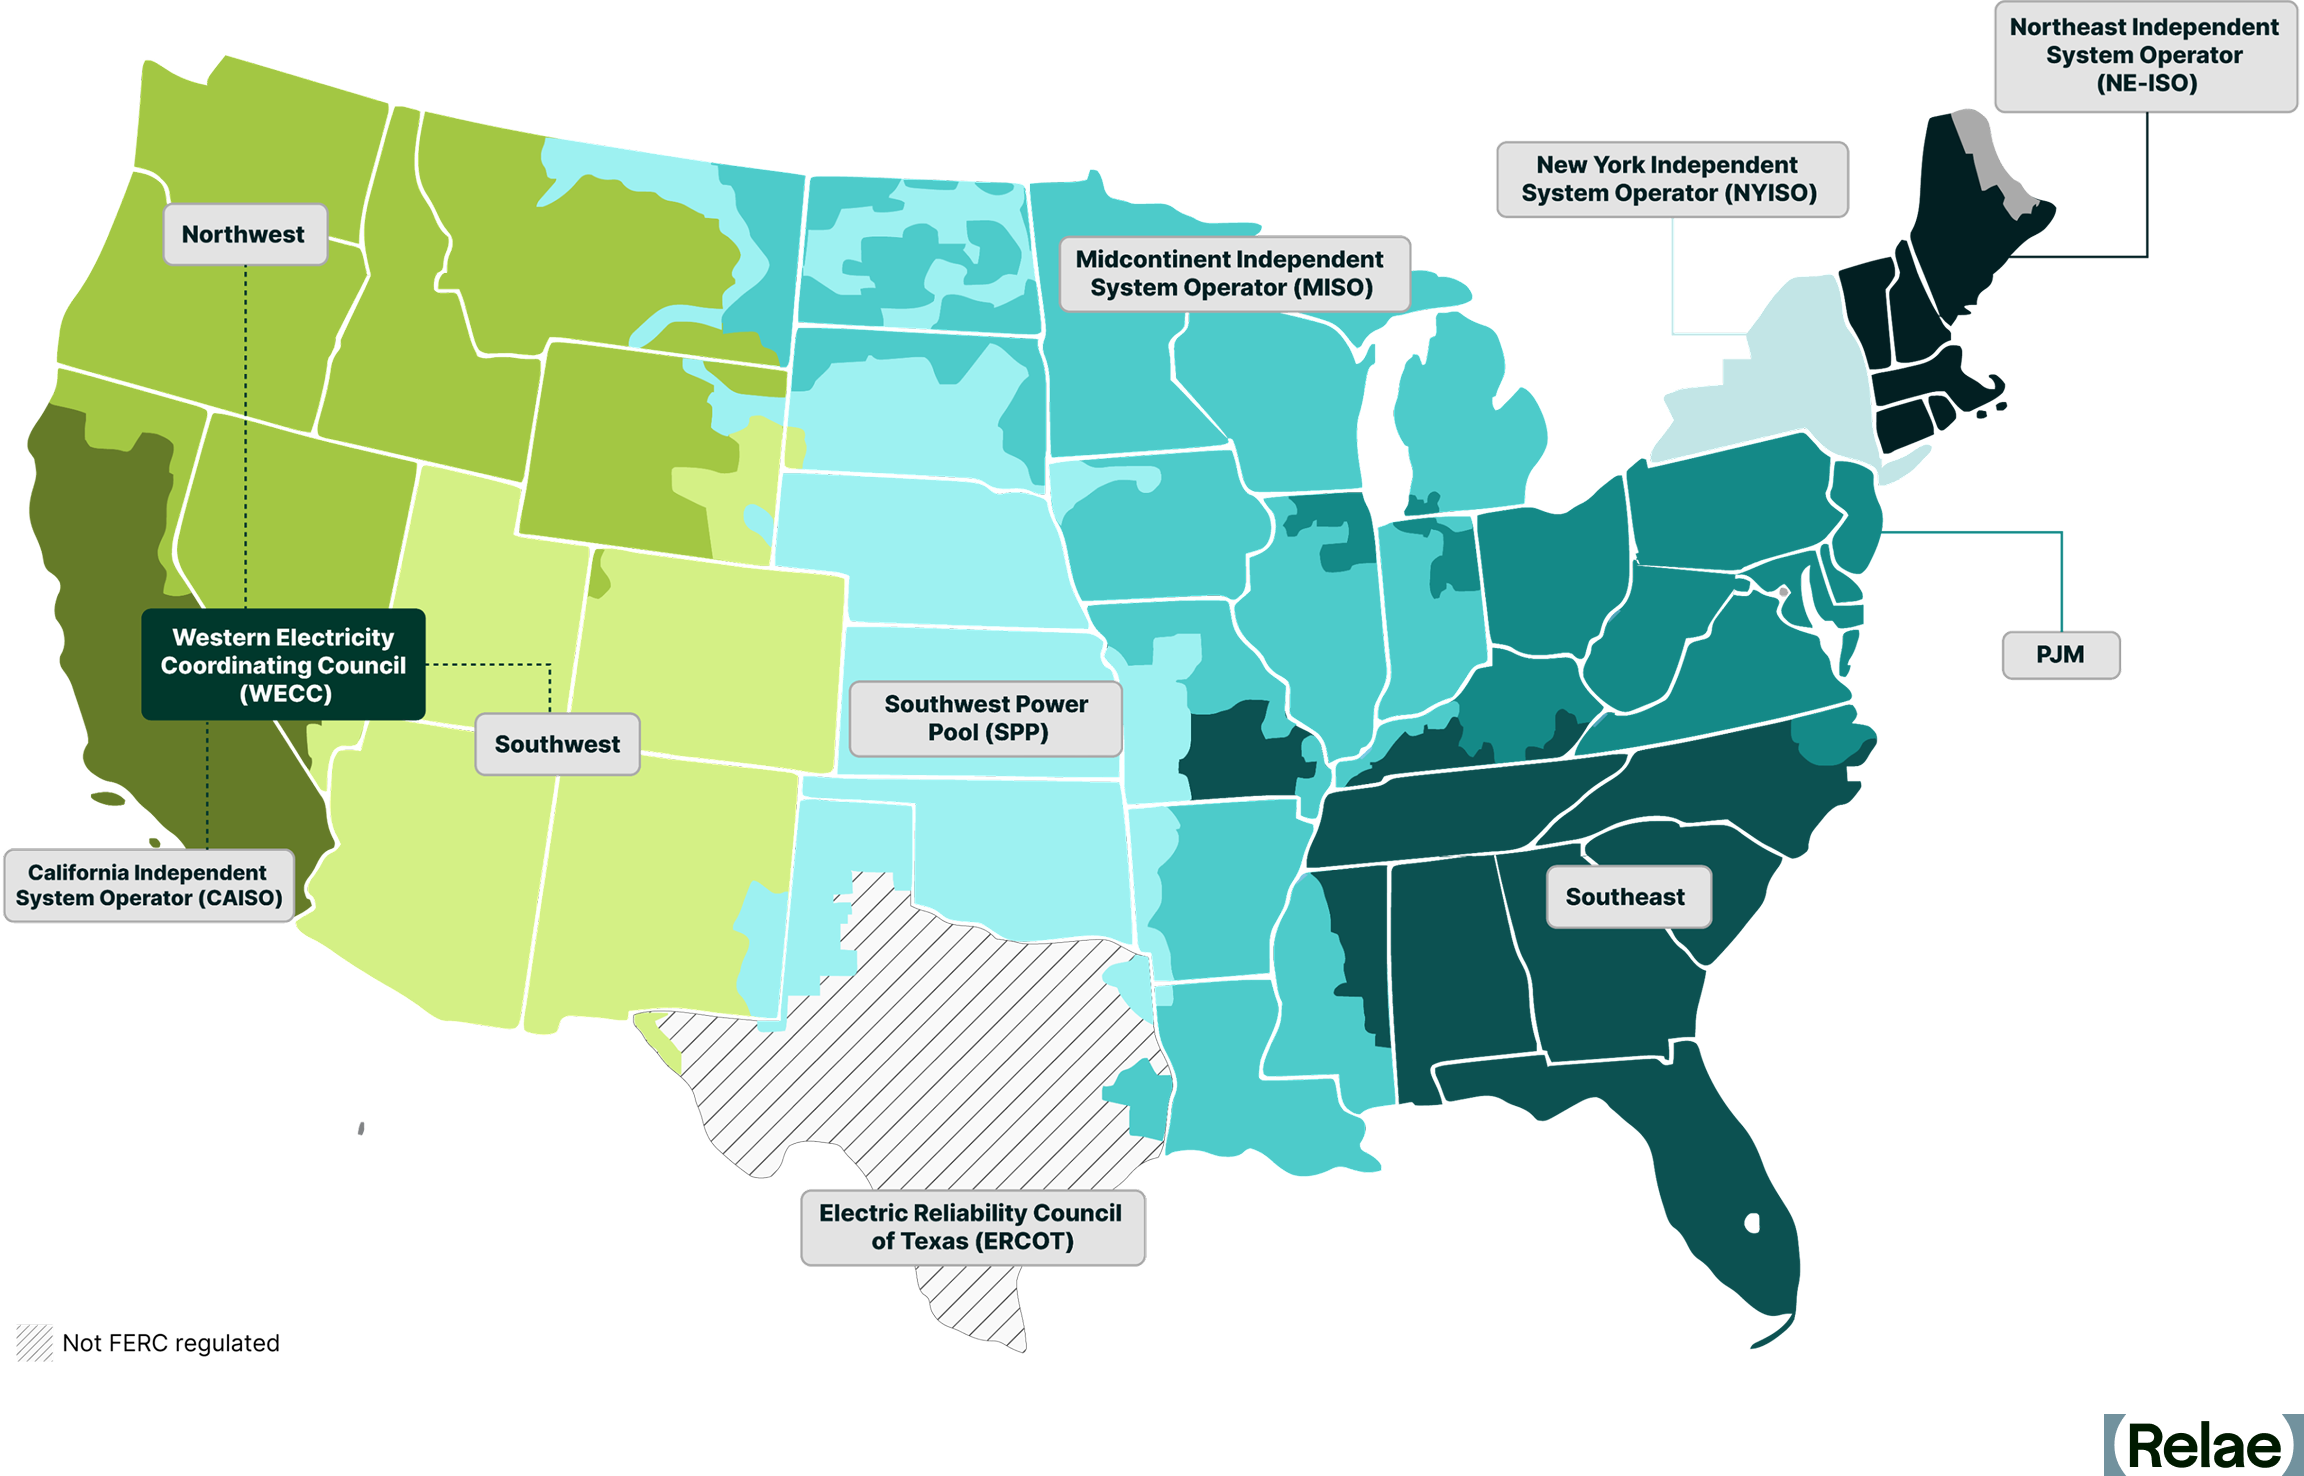
Which Four Interconnection Mechanics Did FERC Approve?
The April 16 order (Docket ER26-1088-000, 195 FERC ¶ 61,030) approves four ways for a data center to plug into the PJM grid. Each solves a different bottleneck: available capacity, queue position, study timing, or pre-studied capacity. All four rely on existing PJM and FERC tariff mechanics rather than new constructs, a deliberate choice to reduce legal exposure and speed up adoption.
- Sub-full-capacity interconnection service (available capacity). The data center co-locates with an existing host generator, and interconnects at less than the host generator's full capacity, using the portion of the existing interconnection rights the generator does not need.
- Request acceleration at Decision Points I and II (queue position). Co-located load applications can move ahead of the standard queue at defined checkpoints, subject to PJM's study results. Co-located loads place less demand on the bulk power grid than new large loads without co-located generation, justifying the accelerated treatment. To qualify, projects must demonstrate there will be no significant network updates required or network impact, among other readiness milestones.
- Provisional Interconnection Service, or PIS (study timing). Interim interconnection services are provided during the full study, giving developers a bridge to early operations.
- Surplus Interconnection Service, or SIS (pre-studied capacity). Use of unused capacity at an already-studied generator’s interconnection point, without triggering a new full study.
The four mechanics are different ways of answering the same operational question—how a co-located data center plugs into the grid without triggering a multi-year re-study of the host generator's interconnection—enabling faster speed-to-power.
Which Generators Gain Most From Surplus Interconnection Service?
SIS is the most commercially interesting of the four mechanics for existing generator owners because it monetizes previously stranded capacity.
The generators that benefit most include:
- Retiring or derated thermal units with unused megawatts of interconnection rights at high-value points (for example, retiring coal plants in PJM's eastern and mid-Atlantic footprint).
- Existing nuclear and large thermal plants near concentrated load growth, particularly in Dominion, American Electric Power (AEP), and ComEd territory (the Northern Virginia, Columbus, and Chicago metro zones), where PJM load is most concentrated.
- Storage-paired assets where the underlying generator has capacity headroom that the storage does not fully use (for example, solar-plus-storage or gas-plus-storage sites where the battery sits below the full interconnection rights).
For illustration, a host generator running at roughly 85% of its interconnection rights with a forced outage rate near 5% has material surplus capacity (10%) available to a co-located load, depending on how PJM studies the combined profile.
Owners of underutilized interconnection rights now have an approved tariff path to extract value from them by attracting data centers to co-locate with these generators.
What Transmission Service Does a Co-Located Load Receive?
Connecting to the bulk power grid and taking service from it are two separate decisions. PJM's default transmission service for any load on the system is the Network Integration Transmission Service (NITS), the standard contract for firm power year-round. NITS commits PJM to serve a customer’s full load at any and all times, meaning that PJM may need to wait for generation and/or transmission upgrades before offering it to a large load.
Recently, PJM reopened its generation interconnection queue after pausing to study its backlog of proposed projects. With 800 proposed projects representing approximately 220 GW in new capacity in 2026, this growth signals progress, but it does not address the underlying permitting and financing challenges that have prevented projects already in the queue from being built.
The BYOG mechanics are variations that waive or defer parts of NITS for faster speed-to-power. PJM delivers the resulting service through three tariff product types:
- Firm contract demand: The co-located load holds firm transmission service (consistent with most aspects of NITS) and operates like any other firm load on the system. Availability is site-specific, depending on the point of interconnection. Unlike other NITS customers, entities contracting firm contract demand transmission on behalf of co-located loads cannot exceed the contracted demand level, and loads would be subject to a penalty if they withdraw additional energy beyond the contracted demand capacity.
- Non-firm contract demand: The load accepts interruption risk in exchange for faster interconnection or lower-cost service, making it better suited to loads with operational flexibility. It is available at more interconnection points than firm service, but power delivery is subject to curtailment based on real-time grid conditions. This service intends to provide brief and intermittent energy access from the bulk power grid, during available periods, under unanticipated circumstances, such as downtime for the co-located generator.
- Interim NITS: A bridge product that provides firm service on an interim basis while the co-located generator is still under construction. The load energizes early; once the generator and any transmission upgrades are complete, the project transitions to a standard NITS arrangement, and the generator can participate in the broader PJM market. However, while the load pays the NITS rate, the load is subject to curtailment under system emergency conditions, posing reliability challenges.
In practice, a 1,000 MW data center co-located with a 900 MW on-site generator would request 100 MW from PJM under one of these three products.
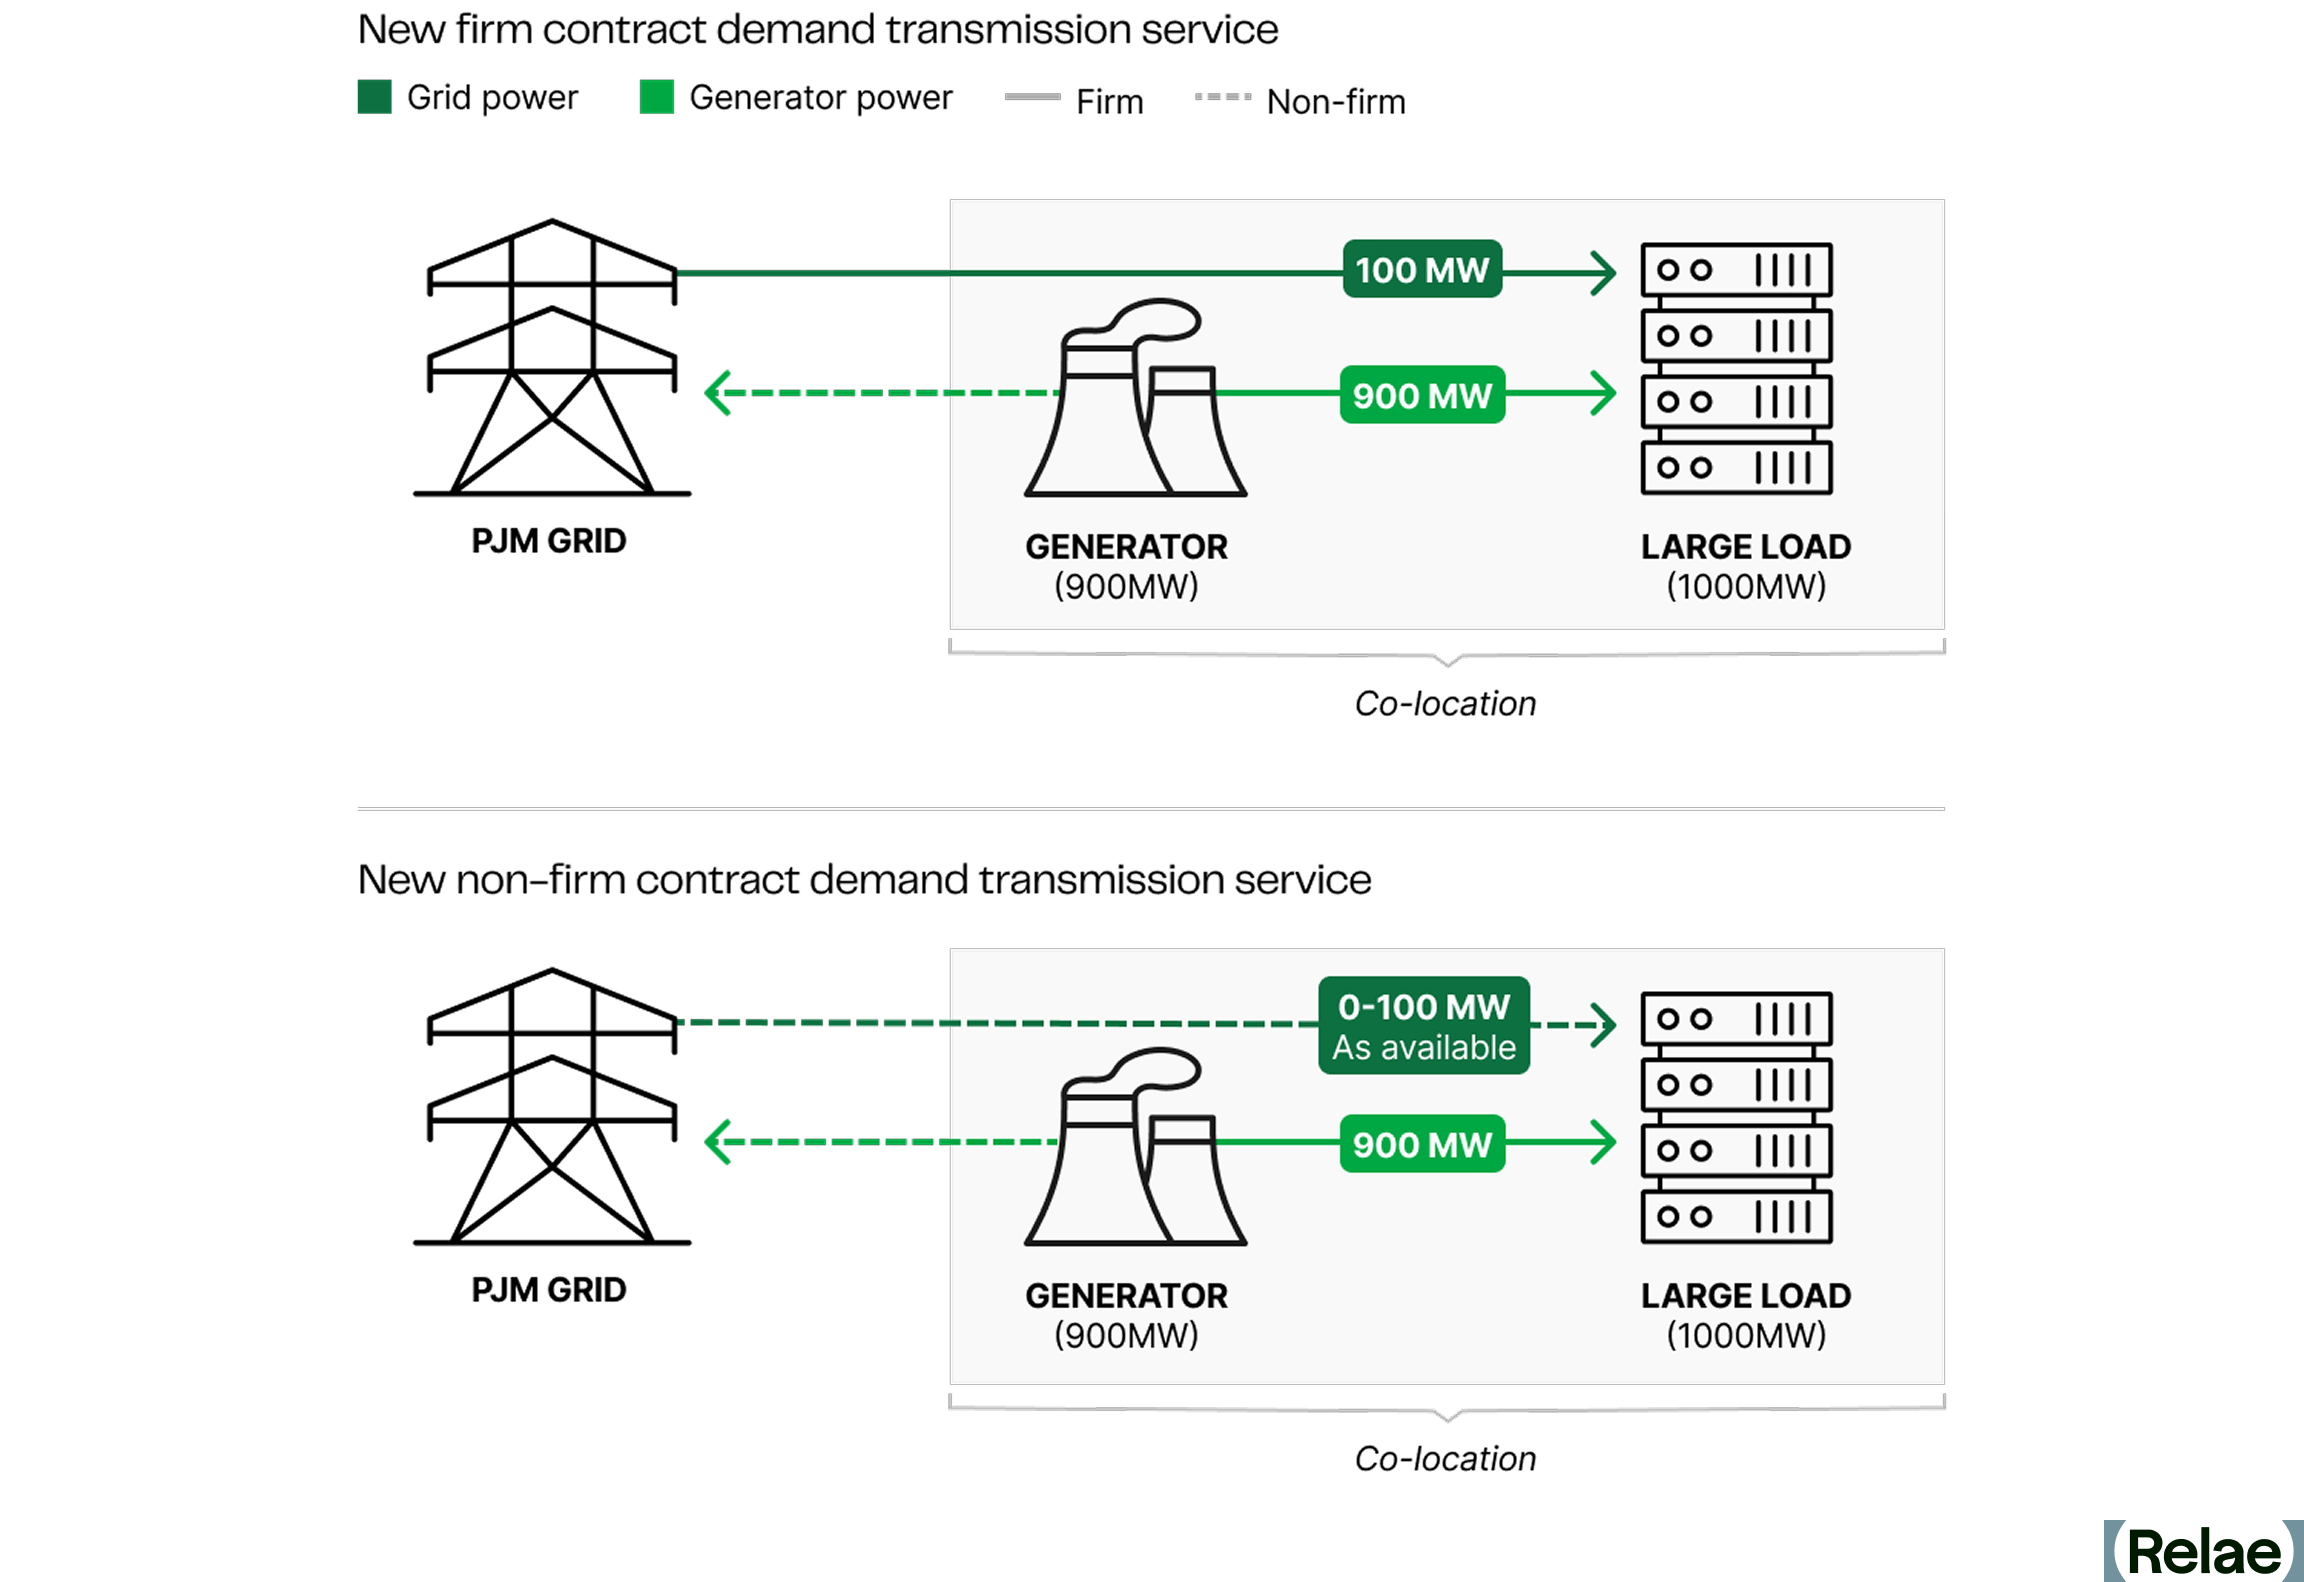
The interconnection mechanic (how the load connects) and the tariff product (what service the load receives) are two distinct decisions. For example, in the case of an interim NITS, a data center and co-located load could connect through a Provisional Interconnection Service (PIS). Other co-located loads may connect by submitting a request for acceleration at Decision Points I and II to secure firm contract demand service. The connection mechanism and tariff will vary based on each co-located load’s unique characteristics and project configuration.
For clients evaluating specific sites, the right path depends on how much of the host generator's interconnection capacity is available, how sensitive the load is to interruption, and how fast the site needs to energize. Grid modeling allows project teams to quantitatively assess their risk exposure before committing to a tariff product.
Which Two PJM Proposals Did FERC Reject?
Two elements of PJM's original filing did not make it through the April 16 order.
- Point of Change in Ownership substitution: PJM proposed swapping in "Point of Change in Ownership" for FERC’s mandated term "Point of Interconnection" in the definition of Co-Located Load. FERC rejected the swap as an unexplained deviation from the Co-Location Order's definition and because it could let transmission owners delay or effectively veto the Point of Change in Ownership location, creating uncertainty for co-located projects.
- BTM application-rule changes: PJM tried to fold changes to its BTM application rules into this same compliance package. FERC rejected that on the ground the changes did not fall within the scope of the initial order. BTM remains a separate regulatory track; the April 16 order does not settle it.
Project configurations built on either rejected proposal need restructuring before PJM's May 18 refile.
The order also directs PJM to add the PIS definition to the Open Access Transmission Tariff (OATT), Part I, section 1 (paragraph 26), and flags items in paragraph 29, including assessment of the reliability of co-located loads paired with electric storage, as out of scope.
These determinations should not be seen as FERC rejecting these tariff changes, but rather deeming them outside the scope of the order. They are open questions that belong in a separate docket. The direction to include PIS while declining to address issues not included in the compliance proceeding demonstrates FERC’s focus on speed-to-power, clarifying the rules for new co-located generators to connect to the grid more quickly.
What Is the Two-Strike Reliability Rule, and Why Does it Matter?
The rules for violating a co-location interconnection service agreement are still being developed, but FERC has urged PJM to issue robust protections to maintain reliability and cost allocation equity.
For both firm and non-firm contract demand transmission service, PJM will apply a penalty rate to transmission service customers who withdraw more energy from the grid than was contracted. The precise design of these rates for unreserved use is scheduled for a paper hearing this spring; however, developers should cautiously size and appropriately model load and generation sizes, as the penalties for jeopardizing PJM’s reliability are not limited to rates.
While penalty rate design for unreserved use is underway, PJM proposed a strict Two-Strike reliability rule for co-located projects. If a co-located customer failed to adequately implement automated loadshedding or generator tripping mechanisms during unusual grid conditions, PJM has previewed severe consequences:
- First strike: a 120-day operational pause for review.
- Second strike: termination of the transmission service contract and return to the NITS interconnection waitlist.
The entire purpose of pursuing a co-located large load configuration is to ensure speed-to-power while maintaining reliability. In a June 2026 order, FERC conceded that there are legitimate reliability concerns with co-located generation misoperation; however, PJM’s proposal to disqualify customers with multiple misoperations is unnecessarily strict. FERC ultimately agreed PJM has the authority to charge penalties to and temporarily suspend services for customers that fail to shed load or curtail, but cannot disqualify customers for misoperation. Data centers will need to rigorously model and design their co-located load and generator facilities with the understanding that multiple reliability violations could strand billion-dollar assets for multiple years.
Which BYOG Deals Need Restructuring Before the May 18 Refile?
Any deal built around the Point of Change in Ownership substitution or the BTM application-rule changes that FERC rejected needs restructuring.
In addition, co-located projects that relied on one of the four approved mechanics, but used PJM tariff language from the original December filing, may also need re-papering against the language PJM submits in its forthcoming May 18 compliance filing. Until PJM files that package and FERC accepts it, the operative document is the April 16 order itself.
Counterparties should confirm that operational controls, curtailment rights, and dispute mechanisms in the contract align with the proposed Two-Strike regime and the approved mechanics the project uses.
What Does Grid Modeling Reveal for a Co-Located Project?
Non-firm service is the lowest-cost tariff product for the portion of load the co-located generator does not serve, but availability depends on real-time grid conditions. Grid modeling is how developers size that exposure before signing.
Take the same 1,000 MW data center paired with a 900 MW on-site generator, contracting 100 MW of non-firm service for the residual load. Grid modeling might show non-firm power dropping out in roughly 15% of hours during the summer peak.
If the on-site generator also carries a 5% forced outage rate, the developer faces a meaningful probability of a compound event: grid supply drops out at the same moment the on-site unit trips offline.
In that window, the data center has three options, none of them free:
- Curtail load.
- Shift the load to another site.
- Draw more from the grid than the contract allows, which triggers a Two-Strike violation.
Grid modeling converts that risk into decisions the developer can price. A developer can test whether adding 50 MW of battery storage, contracting 150 MW of firm service instead of 100 MW of non-firm, or adding a smaller backup generator delivers the best risk-adjusted return.
Inside NERC’s Level 3 Alert on Data Center Loads
Key Takeaways
- On May 4, 2026, the North American Electric Reliability Corporation (NERC) issued a rare Level 3 “Essential Actions” Alert in response to repeated events in which 1,000+ megawatts (MW) of computation load dropped off the bulk power system in seconds, leading to major grid stability issues.
- The pattern has since escalated: on July 22, 2026, a transmission fault in Ashburn, Virginia took more than 3 GW of data center load offline in seconds—roughly 3% of PJM demand at the time.
- NERC also published Reliability Guidelines that push the same concerns into long-term planning, explicitly recommending resource adequacy models that capture firm vs. flexible load, behind-the-meter resources, and AI training operating windows.
- For transmission operators and balancing authorities, the releases compel new scrutiny of how computational loads affect stability and resource adequacy. For hyperscalers and other large loads, those assessments now sit on the critical path: if operators cannot show through advanced modeling that they can integrate the new loads, interconnection and buildout plans stall.
- Meeting the bar takes advanced grid modeling at multiple time and spatial scales, from sub-second stability through long-horizon capacity and resource adequacy, to evaluate the role of large load portfolios considering demand response, storage, and co-located generation.
Why Grid Frequency Matters for Large Loads
When we turn on the lights or charge our phones, it’s easy to forget that electricity travels through the power grid as alternating current. Sixty times a second—far faster than our eyes can see—the flow of electricity alternates back and forth along the wires making up both the transmission and distribution parts of the North American grid.
Power generation equipment and most large industrial loads are designed to work with this 60 Hertz (Hz) alternating flow and must be synchronized precisely to this rhythm to function. Grid synchronization is so important that it can even have geopolitical implications.
For some electrical equipment, getting out of sync with the grid’s frequency can lead to malfunctions or even physical damage and destruction. That’s why grid-connected equipment is protected by circuits that automatically disconnect from the grid (“trip offline”) if the grid frequency begins to deviate by even one percent. For minor equipment, this is easily managed. However, when large amounts of generation or load trip offline quickly, it can lead to rapidly cascading grid blackouts affecting tens of millions of people with costs in the billions.
Grid operators pay extremely careful attention to factors that could cause grid frequency to deviate. The grid’s frequency stays near 60 Hz only when total power generation and consumption (load) are closely balanced. If load suddenly drops below generation, physical rotating generators like gas turbines can begin to speed up, making grid frequency rise.
This becomes particularly dangerous when large grid-connected loads all trip offline simultaneously because of minor frequency deviations or other factors. If these loads are large enough, they can trigger a cascading sequence of rising frequency and further equipment and generator trips, potentially causing a complete “grid collapse” blackout. The North American grid may be getting closer to this scenario.
What Triggered NERC’s Highest-Urgency Alert
Data center load drops are now a documented grid stability threat. On May 4, 2026, NERC issued a rare Level 3 “Essential Actions” Alert—its highest-urgency notification—in response to a pattern of customer-initiated load reductions in which 1,000+ MW of computational load (data centers) dropped off the bulk power system (tripped offline) in seconds. These were “customer-initiated” because protection circuits at data centers detected problems with grid-supplied power and automatically disconnected to protect their sensitive computing equipment from electrical damage.
Paired with a new Reliability Guideline on emerging large loads, the alert highlights the urgent need to better understand the potential for these events to cause grid instability or even blackouts. Together, these two documents reset the bar for the detailed grid modeling and planning needed for any utility, independent system operator (ISO), or hyperscaler with material data-center growth in its footprint.
Customer-Initiated Load Reductions
A customer-initiated load reduction (CILR) is an event in which a large load, most often a data center, AI training facility, or crypto miner, abruptly and without warning reduces or disconnects its electricity draw from the grid in response to a frequency or voltage disturbance that the grid’s internal protection circuits interpret as unsafe.
Compute-based loads like AI data centers are particularly sensitive to changes in the expected voltage and frequency from grid-supplied power, and their automated electrical protection systems tend to react more quickly and at smaller deviations than conventional industrial, commercial, and residential loads.
NERC has documented multiple events of 1,000+ MW since 2022, with reductions occurring in seconds, much faster than real-time operators can respond. This makes these events a significant risk to grid frequency stability that is distinct from more traditional load loss events that occur at a smaller scale or over slower timescales, allowing grid operators to take action to compensate.
How the Alert Reshapes Grid Interconnection
For utilities and ISOs, the alert and guideline raise the standard of evidence required to connect computational loads safely to the grid. Modeling assessments now sit on the critical path for large load interconnection decisions, and the same studies will increasingly inform reserve margin, transmission, and dispatch program designs.
For hyperscalers and other large loads, the consequence is direct. Plans that assume firm service without supporting analysis will face longer queues and tougher interconnection conditions. Buildout timelines now depend on whether utilities and ISOs can show, through stability and resource adequacy modeling, that the system can absorb the load and respond safely to its disturbances.
For storage developers, particularly long-duration and fast-responding assets, these events elevate the reliability value of rapid response and load-shifting resources. The same grid modeling improvements that capture flexible load behavior also surface storage's full reliability contribution.
For flexibility platforms, the same modeling work that satisfies NERC's expectations unlocks faster, cheaper interconnection. Demand response, large-load shifting, and co-located dispatch coordination are now both technical and commercial enablers.
A Higher Bar for Power Analysis
These pressures point to a higher bar for power analysis at multiple time and spatial scales, for utilities and the large loads they serve.
At sub-second to second timescales, electromagnetic transient (EMT) models capture fast electrical switching and the uninterruptible power supply behavior that determines whether a data center stays connected during a disturbance (“rides through”). The alert asks for these models to be more detailed, validated against actual equipment, and shared between large loads, transmission owners, and planners.
At seconds-to-minutes, dynamic stability simulation covers system frequency response, voltage recovery, and oscillation behavior after disturbances. NERC now expects annual stability studies and explicit load drop contingencies in planning files.
At hours-to-years, capacity expansion and production cost modeling determine whether the system has enough resources, in the right places, with the right flexibility, to keep up with computational load growth. NERC’s May 2026 Large Loads Reliability Guideline is most explicit at this scale, calling for resource adequacy studies that represent firm and flexible load components, behind-the-meter resources, AI training operating windows, and probabilistic scenarios across many weather, load, and outage combinations on a network-aware footprint.
Rising to the Challenge
Since the alert was issued, its expectations have begun hardening into rules. Registered entities were required to report to NERC on their progress against the seven Essential Actions by August 3, 2026, and on July 16, 2026, FERC directed NERC to go further: to develop mandatory reliability standards for computational loads and revise its registration criteria, with the first standards and Rules of Procedure changes due December 31, 2026 and a second-phase work plan due March 1, 2027. NERC's Large Loads Action Plan anticipates new "Computational Load Owner" and "Computational Load Operator" registered entity types alongside the first three computational load standards.
The practical consequence is that the modeling described above is no longer only good planning practice: utilities, ISOs, hyperscalers, and other large loads should expect the data-sharing, study, and commissioning expectations in the alert to return as auditable requirements, and should build the capability before the compliance deadline rather than after it.
Frequently Asked Questions
What is a NERC Level 3 Alert, and what does it require?
A Level 3 “Essential Actions” Alert is the most urgent of NERC's three alert levels, reserved for risks that need immediate, documented industry response. The May 4, 2026 alert directed registered entities to take seven essential actions on computational load—covering modeling, system studies, commissioning, protection, fault recording, and direct operational communication with large load operators. Written responses were due to NERC by August 3, 2026.
Why do data centers disconnect from the grid during minor disturbances?
Data centers run voltage- and frequency-sensitive computing equipment protected by automatic transfer systems that switch to on-site UPS or backup generation the moment grid power looks abnormal. Those protection settings trip faster, and at smaller deviations, than conventional industrial loads, so a fault lasting milliseconds can move a gigawatt of demand off the system in seconds. Because the shift is customer-initiated, grid operators get no warning and no time to rebalance.
How does the alert change interconnection for hyperscalers and other large loads?
Modeling assessments now sit on the critical path for large load interconnection. A plan that assumes firm service without stability and resource adequacy analysis behind it will face longer queues and tougher interconnection conditions, because the utility or ISO has to be able to show the system can absorb the load and respond safely to its disturbances. In practice, buildout timelines are now tied to someone else's study queue.
What modeling do utilities and large loads need to meet NERC's expectations?
Electromagnetic transient (EMT) models validated against actual equipment for sub-second ride-through behavior; dynamic stability simulation with explicit load-drop contingencies for seconds-to-minutes frequency and voltage response; and capacity expansion and probabilistic resource adequacy modeling that separates firm from flexible load, represents behind-the-meter resources, and reflects AI training operating windows. The paired Reliability Guideline is most explicit about the last of these.
Why Behind-the-Meter Power Emissions Belong in Scope 2
Key Takeaways
- Larger power users are securing behind-the-meter (BTM) power to bypass grid constraints, pairing data centers with third-party-owned generation assets that deliver electricity through a private line rather than the grid.
- BTM power arrangements can create confusion about electricity emissions classification: the power users neither own the generating asset nor purchase electricity from the grid, leading some to misclassify those emissions as scope 3 in their corporate GHG inventories. But the GHG Protocol's Corporate Standard is clear: BTM electricity emissions belong in scope 2.
- Misclassifying BTM emissions can create reputational and regulatory risk. Relae can help organizations get this right before the contract closes.
Why Large Power Users Are Turning to Behind-the-Meter Power
Large power users are consuming more electricity due to data center growth and are looking to add capacity faster than the grid can support, which is having a direct impact on corporate emissions. For example, between 2020 and 2024, Microsoft’s location-based scope 2 emissions rose 130%, and Google’s rose 92%, driven almost entirely by soaring electricity demand from AI infrastructure.
To bypass grid congestion and long interconnection queues, many are turning to behind-the-meter (BTM) power. It’s a pragmatic solution to a real supply problem, but it’s opening an urgent carbon accounting question: when the BTM asset is owned and operated by a third party, where should we account for those emissions?
There has been some confusion that has resulted in companies pursuing an interpretation that would place those emissions in scope 3. The GHG Protocol’s Corporate Standard says otherwise, and the stakes of getting this wrong are high.
What Is Behind-the-Meter Power Generation?
Behind-the-meter refers to electricity generated on the power consumer’s side of the utility meter, bypassing the grid, and typically located on or near the site where the power is consumed.
In most BTM arrangements for a data center, a third-party developer builds and operates a generation asset, such as natural gas, geothermal, or renewable energy, and delivers electricity directly to the facility through a private transmission line. There is no utility meter, no grid connection, and no standard energy invoice.
This structure allows companies to access large, reliable blocks of power without waiting years for grid interconnection approvals. Since the company does not own or operate the generation asset and is not purchasing electricity through a conventional utility relationship, this arrangement has created some uncertainty around how to account for the associated emissions.
Can BTM Electricity Emissions Be Classified As Scope 3?
In this scenario, no. The GHG Protocol's Corporate Standard is unambiguous: BTM electricity emissions belong in scope 2, not scope 3. Yet, some companies have been confused about this classification.
There is broad agreement that since the power users do not own or operate the generating asset, those emissions do not belong in scope 1. Divergence starts when we consider that the company is purchasing BTM power, i.e., not from the grid. Since no electricity is acquired from the grid, some argue that rather than accounting for these emissions in scope 2, they are better placed in scope 3, category 8: emissions from leased assets.
The appeal is obvious for BTM power consumers. Scope 3 emissions face less scrutiny from investors, auditors, and regulators who focus most of their attention on scopes 1 and 2. Classifying BTM emissions as scope 3 would reduce near-term pressure to act. However, the GHG Protocol is unambiguous in its stance.
What the GHG Protocol Actually Says
The GHG Protocol’s Scope 2 Guidance states that “organizations must quantify emissions from the generation of acquired and consumed electricity, steam, heat, or cooling (collectively referred to as ‘electricity’).” The method of delivery, whether grid or BTM, does not change the classification.
If a company consumes electricity from a BTM source, the emissions from generating that electricity belong in scope 2. Section 5.4 of the Scope 2 Guidance addresses BTM power generation directly: “the company with operational or financial control of the energy generation facility reports those emissions in scope 1, following the operational control approach, while the consumer of the energy reports the emissions in scope 2.”
This resolves the question completely. The emissions sit in scope 1 if the company has operational or financial control of the asset, or in scope 2 if a third party controls it.
The GHG Protocol’s Corporate Value Chain (Scope 3) Accounting and Reporting Standard reinforces this conclusion. “Category 8 includes emissions from the operation of assets that are leased by the reporting company in the reporting year and not already included in the reporting company’s scope 1 or scope 2 inventories.”
Because BTM electricity emissions are captured by the Scope 2 Guidance, the scope 3 category 8 does not apply.
Get the Accounting Right Before the Contract Closes
The GHG Protocol is unambiguous: behind-the-meter electricity emissions belong in scope 2 for companies that consume, but do not control the generating asset. This means that BTM contract terms are crucial to determining how the emissions will be classified, since the GHG Protocol assigns scope based on who holds operational or financial control of the generating asset.
Companies that move fast on BTM capacity without understanding this distinction risk locking in a scope 1 or scope 2 obligation they didn't anticipate or building a reporting strategy around a scope 3 interpretation the GHG Protocol doesn't support. This can become a reputational or even a regulatory liability that is far harder to address after the contract is signed.
[cta]
The $5.5 Billion-Dollar Case for Enabling Data Center Load Flexibility
Key Takeaways
- The electricity demand surge is real and accelerating. Just last year, data center load in the US was projected to increase from 25 GW to 120 GW by 2030. Today, Texas’ preliminary long-term load forecast projects over 187 GW of data center load by 2030, more than double today’s total peak demand of approximately 91 GW.
- Flexible loads that respond dynamically to policy signals are becoming a regulatory requirement. Texas Senate Bill 6 (SB6), signed into law in June 2025, is the clearest signal yet. It makes remote curtailment equipment a condition of interconnection for new loads of 75 MW or more, so utilities can disconnect them during declared firm load shed events, and separately creates a voluntary demand response program that those loads can elect to join.
- Relae’s power system modeling puts a dollar value on what data center load flexibility is worth. Our ERCOT analysis shows that data center demand response can eliminate forced load shedding risk, even at 40 GW of data center buildout – preventing $5.5 billion in annual consumer welfare losses by curtailing an average of 5% of demand for under 1% of operating hours.
- Flexible load curtailment and compute uptime do not need to be in conflict. In our modeling, demand response operates as a "ghost battery" at the data center's grid node, absorbing grid stress as a physical battery would. That construct has a direct real-world analog: on-site battery storage lets data centers draw from stored energy during grid stress events rather than curtailing workloads. Technologies such as those demonstrated by Emerald AI have shown 25% load curtailment at cluster scale while preserving compute service quality.
Data Center Electricity Demand is Testing Grid Limits
Electricity demand in the United States is growing at its fastest pace in decades. Leading the surge is a rapid buildout of data centers, driven by the expansion of artificial intelligence. ERCOT, the grid serving most of Texas, is projecting up to 187 GW of new data center load by 2030, against a total peak demand today of approximately 91 GW.
The scale of this shift extends across the country. According to NERC's 2025 Long-Term Reliability Assessment (LTRA), summer peak demand across the US bulk power system is forecast to grow by 224 GW over the next 10 years, 69% above the prior year’s 10-year projection of 132 GW, with data centers as the dominant driver. As previously explored by Relae, data center energy capacity in the US is projected to increase from 25 GW to 120 GW by 2030, characterizing it as the first wave of a longer demand surge that electrification of buildings and transport will reinforce.
Policymakers are responding in real time, and regulatory responses like Texas SB6 are already rewriting the rules for how data centers connect to the grid. The pace of change is fast, but the siting, infrastructure, and interconnection decisions made today will have lasting consequences: they will determine whether data centers are grid assets or grid liabilities, and the financial difference between the two is measured in billions.
New Solutions for Data Center Demand Response: Texas SB6 as a Test Case
The rapid nature of this new wave of load growth means traditional approaches to managing the grid may not be sufficient. In the past, lead times on new sources of electricity demand allowed utilities to procure supply-side resources in advance. The scale and immediacy of data center deployment is revealing limitations of this approach. States, utilities, independent system operators (ISOs), and regulators are actively pursuing novel approaches for grid management in response.
Texas has become a focal point of US data center expansion, with SB6 as a leading policy response. The bill, which took immediate effect upon Governor Greg Abbott's signature on June 20, 2025, is the most significant restructuring of large-load interconnection rules in ERCOT's history. It requires large loads over 75 MW to install remote curtailment equipment as a condition of interconnection, so grid operators can disconnect them during declared firm load shed events, and creates a separate voluntary demand response program, procured competitively with at least 24 hours’ notice, that those loads may elect to join. If data centers are adding substantial new load to the grid, this reasoning goes, they should also contribute to grid stability by demonstrating load flexibility—reducing power draw at times of peak demand.
While demand response programs currently exist, incentivizing voluntary curtailment from data centers is challenging. In an AI compute arms race, the value of uninterrupted compute time far exceeds any available curtailment payment, such as via PJM’s capacity market mechanisms.
Approaches to bridge that gap are coming to fruition: EPRI’s DCFlex program is working with hyperscalers and utilities to develop the technical protocols, measurement standards, and contractual frameworks that would make large-load demand response a routine grid service. Innovators like Emerald AI have demonstrated a 25% power reduction across a 256-GPU cluster over three hours during an Arizona grid stress event, while preserving compute service quality, helping to bridge the valuation asymmetry between energy and compute.
Hyperscalers are already putting a flexible load commercial strategy into action. In March 2026, Google announced 1 GW in demand response contracts with multiple US utilities, including Entergy Arkansas, Minnesota Power, and DTE Energy.
The conversation has shifted from whether data centers can be flexible to how that flexibility gets structured and deployed.
Putting a Dollar Value on Data Center Load Flexibility
For developers, investors, and grid operators navigating data center growth, the challenge has been making high-stakes siting and interconnection decisions without a clear picture of what load flexibility is actually worth, what inflexibility costs the system, or how curtailment requirements will reshape the regulatory landscape.
Prior research has established that flexible data center load can absorb substantial grid stress. For instance, research from Duke University’s Nicholas Institute found that 22 of the largest US balancing authority areas could absorb approximately 98 GW of new flexible load if 0.5% of that load’s annual energy is curtailed, or 76 GW at a stricter 0.25% curtailment level.
Relae’s analysis goes further by quantifying the economic cost at each increment of flexible load growth, and the precise threshold at which that flexibility stops being optional. We zeroed in on ERCOT, a region with high data center load growth and immediate regulatory stakes, determining the value of implementing flexibility and, conversely, the system risk of failing to do so.
How We Modeled It
Assessing the impacts of load growth and flexibility solutions requires a systems-level analysis, best achieved via power market modeling. At Relae, we deploy our in-house power system modeling framework to navigate this complexity.
Our toolkit includes CD-PyPSA-USA, used for this analysis, which is built on the Python for Power System Analysis (PyPSA) platform. This grid model simulates how power networks operate and evolve over time by solving for the least-cost optimization of the entire power system. Critically, our model is customized to explicitly represent complex, real-world dynamics, including data center load flexibility, co-located generation, and various policy constraints.
For this analysis, we simulated ERCOT operations under a range of data center growth scenarios. We modeled loads from 5 GW up to 40 GW in 5 GW increments, pairing each with sufficient on-site gas generation to cover roughly 70% of data center energy needs–a conservative estimate on the approach developers are taking today.
We ran each scenario under two conditions: no load flexibility (“flex00”, the baseline) and 25% emergency curtailment capability (“flex25”), consistent with solutions exhibited by Emerald AI. This approach allowed us to determine the system's response to step-changes in electricity demand.
Voluntary Curtailment, Forced Outages, and the Value of Lost Load
This analysis makes an important distinction between three curtailment types: one voluntary and two involuntary electricity demand reductions.
- Demand response or load flexibility (voluntary reduction): This involves industrial consumers curtailing their power requirements in response to pricing or regulatory incentives. Participation is optional.
- Mandatory curtailment (targeted reduction): This is a required, controlled reduction of power draw by a specific consumer group (e.g., data centers under Texas SB6) when directed by grid operators during declared emergencies. This is a deliberate policy directive aimed at grid stability.
- Load shedding (forced outage): This is a non-targeted, involuntary outage event, such as a rolling blackout, where the system operator must cut power to prevent grid failure. These events affect all types of consumers, including residential and commercial electricity demand.
Grid operators in Texas use a value of lost load (VoLL) of $35,000 per megawatt-hour (MWh) to measure the welfare cost borne by businesses and households who lose power involuntarily. That figure, the standard benchmark applied by ERCOT in reliability and market design analysis, is what we use as the basis for valuing shedding events in our modeling. At $35,000 per MWh, even a small number of unplanned outage hours produces welfare losses in the billions.
What Our Analysis Reveals
Before doing the analysis, we expected to see load flexibility become more important as more data center load is added to the grid, preventing forced load shedding with high lost-load costs. But we didn’t know how large this effect would be, or what amount of new data center load would start to trigger it.
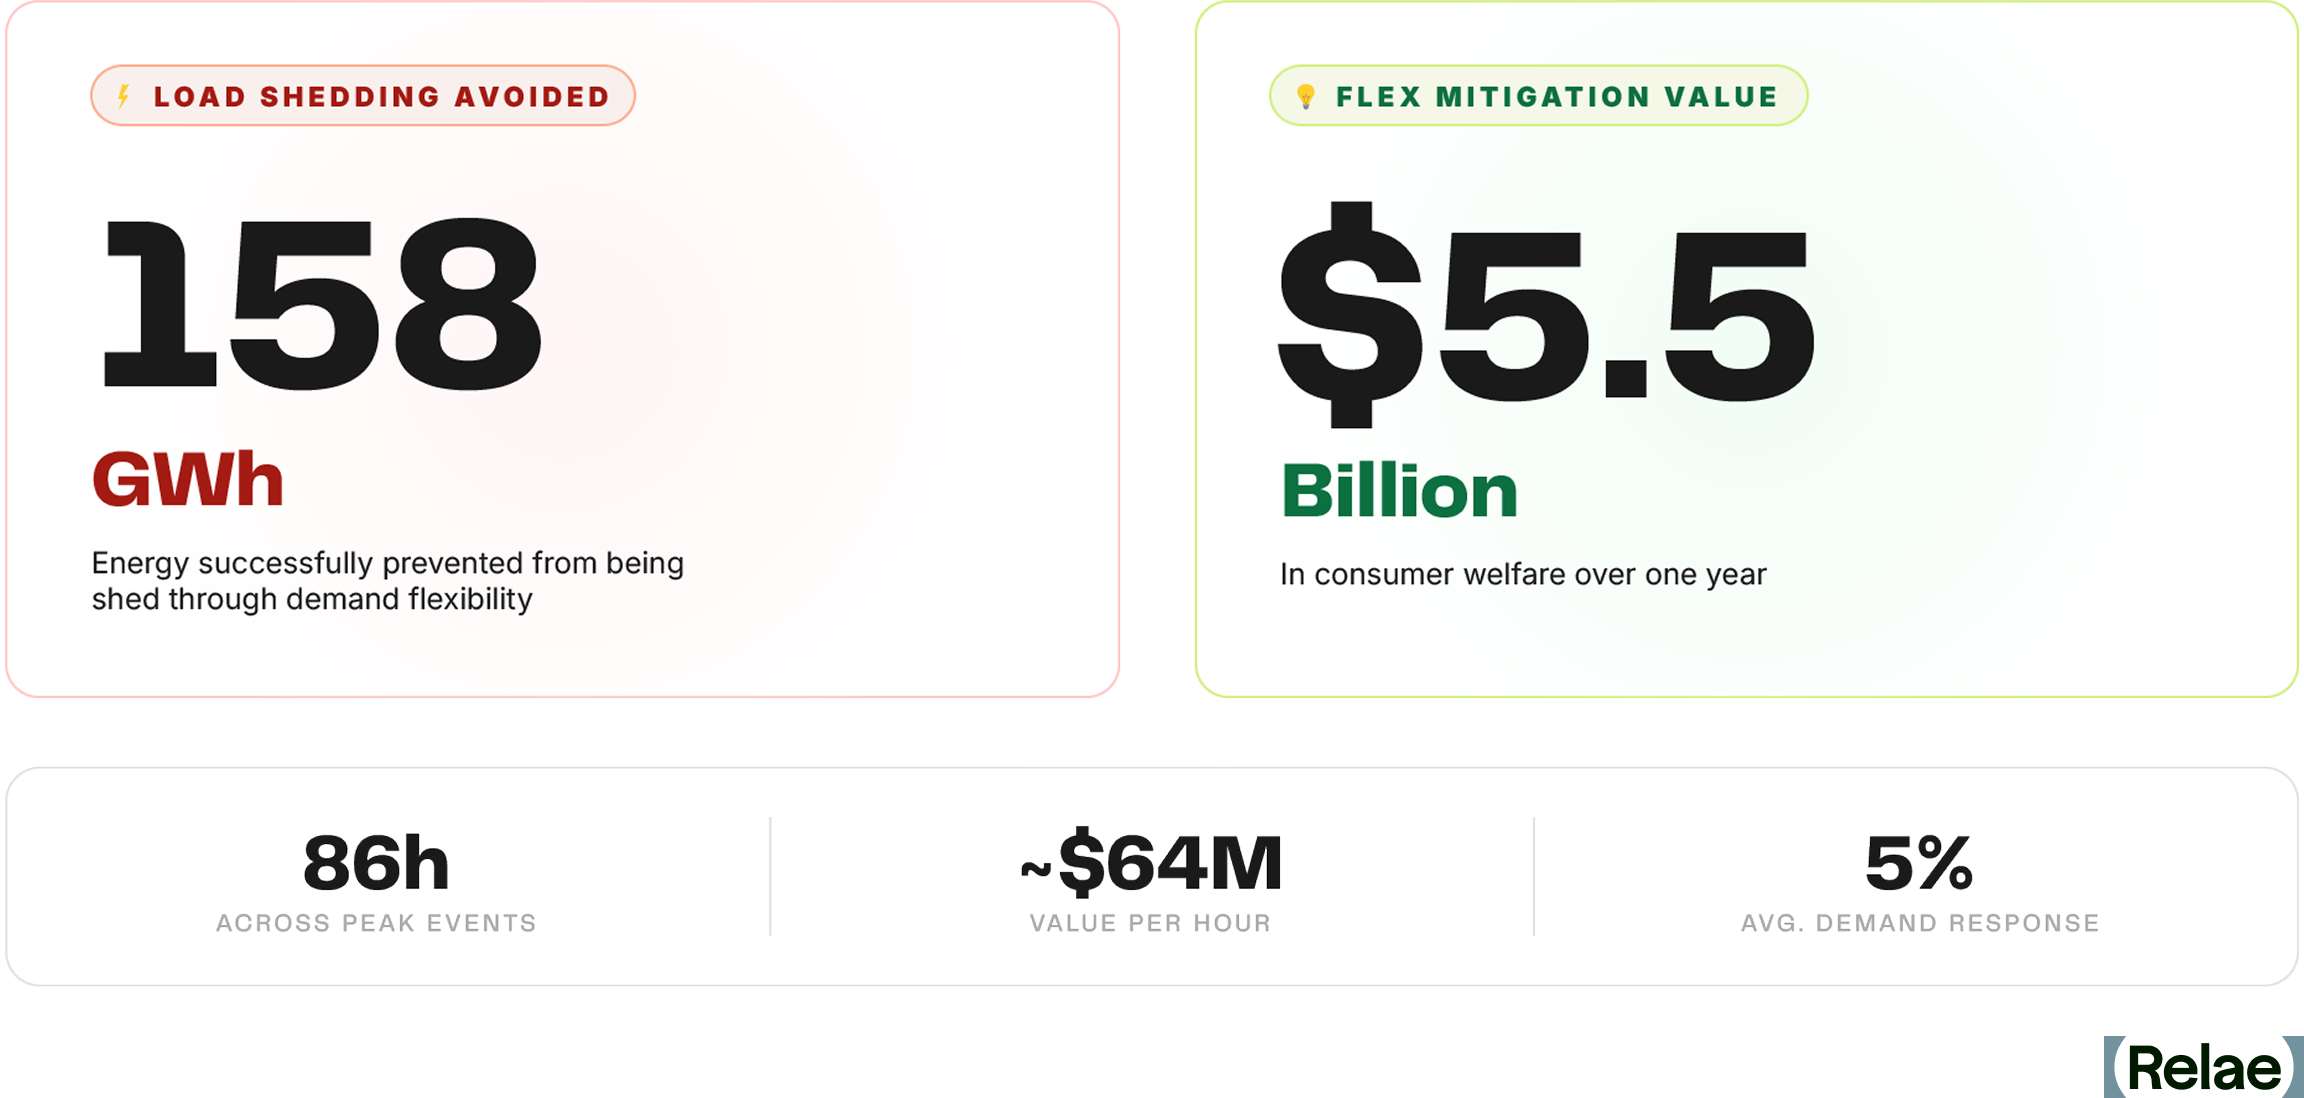
Our analysis found that without flexible load management, forced load shedding first appears at 30 GW, small in scale at first (4.4 GWh over 3 hours) but growing sharply as load increases. At 35 GW, we observe 50 GWh of shedding across 39 hours. At 40 GW, shedding reaches 158 GWh across 81 hours, equivalent to nearly three times ERCOT’s average hourly energy consumption, with an economic cost at VoLL of approximately $5.5 billion.1
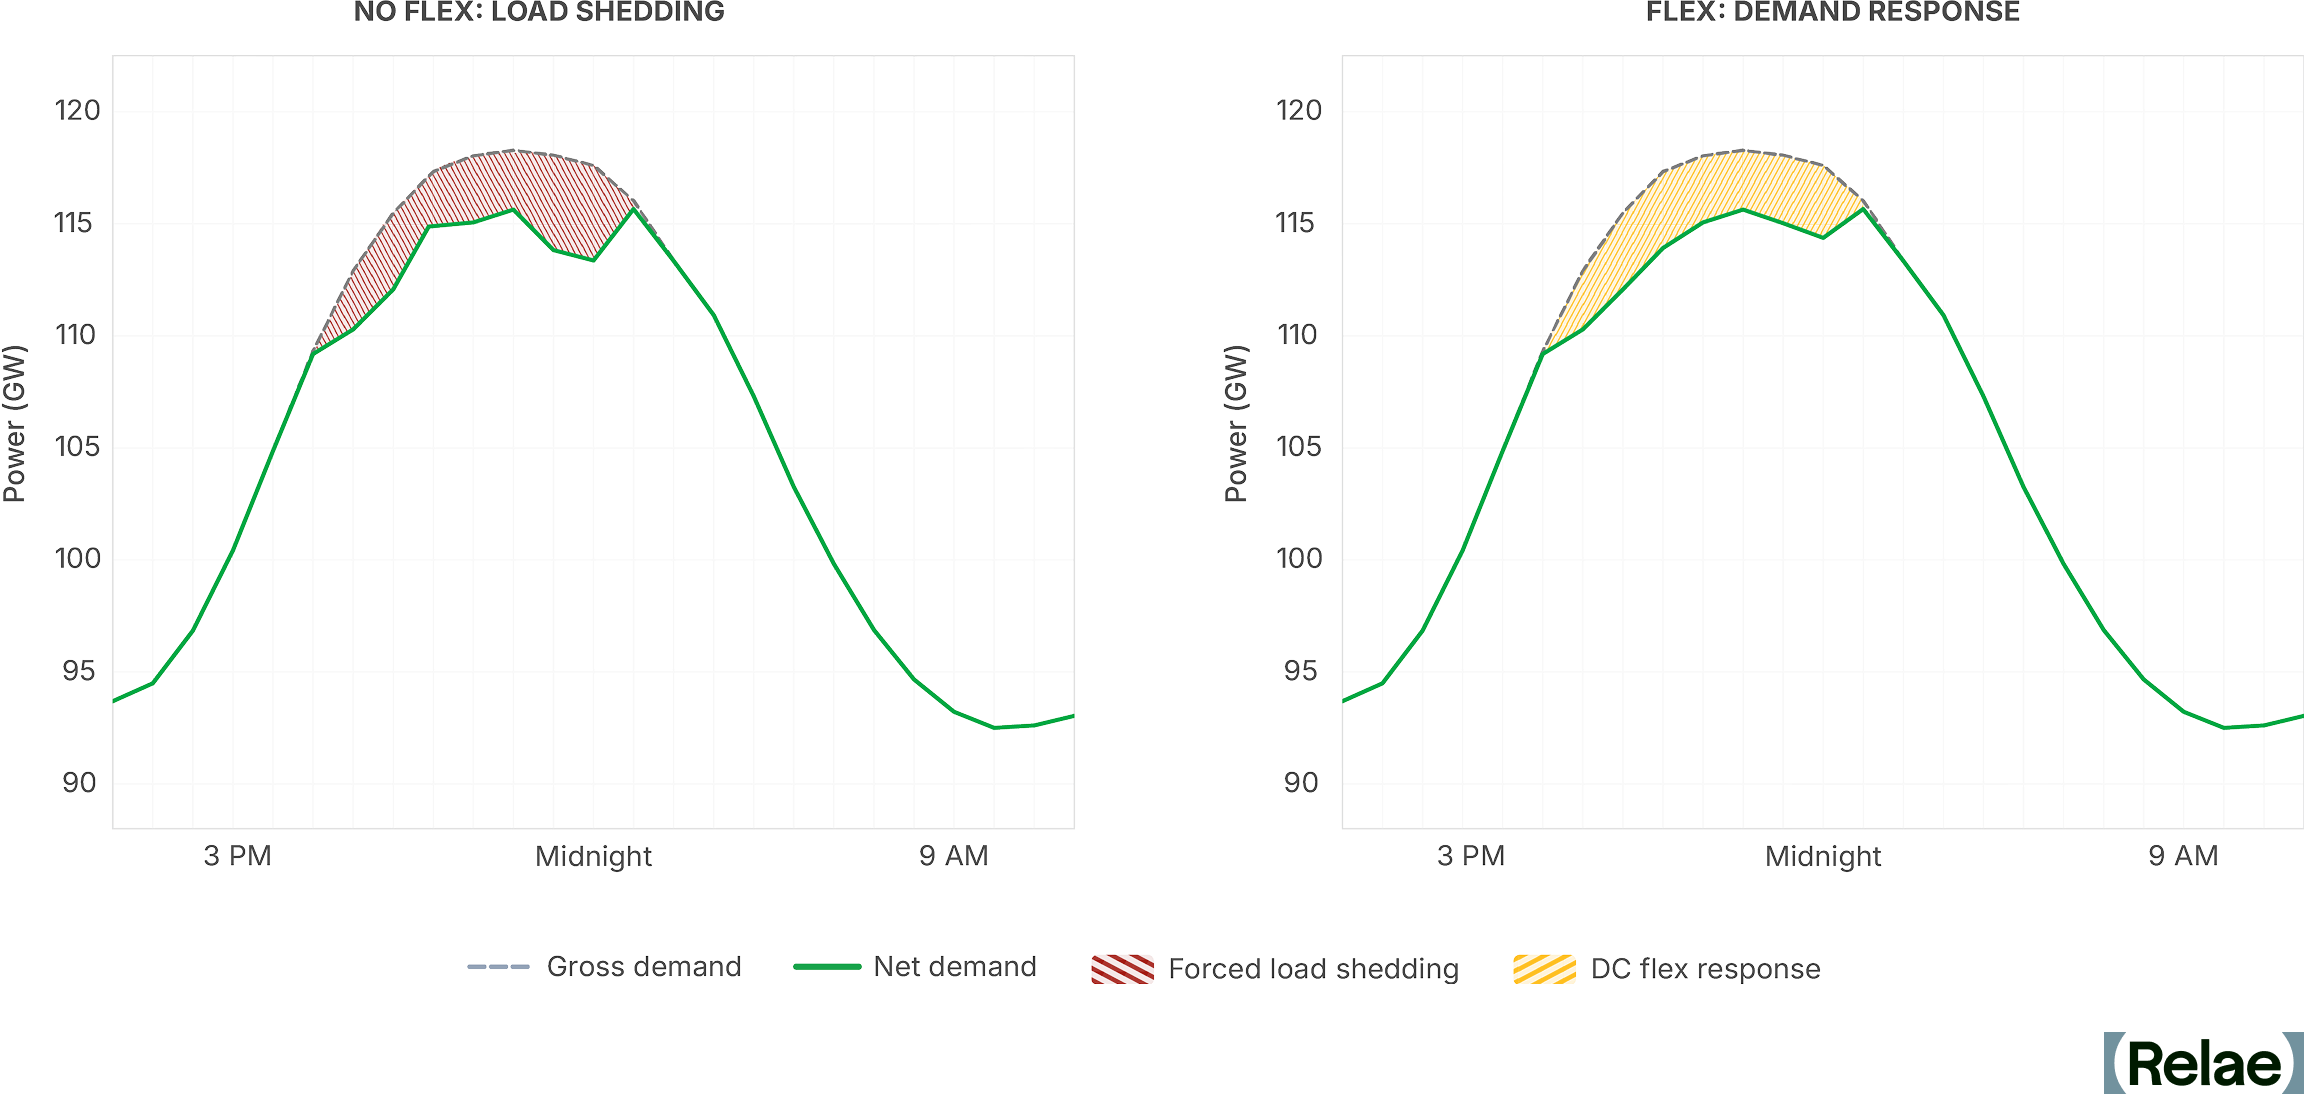
By enabling on-demand data center load flexibility, forced load shedding is eliminated in every scenario we tested. The same 40 GW case instead sees 165 GWh of controlled, short-duration curtailment spread across 86 hours, less than 1% of hours in a year. Further, the average demand response in these hours was less than 5% of the nameplate data center load, with the largest event reaching 14% of data center load. The grid stays balanced, consumers remain connected, and data centers deliver substantial value to the system via flexible loads.
Load Flexibility Is High Value and Presents an Opportunity for Storage
Our modeling puts a dollar figure on what flexible load is worth. At a VoLL of $35,000/MWh, each hour of demand response in the 40 GW scenario delivers approximately $64 million in avoided consumer welfare losses. Over a full year, that adds up to $5.5 billion, achieved through an average of just 5% demand response across the 86 hours of curtailment needed to eliminate all forced load shedding.
That value points directly to an opportunity for storage. In our model, demand response functions as a “ghost battery” at the data center’s grid node, absorbing grid stress exactly as a physical battery would, without any electrons needing to flow. That virtual battery can become a real one. On-site battery storage allows a data center to dispatch stored energy during grid stress events rather than curtailing workloads, maintaining compute continuity while relieving grid pressure.
The implications point in two directions.
- For the hyperscaler or data center operator, physical storage converts a compliance obligation into an uptime guarantee: the curtailment event becomes a battery discharge, with negligible impact to the compute stack.
- For the storage developer, co-location with large data center loads represents a high-value deployment opportunity with a clear commercial case. The avoided welfare costs per curtailment hour our model quantifies is the value a well-positioned battery asset, co-located at a data center node, can credibly claim to preserve.
The Data Centers of Tomorrow Need to be Grid Assets
The data center buildout underway is large enough to reshape grid reliability across entire regions, and the regulatory environment is beginning to reflect that scale. Texas SB6 is the most prescriptive example to date: it requires new large loads above 75 MW to install remote curtailment equipment operable during firm load shed events.
Our modeling quantifies what load flexibility is worth across this landscape: data centers with curtailment capability can provide significant value and avoid billions in consumer welfare losses annually. For developers and investors, designing that capability in from the start can convert a compliance requirement into a long-term grid asset.
The federal picture has moved in the same direction since this analysis was published. In May 2026, NERC issued a rare Level 3 Alert on computational loads; in June, FERC ordered six RTOs and ISOs to revise or justify their large-load interconnection rules, and in July, FERC directed NERC to develop mandatory computational-load reliability standards by the end of the year. We covered what that means for grid modeling and interconnection in Inside NERC’s Level 3 Alert on data center loads. Flexibility is no longer only a Texas statutory question; it is becoming part of the federal reliability framework.
Frequently Asked Questions
What is data center load flexibility, and how does it work?
Load flexibility is a data center’s ability to reduce the power it draws from the grid on short notice, during the small number of hours when the system is under stress. In practice, that means shifting or pausing deferrable compute, drawing on on-site batteries or generation, or pre-cooling the facility ahead of a peak. The point is not to consume less overall—it is to move a thin slice of demand out of the hours when the grid can least afford it.
What does Texas SB6 require of large data centers in ERCOT?
Texas Senate Bill 6, signed June 20, 2025, makes remote curtailment equipment a condition of interconnection for new loads of 75 MW or more in ERCOT, so utilities can disconnect them during declared firm load shed events. Separately, it creates a voluntary, competitively procured demand response program those same large loads can elect to join, with at least 24 hours’ notice. The mandatory piece is the disconnection capability; paid participation in demand response is a choice.
What does data center inflexibility cost? How much curtailment avoids it?
Relae’s ERCOT modeling found that without flexibility, forced load shedding first appears at 30 GW of data center load and reaches 158 GWh across 81 hours at 40 GW—roughly $5.5 billion a year in consumer welfare losses at ERCOT’s $35,000/MWh value of lost load. Enabling curtailment eliminated forced shedding in every scenario we tested, at an average of under 5% of data center demand across 86 hours, less than 1% of the year. Each hour of demand response in the 40 GW case is worth about $64 million in avoided losses.
Is data center load flexibility proven today, and how does it compare to on-site batteries?
Data center load flexibility is past proof of concept and into commercial deployment: Emerald AI cut power to a 256-GPU cluster by 25% for three hours during an Arizona grid stress event without degrading compute service quality; EPRI’s DCFlex initiative is building the protocols and contracts, and Google has signed 1 GW of data center demand response with US utilities.
On-site batteries reach the same result from the other direction—instead of curtailing workloads, the facility discharges stored energy, which is why our modeling treats demand response as a “ghost battery” at the data center’s grid node. For operators who cannot pause compute, storage turns the same compliance obligation into an uptime guarantee.
GHG Protocol Releases New Land Sector and Removals Standard
Key Takeaways
- On January 30, 2026, the Greenhouse Gas Protocol (GHG Protocol) released its long-awaited Land Sector and Removals (LSR) Standard v1.0 following a 5-year consultation process. The LSR Standard is set to take effect on January 1, 2027.
- The release of the LSR Standard represents a notable development for companies in the food and agriculture sector looking to report on land-based GHG emissions in their annual GHG inventory, as well as companies that plan to report on carbon dioxide removals (both land-based and technological).
- The accompanying Land Sector and Removals Guidance, which will provide further direction on operationalizing and implementing the LSR Standard, is expected in Q2 of 2026. However, companies with significant land-based activities may want to begin assessing the impacts of the LSR Standard on their emissions accounting procedures and decarbonization strategies today.
Why the Land Sector and Removals Standard Matters Now
Emissions from agriculture and land use change account for roughly a quarter of global emissions. Yet, for years, food, fiber, and fuel companies have lacked a clear framework for accounting and reporting on GHG emissions and carbon dioxide removals from land use. This has significantly limited their ability to demonstrate progress toward climate targets within their operations and value chain. The GHG Protocol’s Land Sector and Removals (LSR) Standard, which was released on January 30, 2026, changes that, and in doing so raises a new set of questions.
The LSR Standard provides greater clarity on what is required of companies to transparently track and report against their emissions reduction and removal targets, and opens new pathways to report on supply chain decarbonization interventions. It also represents an important advancement for companies seeking to report on carbon dioxide removals within their emissions inventory, including both land management removals and technological removals with geologic storage.
While the LSR Standard contains notable new requirements compared to the draft released in 2022, companies still face a number of open questions related to implementation and the implications for their decarbonization strategies.
The GHG Protocol’s accompanying Land Sector and Removals Guidance, scheduled for Q2 2026, is expected to offer more practical direction for implementing the LSR Standard. However, companies with significant land-based activities that require sufficient lead time to prepare should consider assessing the impacts today.
Below, we provide an overview of the LSR Standard, key changes from the 2022 draft, and actionable next steps for food, fiber, and fuel companies considering the impacts on their target-setting and emissions reporting.
What Is the Land Sector and Removals Standard?
The LSR Standard, taking effect on January 1, 2027, sets requirements and recommendations for corporate GHG accounting that cover emissions and carbon removals from agricultural and land use activities. It builds on existing GHG Protocol standards for corporate carbon accounting. Notably, the LSR Standard does not cover the forestry sector, a key break from the 2022 draft. Forest carbon accounting guidance remains under development and will be the subject of a stakeholder consultation/request for information process expected later in 2026.

Land Sector and Removals Standard vs Land Sector and Removals Guidance
The LSR Standard establishes the core requirements companies must follow, while the accompanying Land Sector and Removals Guidance, expected in Q2 of 2026, will provide more detailed implementation support. In short, the LSR Standard sets the "what" while the Land Sector and Removals Guidance will explain the "how," helping companies put those requirements into practice.
Who Should Be Using the Land Sector and Removals Standard?
The LSR Standard applies to two groups of companies:
- Any company with significant1 land-sector activities within its own operations or value chain (most notably the food, feed, fiber, biofuel, and advanced biomaterials sector).
- Any company looking to report on carbon dioxide removals within their scope 1 and scope 3 inventories (including both land management removals or technological removals).
Land management carbon dioxide removals include those from carbon sequestration through farming practices, agroforestry, or silvopastural systems on productive agricultural land. Technological carbon dioxide removals, by contrast, refer to more engineered approaches such as direct air carbon capture and storage (DACCS) or bioenergy carbon capture and storage (BECCS).
What Changed From the 2022 Draft?
Among other provisions, the LSR Standard contains notable breaks from the 2022 draft, including specific changes related to traceability, carbon dioxide removals, leakage, and land use change.
Traceability: A New Approach
Under the LSR Standard, companies that account for scope 3 emissions, removals, and other metrics must apply a spatial boundary. This boundary is determined by the level of traceability they can establish to known lands or regions (from least to most granular): global, jurisdictional (e.g., country), sourcing region (e.g., supply shed), land management unit (LMU) (e.g., farm), or harvested area. For more granular spatial boundaries, such as sourcing region and LMU, companies are required to establish physical traceability, which can be demonstrated through various chain of custody models.
The LSR Standard defines sourcing regions as predefined, spatially-explicit land areas that supply a raw material to its first point of aggregation or first processing facility in the value chain. The GHG Protocol allows some flexibility in how these boundaries are drawn. They can be defined at a tier of the value chain that includes multiple first points of aggregation or first processing facilities whose supply areas overlap.
Alongside higher integrity chain of custody models such as identity preserved, segregated, and controlled blending, the LSR Standard opens to mass balance as a chain of custody model that can be used to demonstrate physical traceability at the sourcing region-level with appropriate safeguards.
This is notable because mass balance is the most common chain of custody model for large volume agricultural commodities, and physical traceability is required to report removals according to the LSR standard. While challenges for reporting removals at sourcing region spatial boundaries still exist, this change unlocks new opportunities to decarbonize commodities and report removals within non-segregated supply chains through insetting programs.
Carbon Dioxide Removals: Clarity on Spatial Boundaries
The draft LSR Standard introduces key principles for companies choosing to report land management carbon dioxide removals, including traceability, data quality, and permanence. Translating those principles into practice remains challenging given the dynamic nature of agricultural supply chains and limited farm-level traceability.
Among other requirements, the LSR Standard maintains that companies electing to report on removals must do so as a separate accounting category from emissions. They must also identify the specific lands where carbon is stored, and conduct ongoing storage monitoring to detect and report on reversals if and when they occur.
The LSR Standard does, however, resolve one of the more consequential open questions left by the 2022 draft: where companies are to draw the spatial boundary for reporting land management carbon dioxide removals. By formalizing and permitting traceability at the sourcing-region level (with appropriate safeguards), it offers a workable middle ground between farm-level precision and the broader supply chain realities that most food and agricultural companies face.
The LSR Standard also opens to using alternative approaches to traceability, such as impact traceability, which allows companies to trace removals back to the LMU through a pathway that is separate from the physical GHG inventory. This is notable as it provides companies with optionality for recognition of farm-level supply chain investments even when physical traceability cannot be established, and inventory recognition is therefore not feasible.
Land Use and Leakage: Stronger Requirements
Finally, the LSR Standard significantly strengthens land use and economic leakage requirements compared to the 2022 draft. While the draft gave companies flexibility to choose among land-tracking metrics, the LSR Standard mandates that all companies report land occupation for both scope 1 and scope 3 in hectares and quantify land carbon leakage whenever “high leakage risk activities”2 displace food or feed production. This includes companies developing crop-based biofuels and bio-based feedstocks.
Leakage must be quantified using the Carbon Opportunity Cost, a calculation aimed at capturing how much carbon could have been stored in the absence of land management activities.
What Should Companies Do Now?
For entities reporting in accordance with the GHG Protocol’s Corporate Standard and Scope 3 Standard, the new LSR Standard goes into effect on January 1, 2027. However, the GHG Protocol’s Land Sector and Removal Guidance is not set for publication until Q2 2026, leaving many open questions related to implementation amid a short data collection and reporting cycle
In the interim, companies may consider a continuous improvement approach, evolving and improving their internal measurement and reporting mechanisms to enable more granular accounting over time. Companies may also consider running analyses to assess the impact of new requirements on the design and cost of decarbonization strategies, with a specific focus on data collection and monitoring approaches.
Ultimately, while implementation of the LSR Standard may evolve over time, it need not delay action on value chain intervention. Companies that continue investing in supply chain decarbonization are building the data infrastructure, supplier relationships, and operational resilience that yield greater visibility into supply chain risk and drive long-term value, independent of reporting standards.
As the LSR Standard's requirements develop, companies that have already begun assessing their emissions footprint and strengthening supply chain traceability and data quality are likely to be better positioned to align their reporting procedures accordingly.
How to Reduce Grid-Wide Emissions for Carbon Capture and Storage
Key Takeaways
- The opportunity: Clean, firm power is a strategic priority for large electricity buyers. Natural gas-fired generation equipped with carbon capture and storage (CCS) is emerging as a key tool in meeting this demand. The existing gas-fired power fleet in the US should be assessed to identify plants well-positioned for carbon capture retrofits that would benefit grid decarbonization.
- The challenge: The climate benefits of CCS-equipped natural gas plants depend entirely on how often they actually run. Adding carbon capture technology increases the cost to operate the equipment. These higher running costs can make the plant less competitive in auctions where the grid operator picks the cheapest power first. Without mechanisms to keep these plants running continuously, they may be outbid by cheaper, higher-polluting plants, causing grid-wide emissions to stay the same or even increase.
- The solution: Hyperscalers and other large energy buyers are creating a robust market for clean, firm power. By paying a "clean, firm premium" through long-term offtake agreements, these buyers can offset the higher operational costs of CCS, ensuring these plants are continuously utilized. This corporate leadership not only maximizes the grid-wide climate impact of each retrofit but also provides an important hedge against policy volatility, securing the investment case for clean innovation even when the future of subsidies like the 45Q tax credit is uncertain.
We Need Clean, Firm Power Now
The market signals for clean, firm power are clear. Meta’s nuclear energy projects and Microsoft’s Crane Clean Energy Center demonstrate growing interest in reliable, low-carbon electricity to support the rapid expansion of AI. Similar commitments by Google and Meta to advanced geothermal power also illustrate this trend.
One of the near-term options to meet this demand is natural gas with carbon capture and storage (CCS). As explored by Relae (formerly Carbon Direct), retrofitting existing gas facilities offers a path to reliable baseload power with low direct emissions, leveraging existing infrastructure to bypass the years-long delays typical of new grid interconnections.
Recent initiatives from Google and Calpine are already working to prove this concept at scale. This type of corporate leadership is driving the market; over the last decade, voluntary corporate procurement led to more than 40% of new clean energy capacity in the US. Further, recent procurement decisions illustrate that these players are willing to pay a “clean, firm premium” to secure round-the-clock, low-emissions sources of power.
Why Systems-Level Analysis Matters for CCS
While news of corporate procurements often makes headlines, recent analysis finds the number of supply contracts for natural gas power with CCS may outpace the number of secured offtake agreements. Without a power purchase agreement (PPA) to ensure competitive operation, or strong policy support, a generator may need to operate as a “merchant plant” in power markets, competing solely on cost.
A power plant’s ultimate climate impact is determined primarily by how it is positioned in the market, not just its facility-level technology.
How Power Markets Determine Which Plants Run
Understanding the potential of CCS to deliver clean, firm power and grid-wide decarbonization requires looking beyond the technology performance at a single facility. A retrofitted plant does not operate in isolation; its impact depends on how it interacts with the broader power market’s merit order.
The merit order is the ranking system in competitive power markets where the grid operator dispatches the cheapest offers first. Since carbon capture units are energy-intensive, the retrofitted natural gas plant incurs higher operating costs. This cost increase can inadvertently price the lower-emitting plant out of the market. Without mechanisms to ensure continuous utilization, the CCS plant is potentially outbid by cheaper, more carbon-intensive resources. This creates a risk of increased overall grid emissions.
To illustrate this dynamic, we’re sharing the results of our detailed grid modeling analyses of the Electric Reliability Council of Texas (ERCOT), which serves most of Texas, and the Southwest Power Pool (SPP), which covers parts of 14 states across the central US. Our analysis highlights the value of corporate “clean, firm premiums” in achieving maximum climate benefit and mitigating policy risk present in government subsidy support.
This type of systems-level grid modeling is necessary in understanding how facility-level reductions translate into real climate benefits. Support to incentivize continuous operation, such as corporate offtake agreements or the 45Q tax credit, is key to ensuring that retrofitting a gas power plant with CCS reduces overall grid emissions.
Offtake Agreements and Policy Support as Solutions
Power offtake from CCS retrofitted gas plants can meaningfully reduce system-level emissions. By directly matching electricity demand with the supply of power, large energy buyers – the offtakers – ensure the power plant is effectively utilized. This type of arrangement helps ensure any changes to reduce emissions intensity at the facility level translate into broader emissions reductions on the grid.
For these offtakers, the decision to pay a premium for clean power is driven by the goal of additionality – ensuring their procurement has a measurable, additional emissions reduction impact. Beyond physical energy, buyers secure Energy Attribute Certificates (EACs) for CCS, which serve as the verified proof of low-carbon generation required to satisfy corporate zero-emissions targets. As seen in the recent Google and Calpine agreement, these certificates allow buyers to claim the specific climate benefit of the CCS retrofit, justifying a premium over standard wholesale market rates to secure firm, clean delivery.
In the absence of offtake agreements, policy frameworks like the 45Q tax credit (up to $85 per ton of CO2 sequestered) serve a similar function by offsetting production costs.
However, access to this credit is not a guarantee and carries operational hurdles. To unlock the full credit value, facilities must meet stringent prevailing wage and apprenticeship requirements. Furthermore, the credit is limited to a 12-year window once the facility is placed in service, and requires construction to commence by 2033.
Beyond these eligibility requirements, the long-term outlook for 45Q involves inherent uncertainty. Recent regulatory shifts, including potential changes to the Greenhouse Gas Reporting Program (GHGRP), pose risks to the verification mechanisms required to substantiate captured tons.
Corporate offtake agreements offer a crucial private-sector complement to this landscape; they provide a stable revenue model independent of policy cycles, ensuring the investment case remains robust over the full life of the asset.
Understanding the Merit Order in Power Markets
Most US power plants operate in competitive deregulated markets, where grid operators dispatch generators based on their marginal cost of production – the cost of generating one additional unit of electricity. The operator ranks these offers from lowest to highest price, creating the "merit order.”
In these auctions, the cheapest resources (typically renewables and base load) are dispatched first. Progressively more expensive units (gas and peaking plants) are called upon until demand is met. The price of the final, most expensive unit required sets the market-clearing price received by all generators in that period.
The Figure below shows an example generation merit order in the ERCOT energy market.
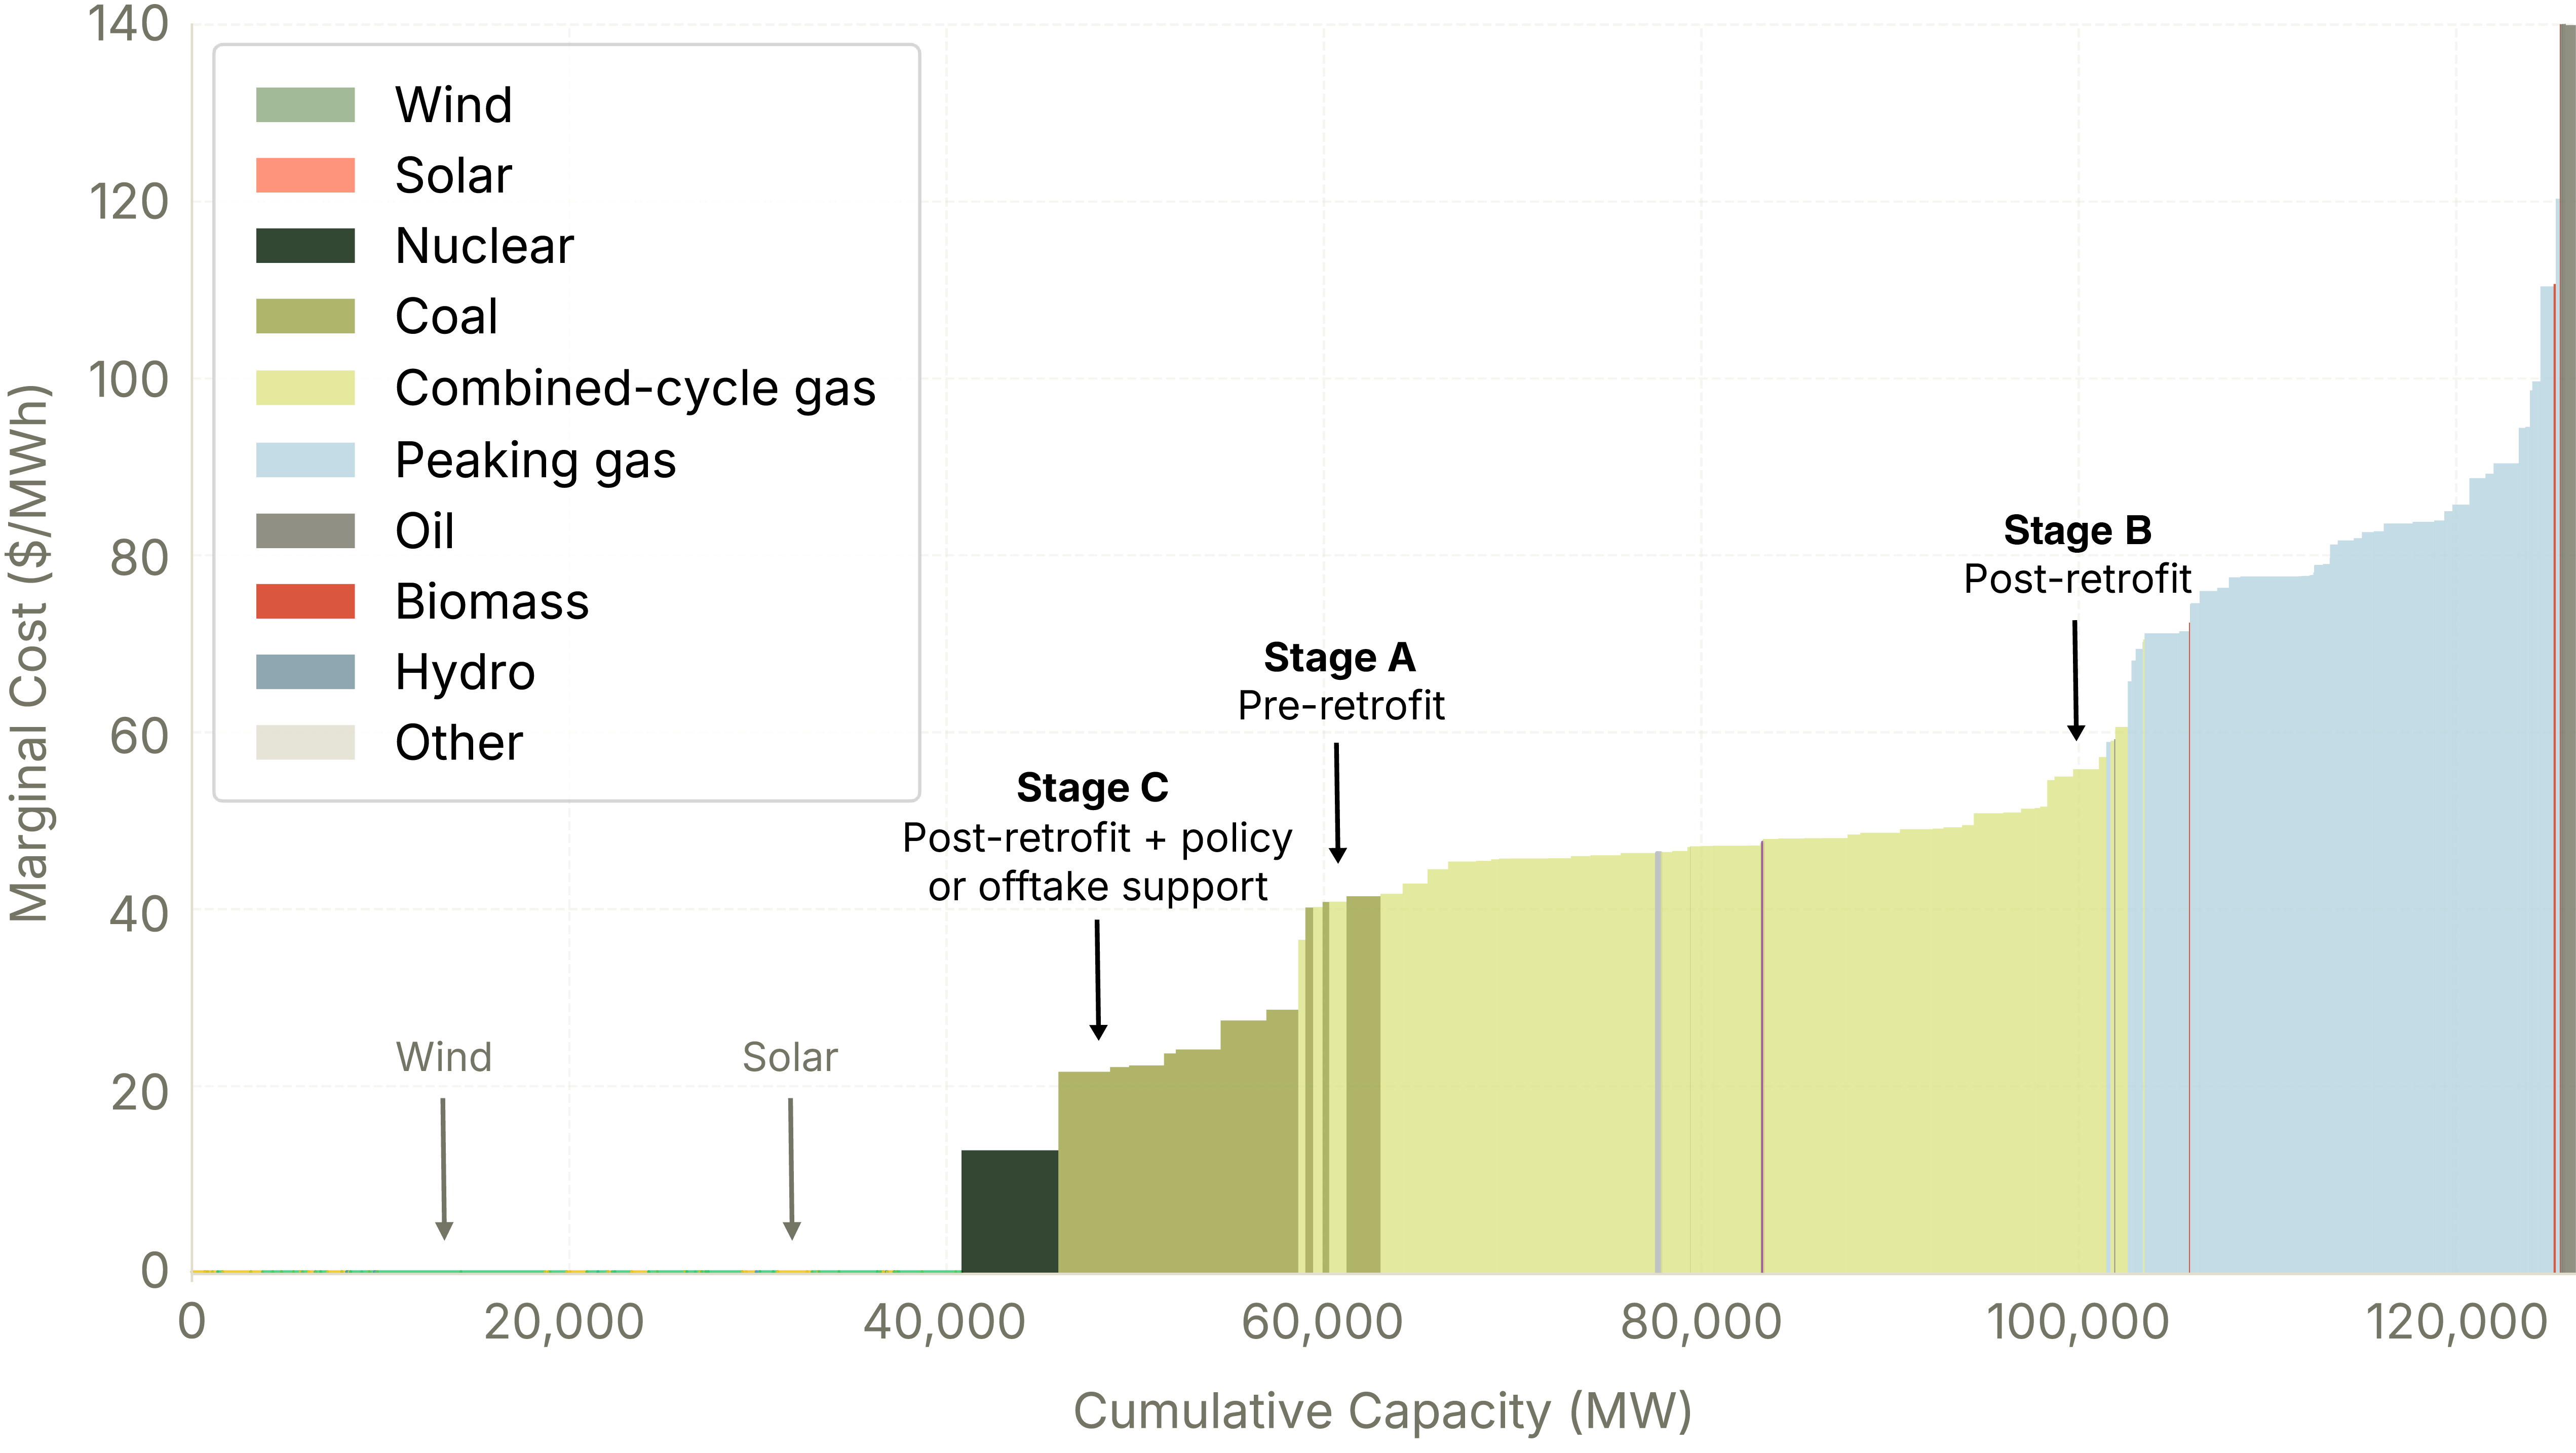
Case Study: How Support Structures Influence Dispatch
The merit order figure illustrates a hypothetical scenario for a natural gas generator, showing how its market position changes based on technical and policy variables:
- Pre-Retrofit (Stage A): The plant operates with standard marginal costs, sitting competitively in the middle of the supply stack.
- Post-Retrofit (Stage B): Retrofitting with CCS introduces higher operating costs due to the energy-intensive nature of carbon capture. Without external support, the plant’s marginal cost increases (A to B), making it less competitive. The retrofitted plant may be utilized less while cheaper units are dispatched to meet demand.
- Post-Retrofit + policy or offtake support (Stage C): Financial support, whether through the 45Q tax credit (approx. $33/MWh1) or a corporate offtake agreement, can effectively offset the plant’s higher operational costs (B to C). This effect restores the plant’s competitiveness, ensuring it dispatches consistently.
Testing This With Grid Modeling
At Relae, we apply state-of-the-art grid analysis tools to answer these and more complex analytical questions related to the future energy system. Our custom modeling framework has been used to simulate clean power strategies, assess data center demand response programs, and understand how procurement decisions today impact the future energy system.
While the theoretical impact of a CCS retrofit, a PPA agreement, and the 45Q tax credit on a plant’s dispatch is clear, it’s important to put the theory to the test by modeling their effects on system-wide emissions.
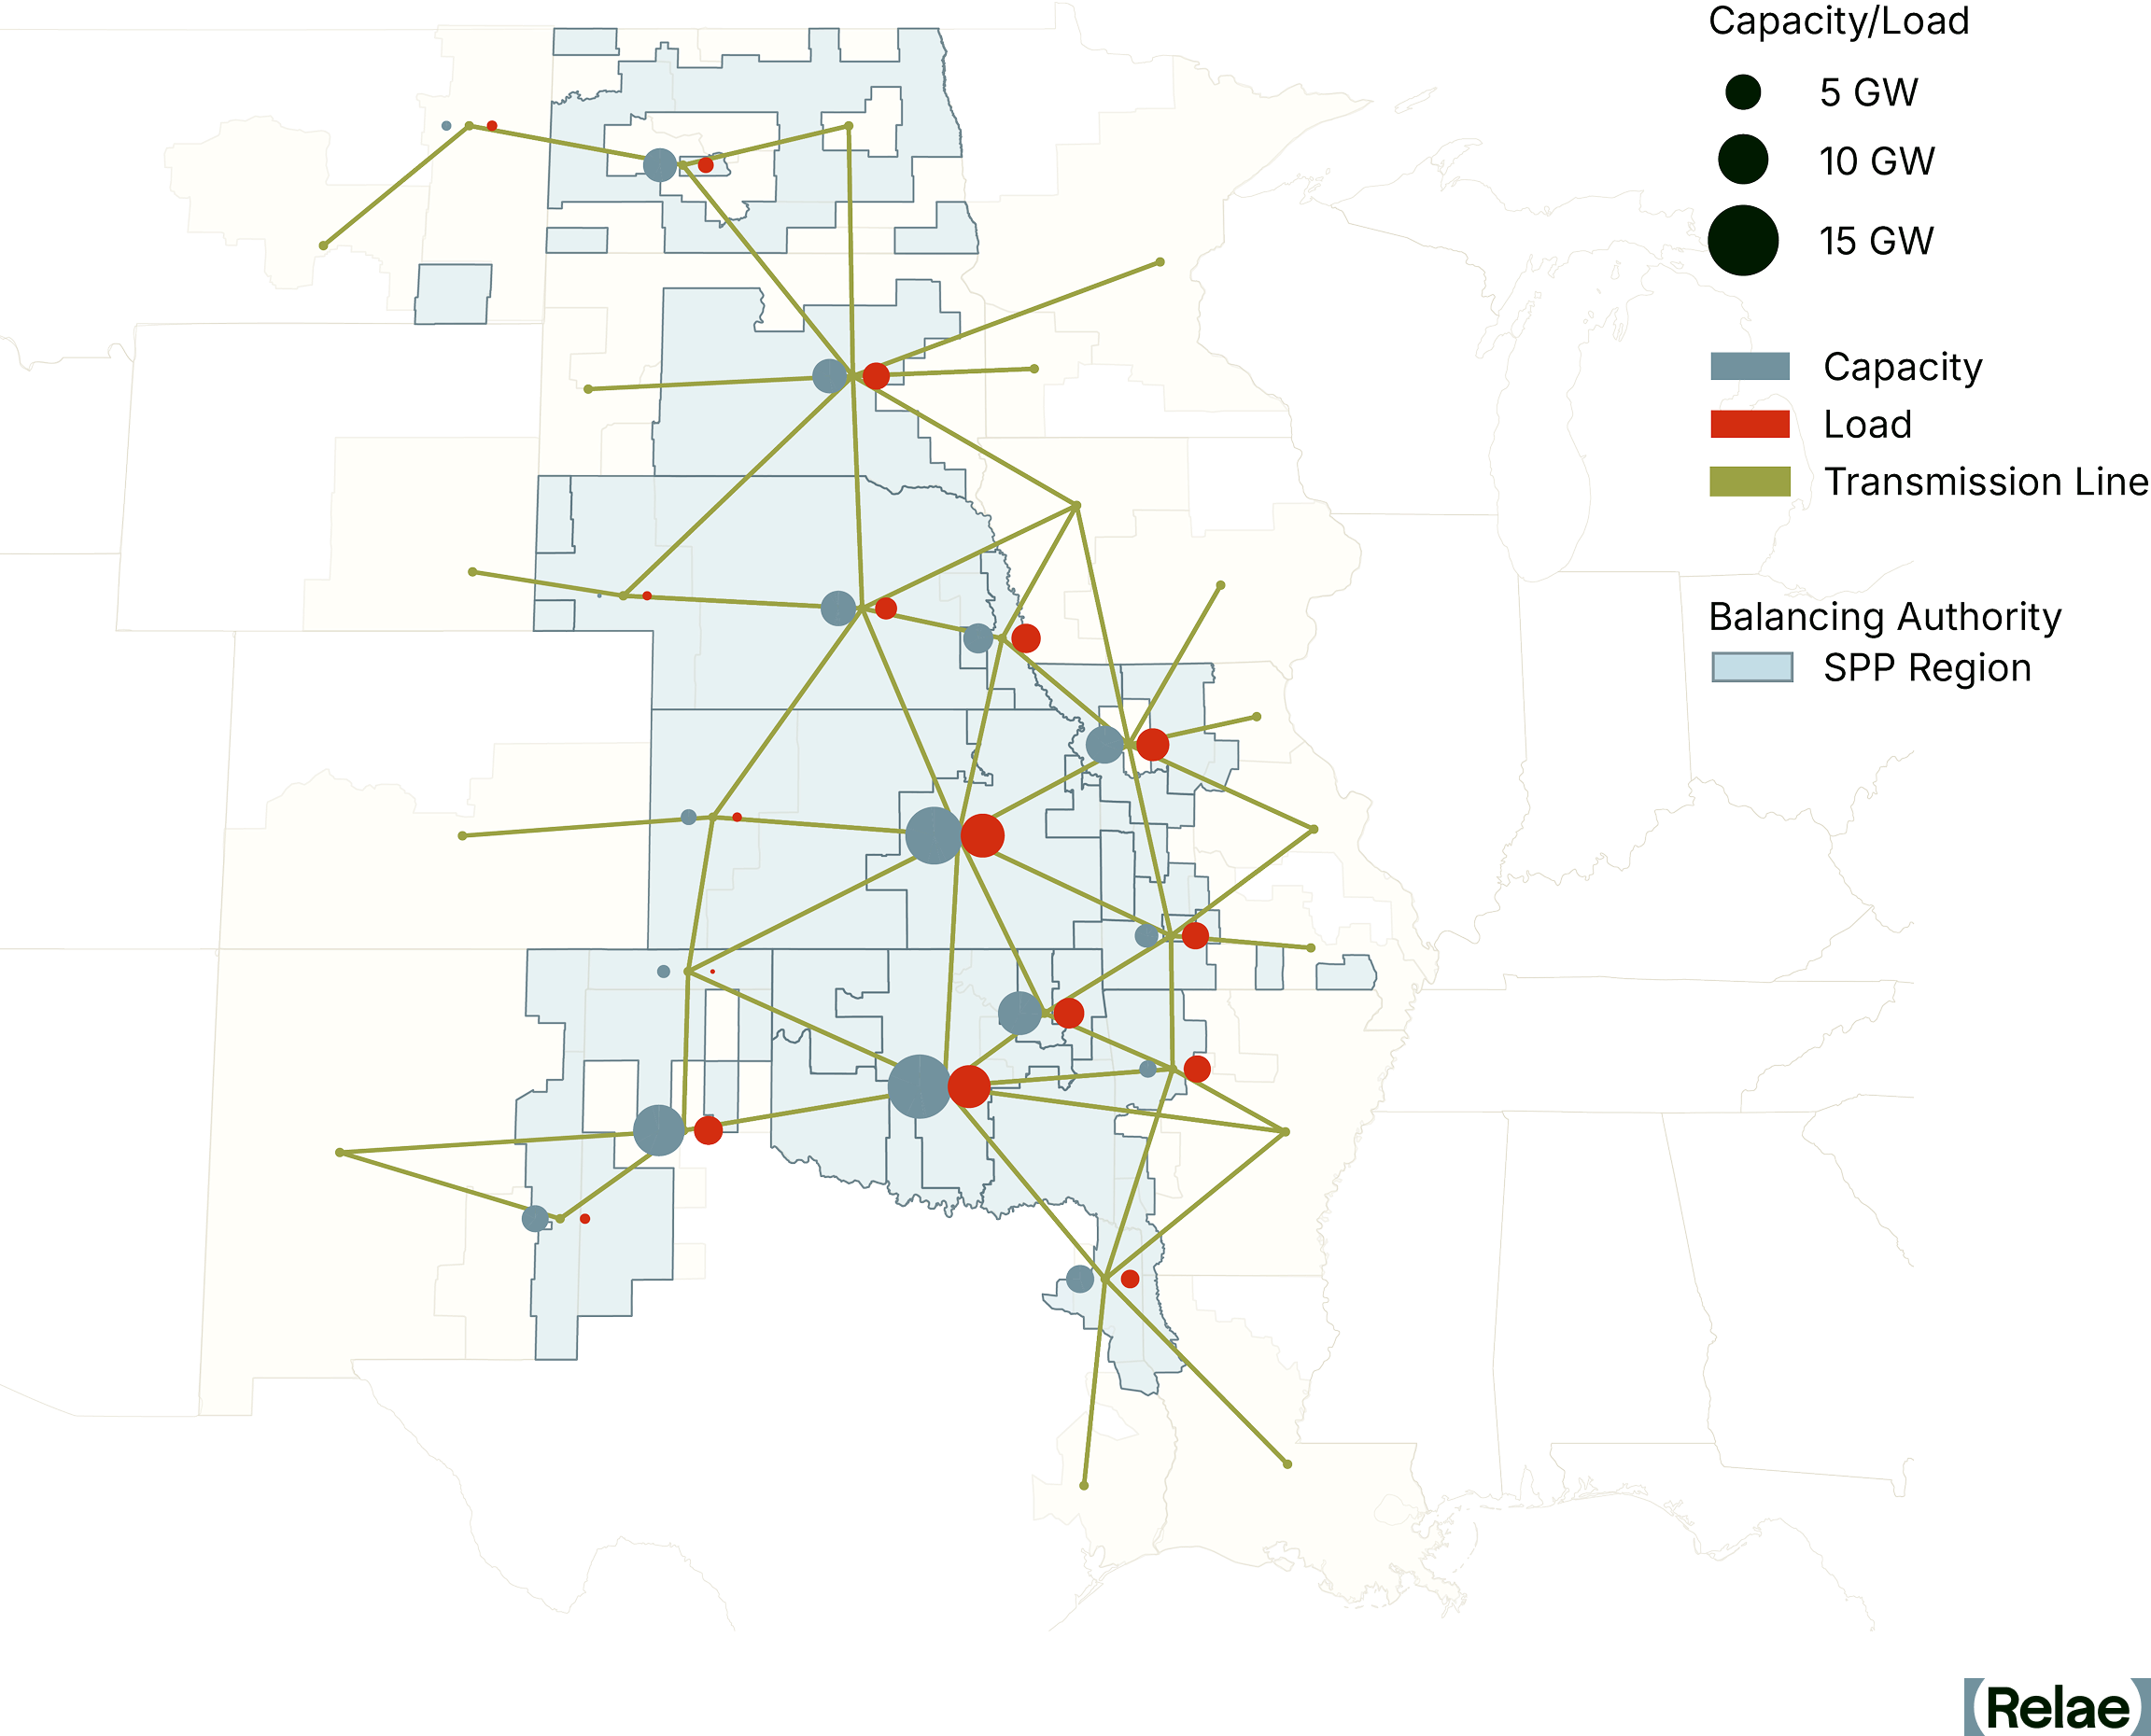
Our Modeling Approach
Because each grid region has distinct power plants and load requirements, they must be modeled separately. For this analysis, we chose to model the ERCOT and SPP power markets to determine the region-specific, grid-wide emissions impact of hypothetical CCS retrofits of natural gas power plants.
As part of this modeling, we:
- Deployed detailed hourly simulation: We used our custom PyPSA-USA grid model to produce a set of hourly simulations of the ERCOT and SPP electricity markets.2
- Identified suitable retrofits: We identified suitable combined cycle gas power plants for a CCS retrofit in each of the markets, based on key commercial and operational criteria, including size, age, generation profile, and proximity to CO2 transport/storage.
- Modeled plant and energy assumptions: To reflect the retrofit, we adjusted generator cost and energy use for the identified plants (up to 1.4 GW capacity), fitting all combustion turbines with capture and requiring each plant to consume 20% more fuel per unit of electricity produced to power CCS.3
- Carried out comparative scenario analysis: We simulated several scenarios, including (1) pre-retrofit, business-as-usual, (2) post-retrofit, with and without a PPA, and (3) post-retrofit, with and without the 45Q tax credit, to isolate the impact of different procurement agreements and policy landscapes on grid-wide emissions.
What Our Analysis Reveals
Results of this analysis reveal how CCS deployment in the power grid interacts with market economics and the role mechanisms that drive high utilization of CCS retrofit plants can have in ensuring system-wide emissions reductions:
CCS With a Firm Offtake Agreement Can Significantly Reduce Grid-Wide Emissions
Pairing a retrofitted plant with a dedicated offtaker can drive meaningful emissions reductions in both ERCOT and SPP compared to business-as-usual (-0.8% to -1.7% CO2 in ERCOT; -5.2% to -7.3% CO2 in SPP). Under these arrangements, system-wide emissions fall because the PPA acts as an operational anchor, ensuring the retrofitted plant maintains high utilization rates despite its higher running costs. Ensuring the plant stays utilized prevents the grid from reverting to more carbon-intensive generation to fill the gap.
Our analysis finds the value of the operational “clean, firm premium” for natural gas with CCS power is up to $60 per MWh. This value varies by hour, region and scenario but results generally align with our previous estimate of a $30 per MWh value associated with this type of generation. Other estimates put this value between $19 and $72 per MWh.
CCS Without an Offtake Agreement Can Reduce Emissions, But Is More Reliant on Policy Support
Without a dedicated offtake agreement or policy support, retrofitting natural gas plants with CCS runs the risk of a small increase in grid emissions (+0.7% CO2 in ERCOT; -0.0% CO2 in SPP). System-wide emissions are higher because other power plants displace the plants with carbon capture. The higher operational costs of CCS mean the CCS plants have a less competitive place in the merit order and run for fewer hours in the year.
The story changes with the application of 45Q, and grid-wide emissions are lower for both ERCOT and SPP (-1.7% CO2 in ERCOT; -3.4% CO2 in SPP). Access to the 45Q tax credit improves each CCS plant’s position in the merit order, meaning that it runs for more hours and successfully displaces higher-emitting generation with clean, firm power.
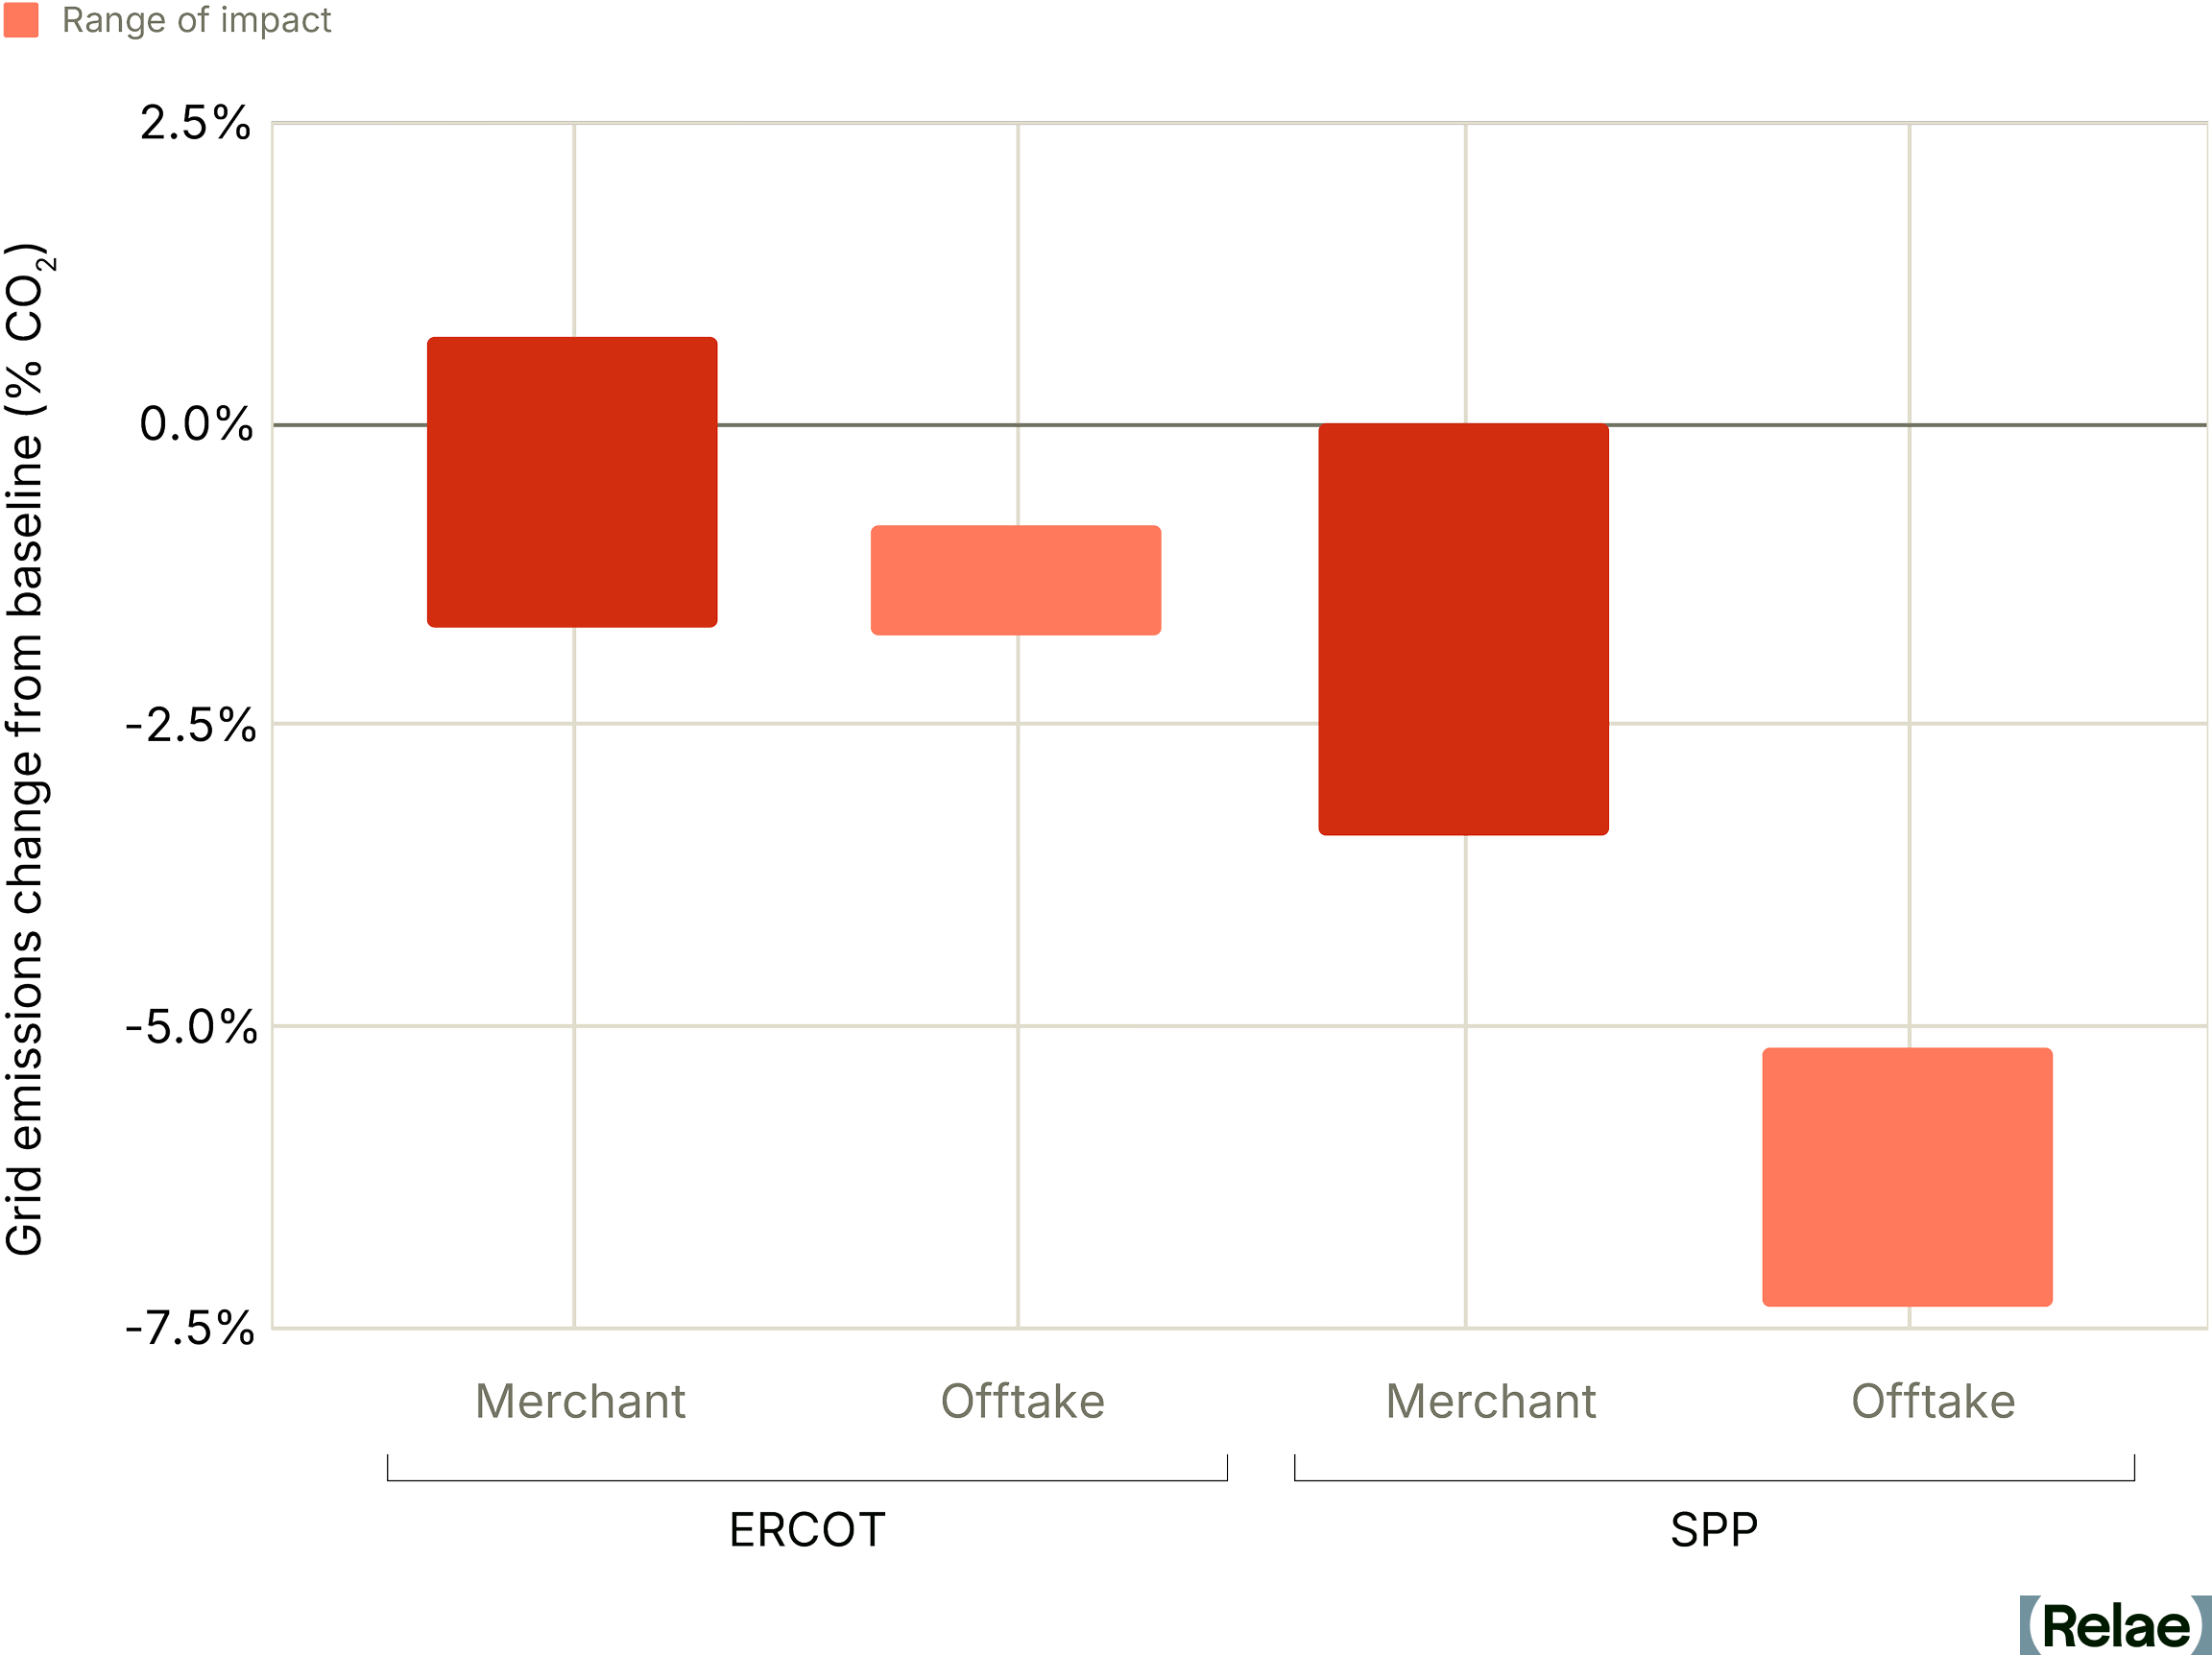
The Path Forward for Clean, Firm Power
Our analysis illustrates that in competitive power markets, the overall carbon emissions impact of natural gas generation with CCS cannot be measured solely at the power plant level. While clean, firm power remains a strategic priority for large electricity buyers, and CCS is a key tool to meet this demand, the overall climate value of a successful retrofit is linked to the availability of offtake agreements and the plant’s position in the merit order.
A systems-level perspective captures what facility-level analysis misses: how market dynamics determine the true climate impact of decarbonization investments. Support mechanisms for the continuous operation of low-carbon power plants, like PPAs and the 45Q tax credit, are important tools that ensure clean, firm power reaches the grid, effectively bridging the competitiveness gap.
Frequently Asked Questions
How can companies ensure CCS retrofits actually reduce grid-wide emissions?
By securing the plant’s dispatch through a long-term offtake agreement, or by utilizing a policy incentive like 45Q. Relae’s modeling found that offtake agreements have a substantial impact on the emissions reduction potential of CCS retrofits.
Why would the dispatch decisions of one power plant affect others?
Power plants dispatch according to marginal cost, and grid stability requires that total supply remain constant at any given moment. So, if one large plant suddenly dispatches less (say, because its operating costs have increased), other potentially dirtier plants may ramp up to fill the gap, increasing total system emissions.
Key Trends in the 2026 Voluntary Carbon Market
Key Takeaways
- What's happening: The voluntary carbon market (VCM) stalled in 2025, with carbon credit retirements falling 7% despite a 227% surge in corporate climate commitments.
- Why it matters: Over 80% of high-durability carbon removal capacity is at risk of not being realized without additional offtake.
- The implication: For corporate buyers with 2030 climate targets, early movers will define market standards and secure the supply they need, while those who wait risk volatility and constrained access to high-quality credits.
Why the Voluntary Carbon Market Needs Action Now
The voluntary carbon market stands at a crossroads. Credit retirements in 2025 fell far below the billion-tonne-scale projections from earlier in the decade. There is a widening gulf between climate ambition and market action.
The VCM transacts credits that avoid, reduce, or remove emissions. Carbon dioxide removal (CDR), the process of removing and durably storing atmospheric CO₂, remains a small but critical segment, accounting for 5% of credits retired. Limiting overshoot of 1.5°C requires a rapid scale-up of CDR.
However, most organizations with 2030 climate goals have yet to engage in CDR procurement. Without clear market signals today, CDR supply will falter. What's missing isn't capability or knowledge, but the commitment to act. Early movers will define the market in its early stages, while latecomers may face volatility and uncertain supply.
Our latest analysis reveals both troubling trends and clear pathways forward for CDR buyers ready to move from commitment to execution.
[cta]
Five Years of Stagnation: The VCM Falls Short of Projections
For five consecutive years, muted growth and persistent oversupply of poor-quality credits have defined the market. In 2025, credit retirements—a proxy for spot-market demand—reached 157 million metric tonnes (Mt), down 7% from 2024.
This incremental growth is far below what market analysts anticipated earlier in the decade, when several projections expected demand to exceed 1 billion tonnes by 2030.
VCM Credit Trends: Concentrated in Avoidance and Reduction
The VCM has historically been concentrated in avoidance and reduction carbon projects, largely dominated by REDD+, renewable energy, and cookstove credits. 2025 marks the first year a new credit type has dominated, though: projects that reduce emissions of superpollutants now make up roughly 20% of all credits issued in the VCM. Superpollutant issuances increased by about 180% between 2020 and 2025, while retirements grew by roughly 150%.
CDR Remains a Small but Critical VCM Segment
In 2025, CDR credits accounted for only 5% of 2025 retirements, but have a more active forward offtake market—where buyers commit today to purchase credits that will be delivered in the future, providing crucial early-stage financing for projects.
Within the CDR category, high-quality credits are still hard to find. Applying our Criteria for High-Quality Carbon Dioxide Removal, we find that less than 10% of the CDR projects we review meet our high-quality threshold with minimal reservations.
Nature-Based CDR Dominates the Spot Market
Of the all CDR credits issued in the VCM in 2025, 95% originated from nature-based CDR pathways, while 5% represented high-durability CDR pathways such as biochar or bioenergy with carbon capture and storage (BECCS). This distribution reflects the mature role that nature-based CDR projects continue to play in the market, alongside the early stage of durable CDR deployment.
Within nature-based credits, supply and demand dynamics differed significantly between afforestation, reforestation, and revegetation (ARR) and improved forest management (IFM).
- For ARR credits, issuances and retirements have tracked closely at a roughly 1:1 ratio, with issuances remaining flat at around 7–8 Mt annually over the past four years, leaving little inventory available for spot purchasing.
- IFM credits, by contrast, have grown 2.5-fold since 2023, making them one of the largest sources of growth within nature-based credits, though high-quality CDR credits from IFM are in much lower supply.
For buyers, this means ARR credits are increasingly difficult to source on the spot market, while IFM credits are more readily available—though careful diligence is needed to identify high-quality projects.
Nature-based offtakes and commitments have expanded in recent years, with more than 90 Mt of future delivery now contracted or committed. The vast majority of these commitments are concentrated in ARR projects, highlighting both the supply constraints facing ARR today and buyers' foresight in securing the supply they will need in the near future.
High-Durability CDR Is Almost Entirely Forward-Looking
The spot market for high-durability CDR credits represents only 0.3% of activity in the VCM, but important dynamics are beginning to emerge as more high-durability CDR technologies reach the market.
From 2021 to 2025, roughly 80% of high-durability issuances and retirements came from biochar and geologic storage. However, the emergence of large-scale geologic CDR projects is beginning to shift the balance, with individual projects capable of delivering hundreds of thousands of tonnes annually. Early-stage methodologies such as enhanced rock weathering (ERW) and ocean alkalinity enhancement (OAE) issued their first credits in 2025, totaling roughly 12,000 tonnes.
While the spot market for high-durability CDR is growing and diversifying, forward offtake agreements continue to define the landscape. The ratio of high-durability spot retirements to volumes committed through forward offtake is 1:70—meaning for every tonne retired today, 70 tonnes have been committed for future delivery.
Forward Offtake Commitments Are Rising Across CDR Pathways
To date, forward offtake agreements, advanced market commitments (AMC), and large contracted deals with intermediaries cover more than 40 Mt of high-durability CDR, in addition to over 90 Mt of nature-based CDR. These cumulative volumes highlight the increasingly central role of forward purchasing in shaping future supply, particularly for capital-intensive, high-durability pathways.
However, the success of forward offtake strategies depends critically on careful due diligence. Without a rigorous assessment of technological readiness, project viability, and delivery risks, forward commitments risk financing projects that fail to deliver, undermining both individual investments and broader market confidence.
Market Concentration of Forward Offtake Remains High
A small group of companies continues to drive the majority of forward offtake activity. In 2025, Microsoft remained the clear market leader, accounting for roughly 60% of contracted nature-based CDR offtakes and more than 80% of high-durability offtakes with a named buyer announced to date. Other active buyers—including Google, JPMorgan Chase, Equinor, and Amazon—have expanded their commitments, but overall market concentration remains high.
This concentration reveals both opportunity and risk: while anchor buyers are proving the market model works, broader participation is needed to unlock the full scale of CDR deployment required.
Growing Gap Between Climate Ambition and Market Action
Corporate climate targets anchor most current VCM activity: All of the top-10 buyers in the market today participate based on either self-declared commitments or net-zero commitments aligned with the Science Based Targets initiative (SBTi).
Demand forecasts based on these future commitments project that total CDR demand could reach 46-110 Mt by 2030, a ~6-14x growth from today. Yet, how companies decide to implement their targets will ultimately affect the composition of CDR demand within the VCM.
Rather than relying solely on public commitments, we analyzed the behavior of companies that are actively purchasing CDR today. Should today's top buyers follow through on their stated CDR commitments, CDR demand could reach a minimum of 28 Mt by 2030, with 6.5 Mt of demand for high-durability CDR.
However, the discrepancy between observed demand and target-led scenarios shows a persistent gap between what companies say and what they do. SBTi reported a 227% surge in companies setting both near-term and net-zero targets in the 18 months leading up to mid-2025, while carbon credit retirements in the VCM fell 7% in 2025.
Shifting from intention to execution will ultimately determine whether the VCM evolves into a durable, functioning marketplace or stalls short of the scale required for credible, net-zero pathways.
Rising Trends of Greenhushing and Anonymity Obscure CDR Demand
In the broader VCM, 55% of tonnes retired on the spot market over the past three years have been anonymous, and that fraction has been increasing. A similar trend is true of high-durability CDR: nearly 40% of all offtake transactions made in 2025 did not disclose the participating buyer. This buyer behaviour could reflect the often-discussed greenhushing phenomenon.
When anonymous actors dominate, it becomes harder to track demand signals, verify corporate progress, and establish clear integrity benchmarks. This opacity creates systemic risk for the entire market.
Market Growth Tipping Points on the Horizon
Several pivotal events on the horizon could mitigate risk and unlock project development, tipping buyers into action after half a decade of limited market growth:
- Voluntary demand: SBTi's Corporate Net Zero Standard V2.0, published in June 2026, confirms credits still can’t count toward scope 1-3 targets, but introduces a voluntary recognition program starting in 2027 and mandatory removal purchasing for large companies from 2035, starting at 1% of footprint.
- Compliance demand: The UK's Emissions Trading Scheme (ETS) Authority has already committed to integrating carbon removals into the UK ETS by 2028 via an auction model. This is the first confirmed large-scale compliance pathway for CDR credits, though credit-type eligibility is still being worked out.
- Regulatory support: Publication of Article 6.4 methodologies under the Paris Agreement and loosening of CORSIA credit supply bottlenecks could expand eligible supply and boost buyer confidence.
These tipping points in policies, standards, and market structures are advancing with clear timelines, creating conditions to move CDR procurement from hesitation to activation.
CDR Supply Faces Critical Challenges
While buyer inaction poses one threat to market growth, the supply side faces its own critical challenges.
30%–220% More Investment Is Needed in Nature-Based CDR Supply
Nature-based CDR would require a 30%–220% increase in finance to support current corporate targets. Relae (formerly Carbon Direct) has identified US$18 billion in publicly committed funds for nature-based CDR announced from 2018 to 2025. If deployed immediately to generate high-quality CDR, this level of funding could translate into up to 32 Mt per year by 2030 and 290 Mt cumulatively through 2040.
This is sufficient to meet the conservative 28 Mt demand floor from today's active buyers—but falls well short of what would be needed if even a fraction of companies with 2030 targets begin executing on their stated commitments.
80% of High-Durability CDR Projects Are at Risk
The situation is more acute for high-durability CDR. We estimate that over 80% of the total 2030 credit supply pipeline is at risk, due to insufficient project offtake and financing agreements.
Without increased offtake and financing support, we expect that the landscape for capital-intensive, high-durability CDR may consolidate
CDR Buyers Will Determine Which Projects Get Built
The supply-side ecosystem features a sufficient number of high-quality CDR suppliers with the potential to scale. These suppliers face purchasing behavior insufficient to meet buyers' own stated climate goals. In this environment, every CDR procurement decision matters. Companies that delay procurement risk missing their own climate targets while also ceding competitive advantage to early movers who secure the limited supply of high-quality credits.
Five Actions to Strengthen the CDR Market
Buyers and investors can play a critical role in reducing project risk and strengthening the CDR market. Our full report details five essential actions:
- Use purchasing power wisely
- Prioritize project diligence
- Construct bankable contracts
- Support market data transparency and CDR goals
- Undertake project assurance
Each action addresses specific market failures and, when implemented strategically, can significantly improve the likelihood that high-quality CDR projects reach operation and deliver credits as contracted.
With 2030 only four years away, the window for action is rapidly closing. Early movers will secure supply and define market standards, while those who wait risk entering a crowded market with limited access to high-quality credits and escalating prices.
[cta]
Frequently Asked Questions
Why did the voluntary carbon market stall in 2025 despite rising corporate climate commitments?
Retirements fell 7% even as SBTi reported a 227% surge in companies setting near-term and net-zero targets. The gap reflects that most companies with 2030 goals haven't yet moved from setting targets to actually procuring credits.
Is carbon dioxide removal a proven market today, or still emerging?
CDR remains a small segment—about 5% of 2025 retirements—but it has an unusually active forward market, with buyers committing today to volumes delivered years from now. High-durability pathways like biochar and geologic storage are still early-stage relative to nature-based credits.
How does the new SBTi Net-Zero Standard affect corporate carbon credit strategy?
Under the new SBTi Net-Zero Standard, credits still can't be counted toward scope 1, 2, or 3 targets. But it introduces a voluntary recognition program starting in 2027, and requires large companies to begin purchasing carbon removals from 2035, starting at 1% of their footprint.
What should CDR buyers prioritize given current market conditions?
Given how concentrated forward offtake activity is today, buyers should prioritize rigorous project diligence and bankable contract structures over simply committing volume—the 2026 State of the Voluntary Carbon Market report details five recommended actions in more depth.